Page last updated: 04 September 2024
Table of Contents
How many tourists visit Australia each year?
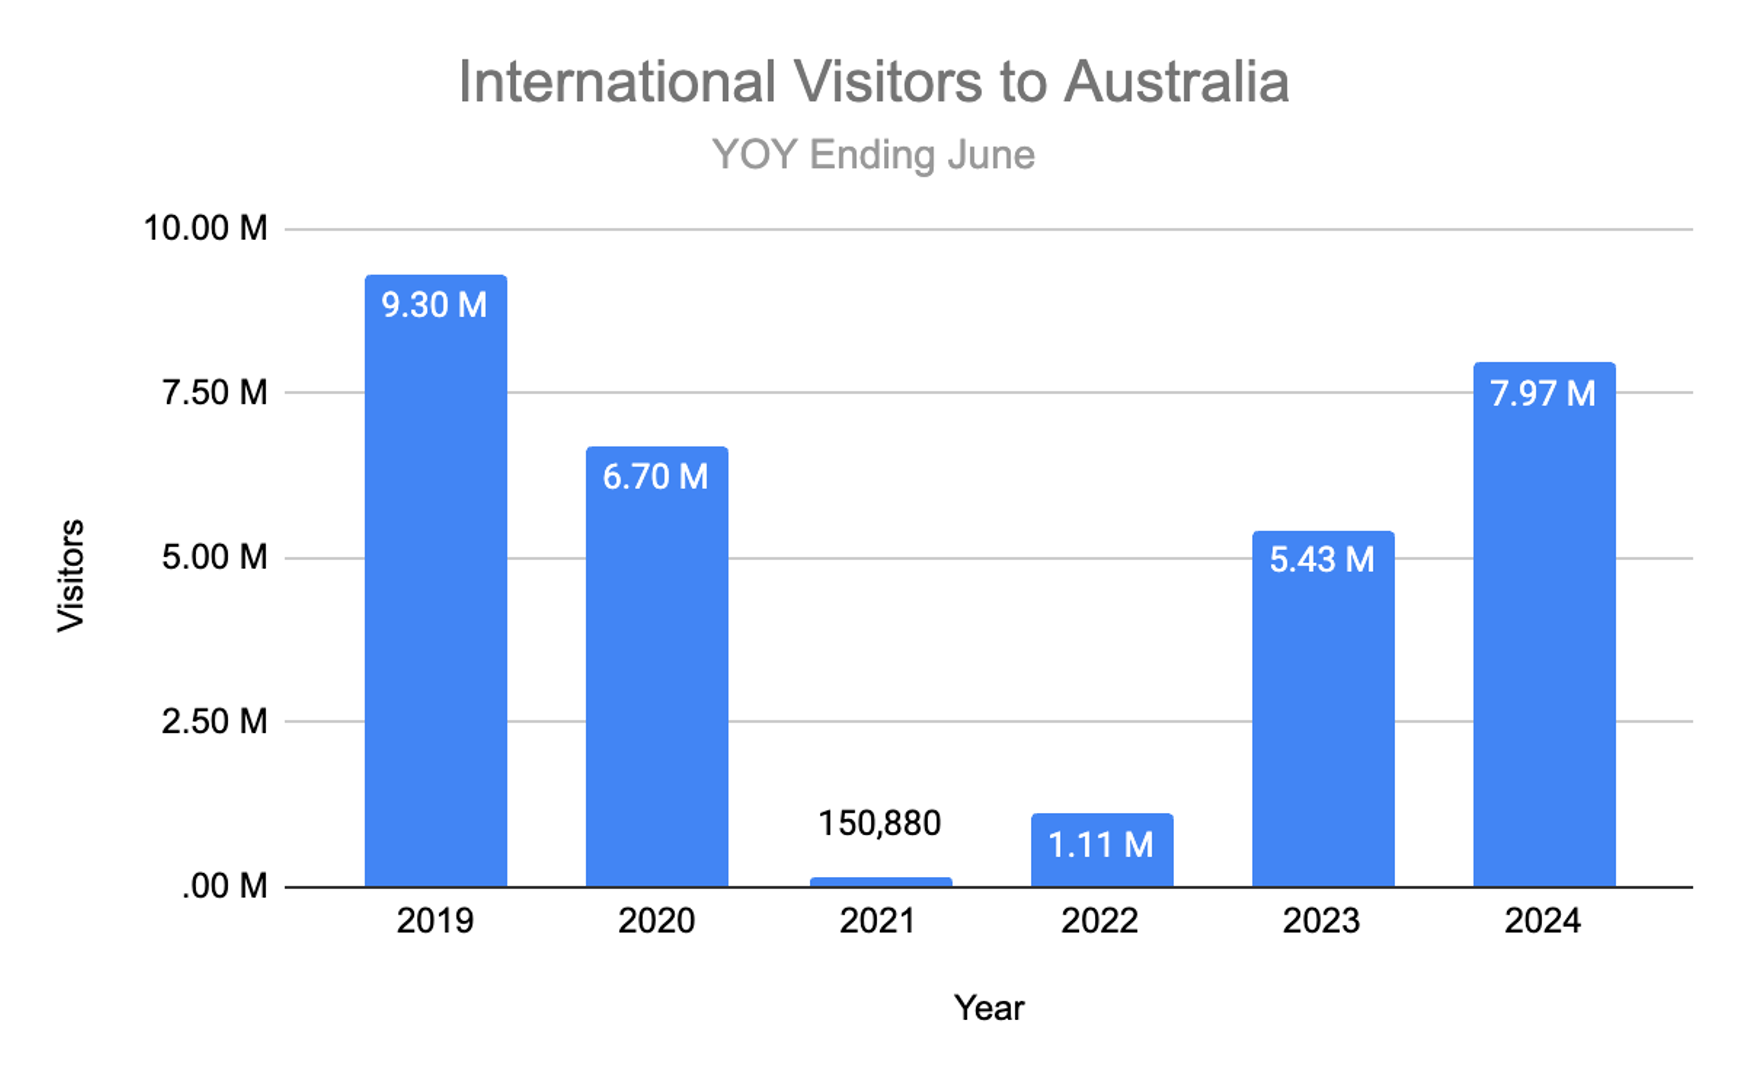
Over 7.97 million visitors travelled to Australia in 2024 (year ending June 2024).7
- Compared to the previous year, international visitation increased by 47%, up from 5.43 million.
- However, the total number of international visitors was still 14% below the 2019 peak of 9.3 million.
- Data for the 2021 period has not been seasonally adjusted.
Who visited Australia in 2024?
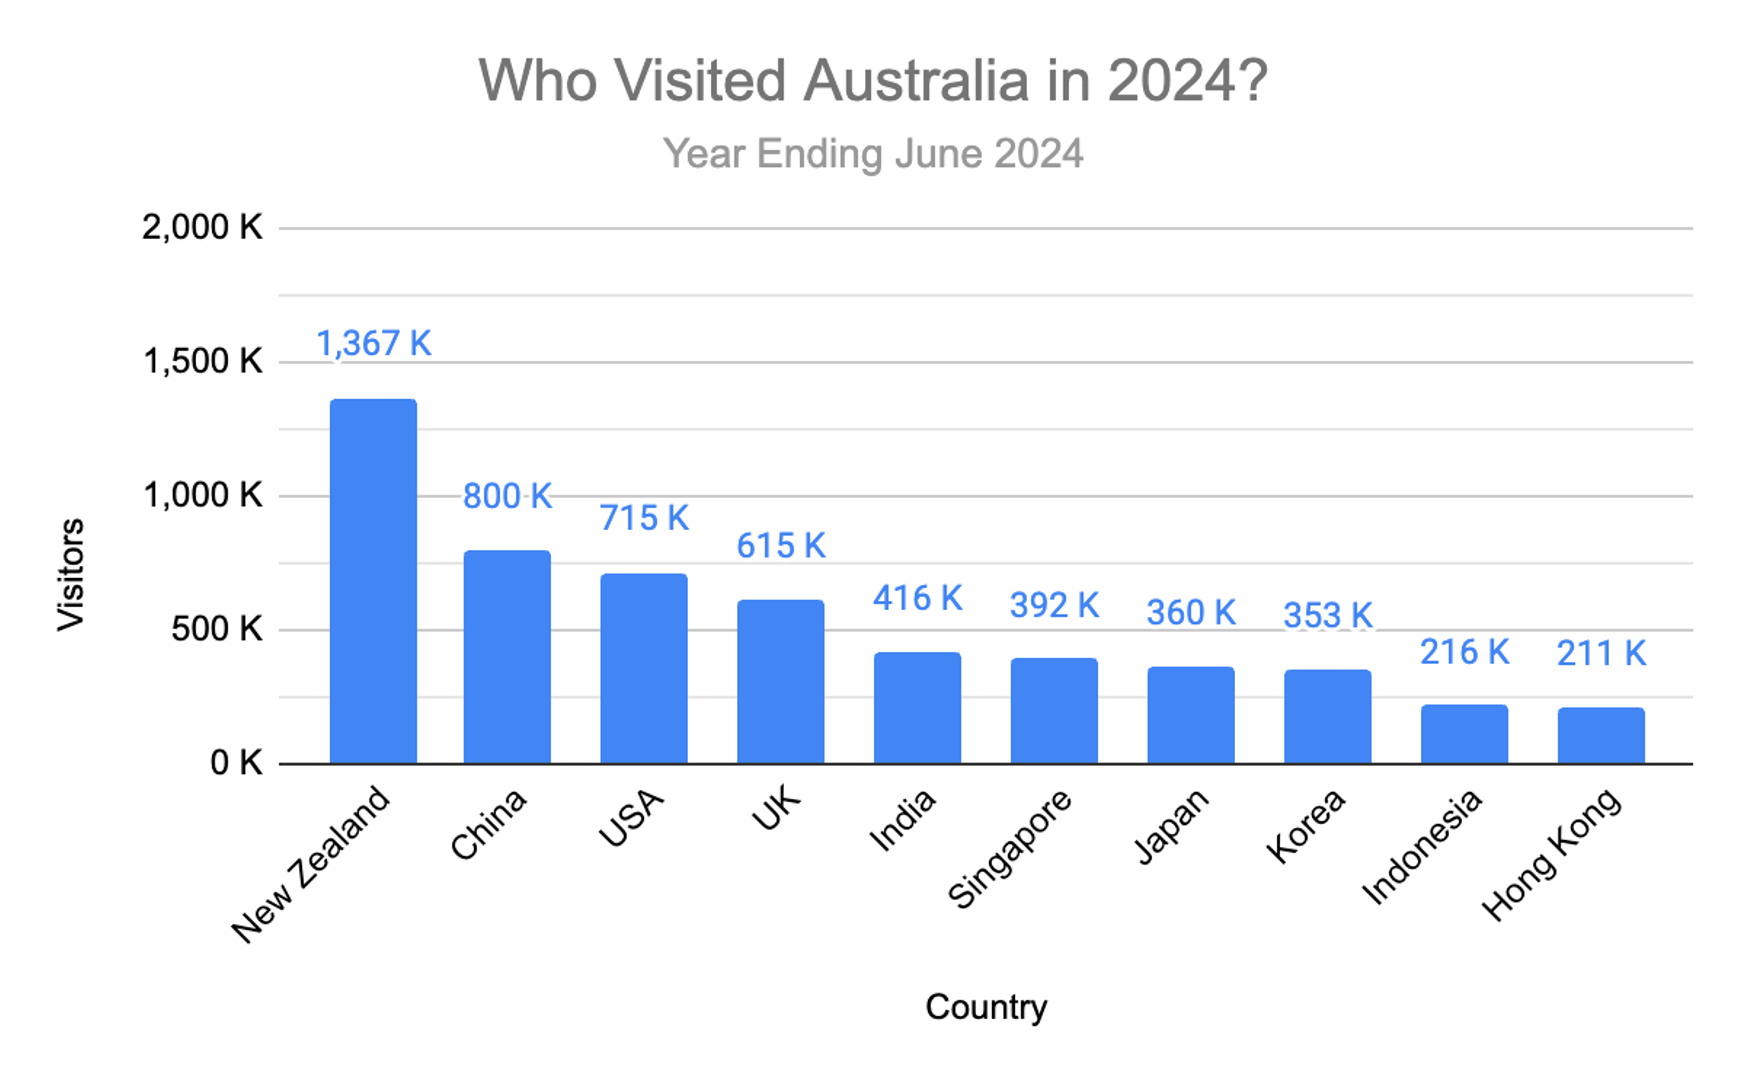
In the year ending June 2024, the largest group of international visitors came from New Zealand, totalling around 1.37 million, and China with 800,000 visitors.8
- Other leading countries included the United States (714,000), the United Kingdom (615,000), and India (416,000).
- The number of visitors from China was still 44% below 2019 levels of 1.43 million.
- New Zealand visitors approached 99% of pre-pandemic figures (1.41 million).
How much did tourists spend in Australia in 2024?
International visitors spent approximately $46.8 billion in Australia during the year ending March 2024 from 7.97 million total trips.9
- This marked a 63% increase from the previous year’s international spending of $28.8 billion.
- International spending in the year ending March 2024 surpassed the pre-pandemic peak of $44.3 billion by 6%.
Who spent the most in Australia in 2024?
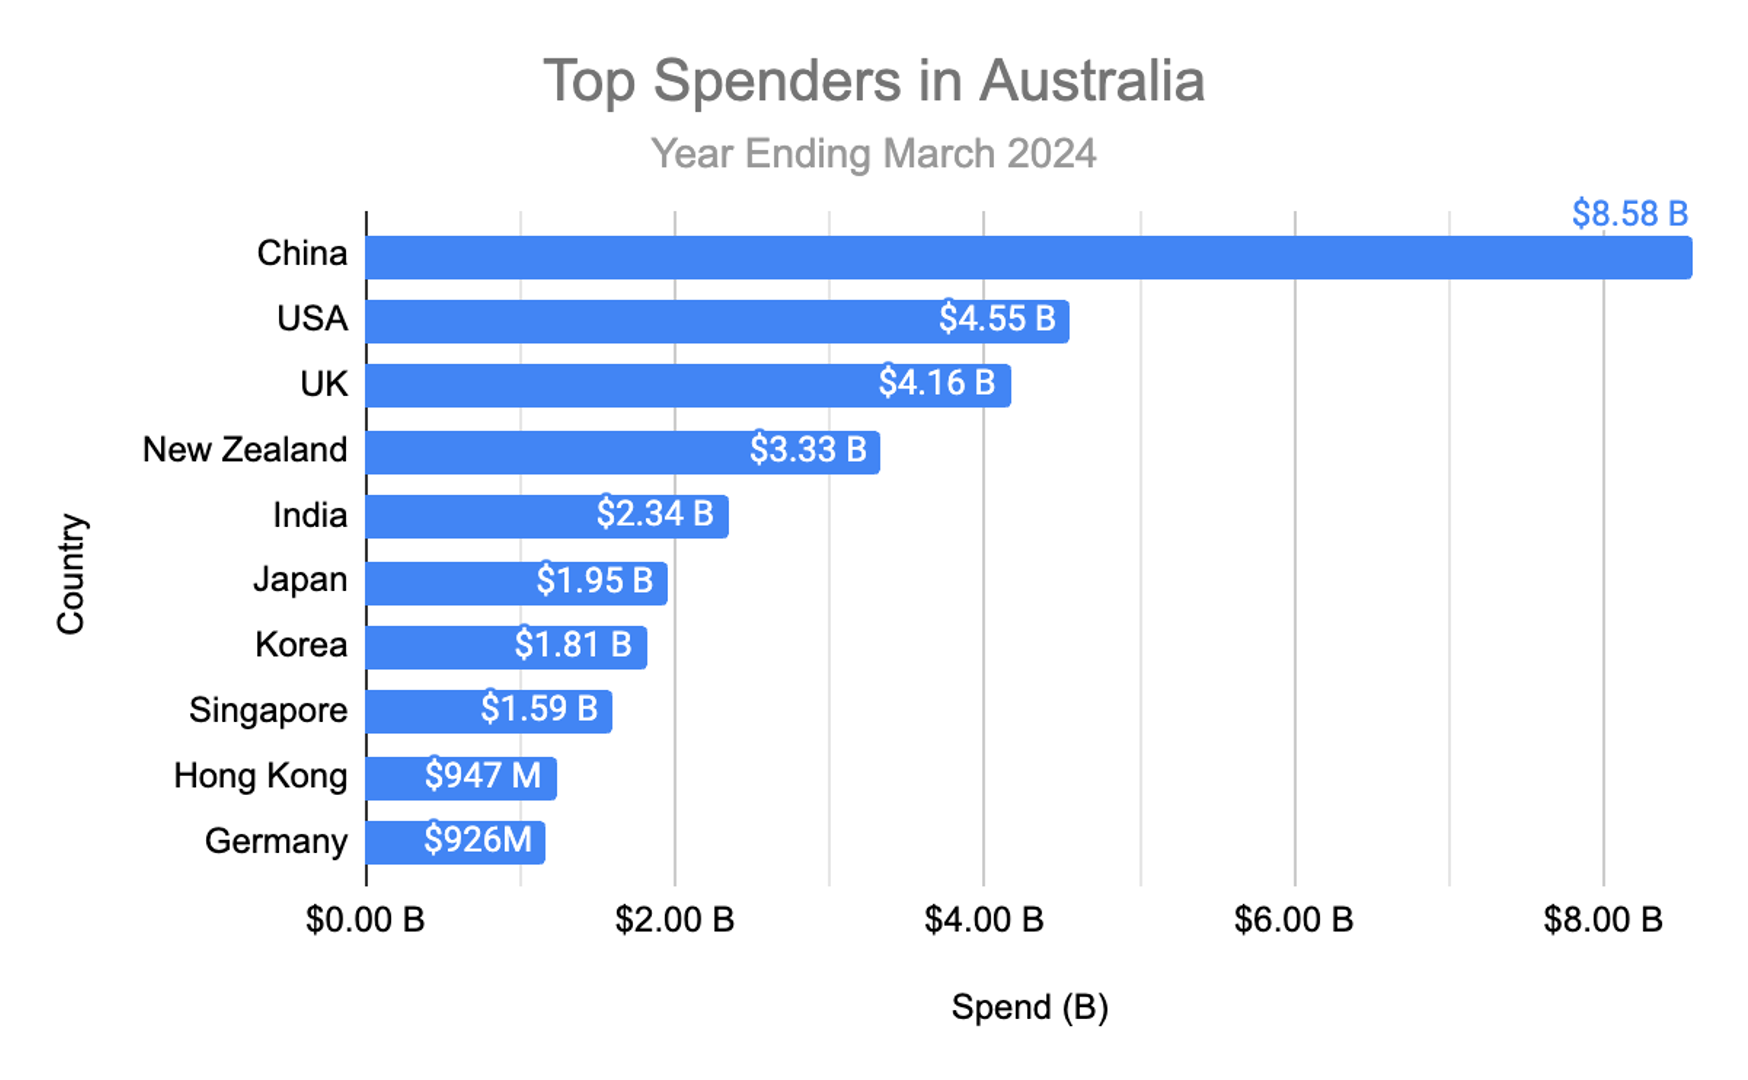
Chinese visitors were the highest spenders in 2024 (year ending March 2024), contributing about $8.58 billion.
- Following China, the top spenders were visitors from the United States ($4.55 billion), the United Kingdom ($4.16 billion), New Zealand ($3.33 billion), and India ($2.34 billion).
- Spending from the Chinese market marked an increase of 163% from the previous year ($3.26 billion).
- However, Chinese spending was still 28% lower than 2019’s level ($11.97 billion).
How many tourists visited Australia in 2023?
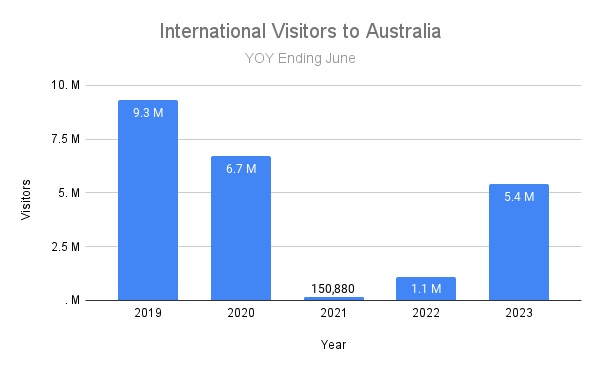
Over 5.4 million visitors travelled to Australia in 2023 (year ending June 2023). Visitors increased by 391% compared to the over 1.1 million visitors in 2022 (year ending June).
- 2019 still holds the record for the highest number of visitors, with over 9.5 million travelling to Australia during that period (year ending June 2019)
- Despite seeing steady growth, visitor numbers are still 42% lower than those during the all-time peak
- Data for the 2021 period has not been seasonally adjusted.
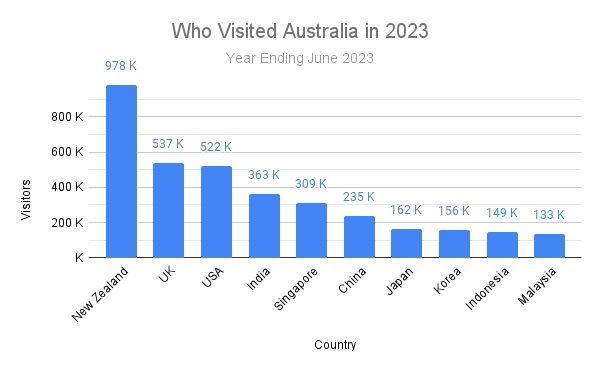
Who visited Australia in 2023?
The highest number of visitors in 2023 came from New Zealand at 978,000.
- The top five visitor markets in 2023 were New Zealand, the UK, the USA, India, and Singapore.
- China, previously one of the top visitor markets for Australia, has seen a decline in visitors during the post-pandemic period with only 235,000 visits over the 12 months ending in June 2023.
How much did international visitors spend in 2023?
International visitors spent over $34 billion during trips to Australia in 2023 (year ending June 2023).
- Spending was up 391% when compared to the over $7 billion spent during 2022.
- Spending is down 22.8% when compared with the over $44.6 billion spent during pre-pandemic 2019.
- Complete data is not available for 2021 due to low reporting numbers.

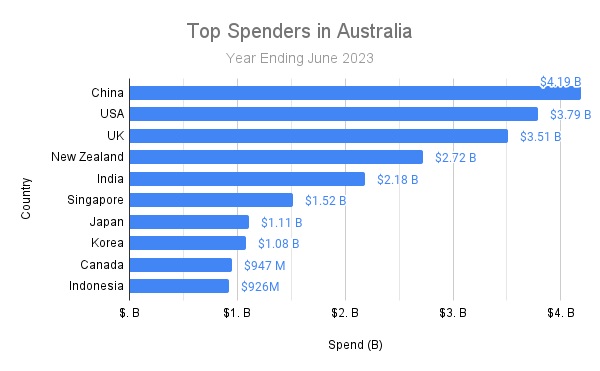
Who spent the most in Australia in 2023?
- Chinese were the top spenders at over $4.1 billion (year ending June 2023).
- The top five spenders were China, the USA, the UK, New Zealand, and India.
How many tourists visited Australia in 2022?
Over 2 million tourists visited Australia in 2022 (year ending September 2022).6
- International visitors increased by over 1200% when compared with the previous year. This was primarily due to the gradual reopening of Australia’s borders, beginning in November 2021.
- In March 2020, Australia closed its international borders to all non-residents.
- From August 2020 – September 2021, visitors to Australia were at an all-time low, with only 155,579 international travellers visiting during that time.
- Australia began to reopen its borders in November 2021, with a complete lifting of travel restrictions taking place in July 2022.
- Numbers are still significantly low when compared with the pre-covid period. For the year ending September 2019, Australia received a total of over 8.6 million international visitors.
Who visited Australia in 2022?
The most visitors to Australia for the year ending September 2022 came from New Zealand, at over 382,000.
- The top five international markets for Australia in 2022 were: New Zealand, India, the United Kingdom, Singapore, and the USA.
- China, previously one of the top sources of international visitors to Australia, fell out of the top five in 2022, with only just over 62 thousand making the trip.
- While seeing a significant increase when compared with 2021, numbers are still much lower when compared with the pre-covid period.
How much did international tourists spend in Australia in 2022?
International tourists spent over $12.7 billion during trips to Australia for the year ending September 2022.
- Spending was up over 800% when compared with the $1.3 billion spent during the previous year (year ending September 2021).
- Visitors from China were the top spenders, spending over $1.5 billion during trips to Australia in 2022
- Spending was down 71% when compared with the over $45 billion spent during the pre covid period (year ending September 2019)
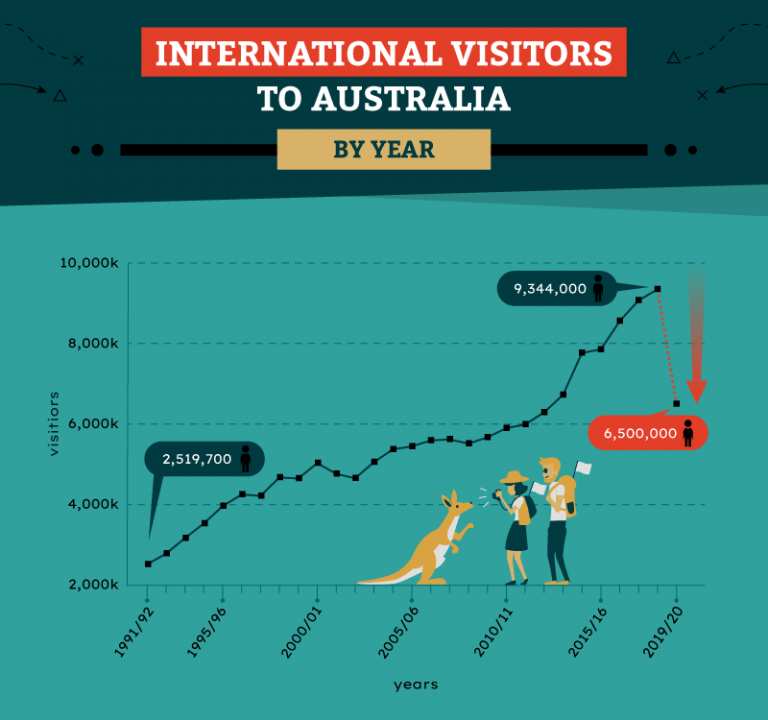
How many tourists visited Australia in 2019?
Over 9.3 million tourists visited Australia between July 2018 and June 2019, the highest number ever recorded.1
How many tourists visited Australia in 2021?
Complete data during the COVID period is not available. For the most accurate available 12-month reporting period – over 60,200 people visited Australia between April 2020 and March 2021.
- Visitors were down 99.3% when compared to the over 8 million visitors of the previous year.
How much did visitors spend in Australia in 2021?
Visitors to Australia spent more than $794 million between April 2020 and March 2021.
- Spending was down 98.1% when compared to the over $41 billion spent during the previous year.
- Visitors from the US spent the most, spending just over $115 million during visits to Australia in 2021.
Who visited Australia in 2021?
Complete data during the COVID period is not available. For the most accurate available 12-month reporting period – April 2020 and March 2021 – the highest number of visitors came from New Zealand with over 13,000 making trips during this period.
- The top 5 countries from which visitors came to Australia in this period were New Zealand, USA, UK, India and China.
How many people travelled domestically in Australia in 2021?
In the first quarter of 2021 (January-March), Australians made over 24.6 million domestic overnight trips.
- Domestic travel was up 1.1% when compared with the over 24.3 million domestic overnight trips for the first quarter of 2020.
How much did Australians spend travelling in 2021?
Domestic travellers spent over $17.89 billion during trips throughout Australia in the first quarter of 2021 (January-March).
- Spending was up 0.4% when compared with the $17.81 billion spent during the first quarter of 2020.
Australian Tourism Statistics 2020
How many tourists visited Australia in 2020?
Over 9.3 million tourists visited Australia in 2019 (year ending June 2019).
In 2020 the number of international visitors to Australia dropped to 6.7 million due to COVID-19 travel restrictions (year ending June 2020).1
A further decrease in annual tourism was seen in 2021 (complete data for 2021 is not available due to low reporting numbers).
- In 2020 the number of international visitors to Australia went down by 27% compared to the previous year. This marked a year-on-year decrease of over 2.6 million visits.
- 2019 holds the record for the highest number of travellers visiting Australia in any year up to date.
- The dramatic drop in annual visits in 2020 was caused primarily by the coronavirus pandemic and related travel restrictions introduced in March 2020.
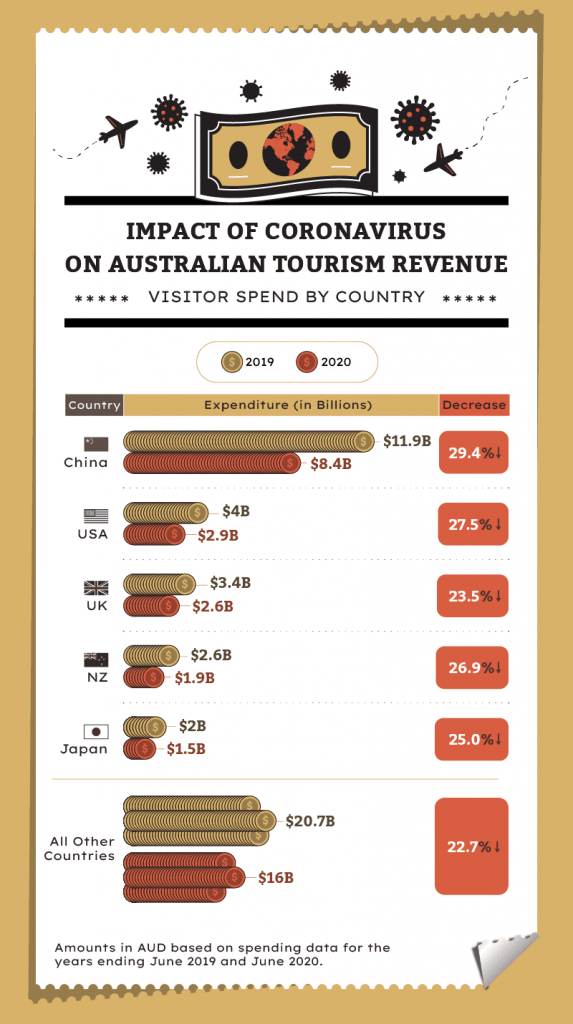
- Australian international tourism spend amounted to $44.6 billion in 2019 and saw a decrease of 25.2% in 2020 to $33.3 billion, significantly impacting the Australian tourism industry.
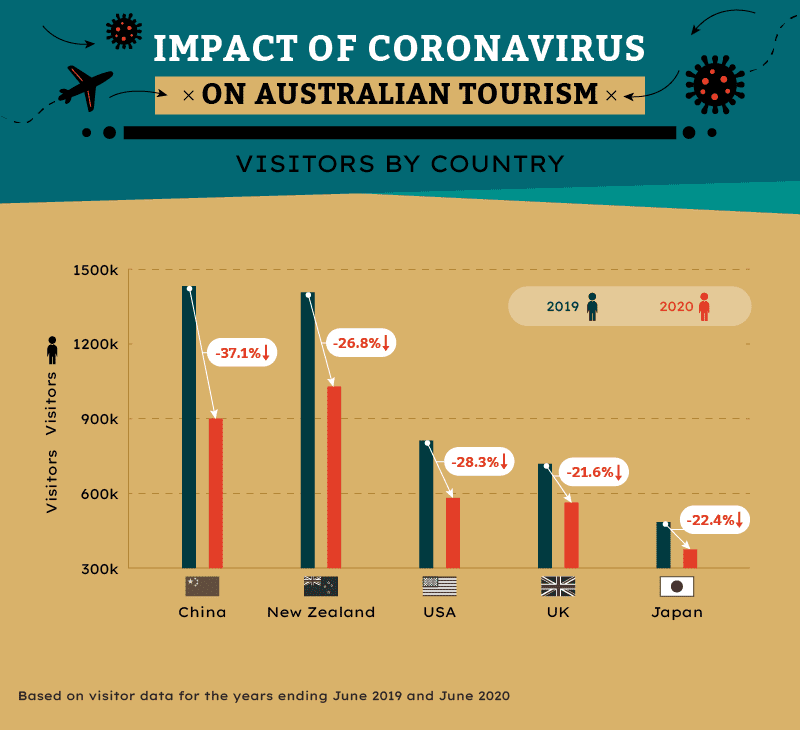
Who visited Australia in 2020?
- The most visitors to Australia in 2019/2020 came from New Zealand, at just over 1 million.
- For the previous two years, China had been the main source of visitors to Australia.
- The travel ban placed on Chinese visitors in early 2020 as well as the following coronavirus restrictions resulted in a larger relative drop in Chinese visitors than New Zealand visitors in the 2019/2020 year.
- The top 5 markets in 2020 were New Zealand, China, the USA, the UK and Japan.
- All five of the top markets saw a large decrease in visitors due to the coronavirus restrictions.
Impact of the Coronavirus on International Tourism Expenditure
International visitors spent a total of $33.3 billion during trips to Australia for the year ending June 2020.
- Spending was down 25% when compared to the $44.6 billion of the previous year.
January 2020 – Bushfire Impact
- In January 2020 approximately 739,600 international visitors travelled to Australia.4
- International visitor numbers were down 5.1% when compared with the 779,500 of January 2019.
- The drop can be partly attributed to the Australia bushfires crisis of 2019/2020, impacting Australian tourism businesses and hospitality sector even before the COVID-19 crisis.
February 2020 and the Impact of Coronavirus
- February saw a significant decrease in international tourism due to the effects of the coronavirus crisis.
- In February 2020 approximately 647,000 international visitors travelled to Australia.
- International visitors were down 18% when compared with the 796,100 visitors of February 2019.
March 2020 and the Impact of Travel Restrictions
International arrivals in March saw a dramatic decrease, significantly impacting Australia’s tourism industry:
- In March 2020 approximately 307,900 international visitors travelled to Australia which was a 59.9% drop when compared with the 768,200 visitors of March 2019.
- On March 20th, Australia restricted entry to only citizens, residents and their immediate family.
- On March 25th Australian citizens and residents were also banned from travelling overseas.
Impact of the Travel Ban on Chinese Tourists
- In February 2020 visitors arriving from China decreased by 83% compared to the previous year (19,500 arrivals in February 2020 vs 116,900 visitors in February 2019).
- The significant drop was the result of the coronavirus-related travel ban implemented by the Australian government on 1 February for non-citizens travelling from or through China.
- February in the past has historically been the peak period for Chinese visitors to Australia.
Read more: Chinese visitors to Australia statistics
Impact of coronavirus on international visitors to Australia in the second half of 2020
For the 2nd half of the year (July – December) Australia received a total of 32,740 international visitors.
- During that same period the previous year (July – December, 2019) Australia received over 4.9 million international visitors.
- For the second half of 2020, international visitors were down 99.3% when compared with 2019.
How did the coronavirus affect domestic travel?
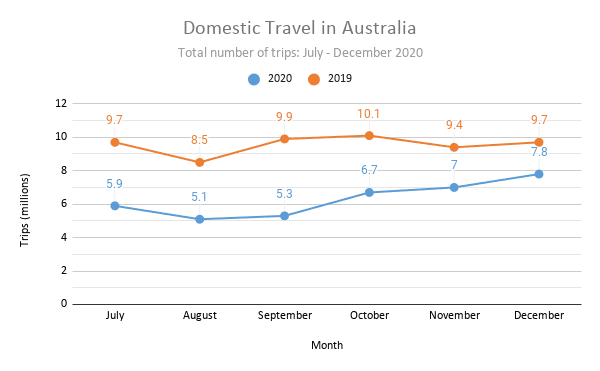
In the second half of 2020 (July to December) Australians made over 38 million domestic trips.
- For the same period the previous year (July – December 2019) Australians made over 57 million domestic trips.
- Domestic trips saw a decrease of 33.8% during this time period.
- Despite lower travel volumes during the first part of 2020, domestic trips began to see an increase during the final quarter of the year.
Australia Inbound Travel Statistics for 2019 – International & Domestic Tourism
Who visited Australia in 2019?
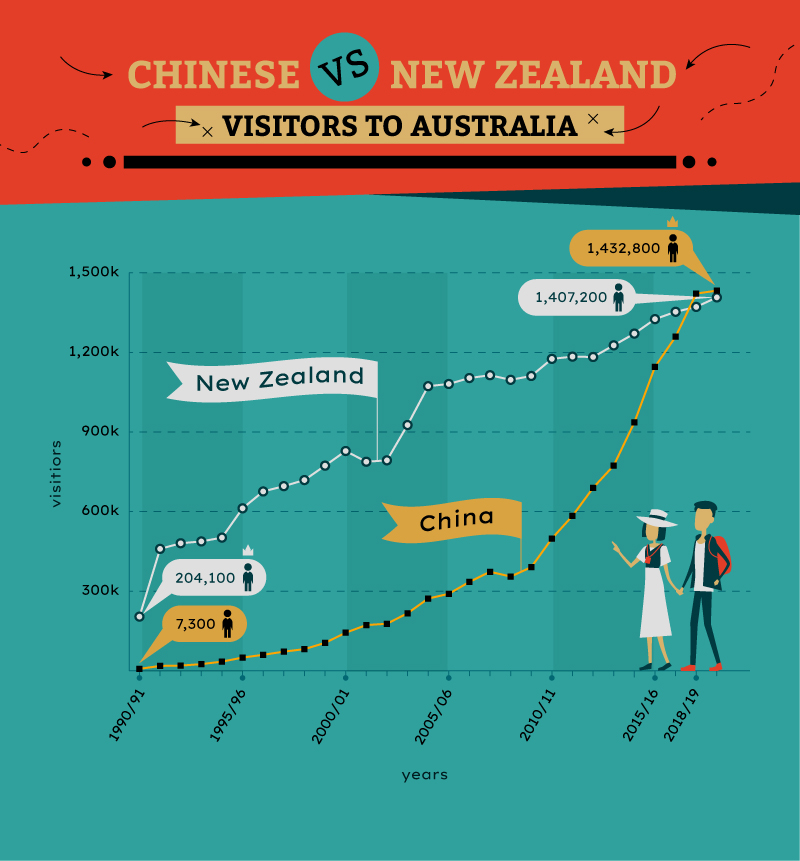
- The highest number of visitors came from China, at over 1.4 million.
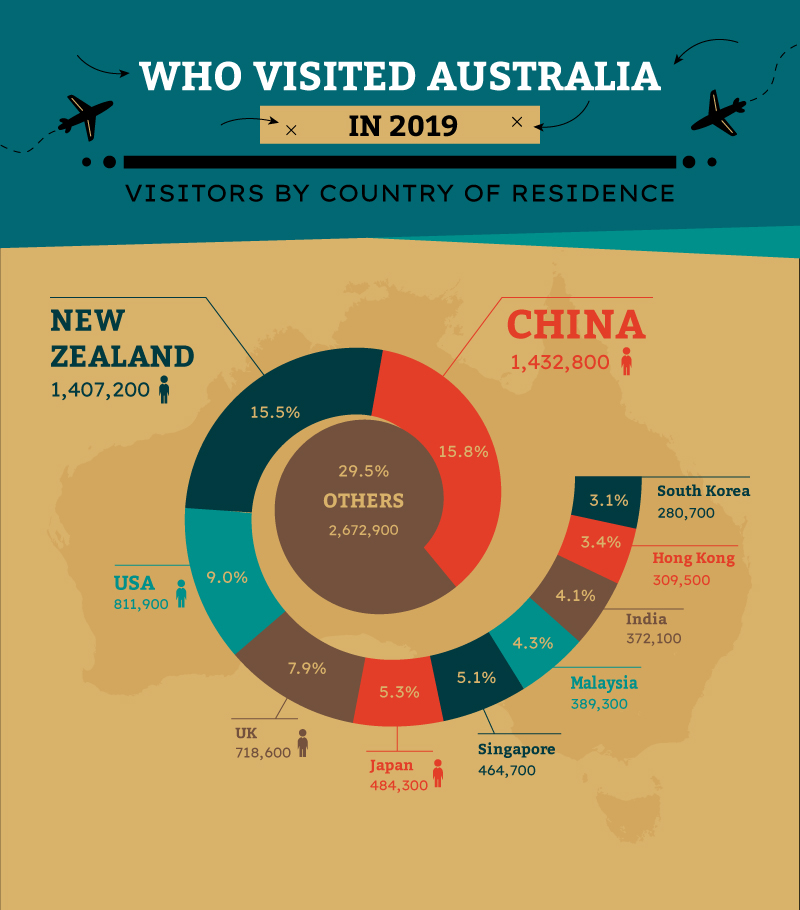
- Up until 2016, New Zealand was the top source of tourist arrivals for Australia, but that spot was then held by China for 2 years.
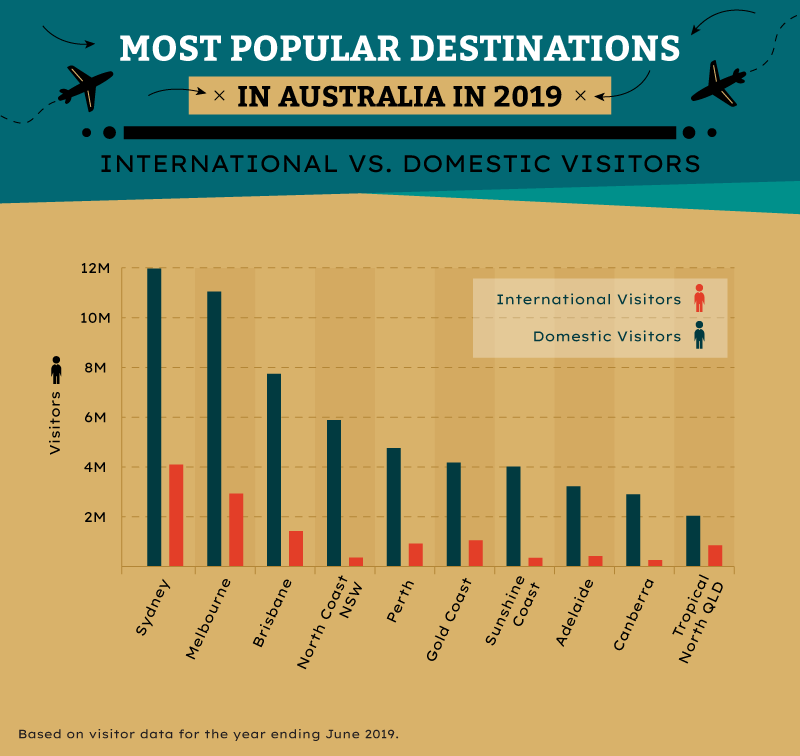
What were the most popular tourist destinations in Australia in 2019?
- The most popular destination for both international tourism and domestic visitors was Sydney, with over 16 million visitors.2
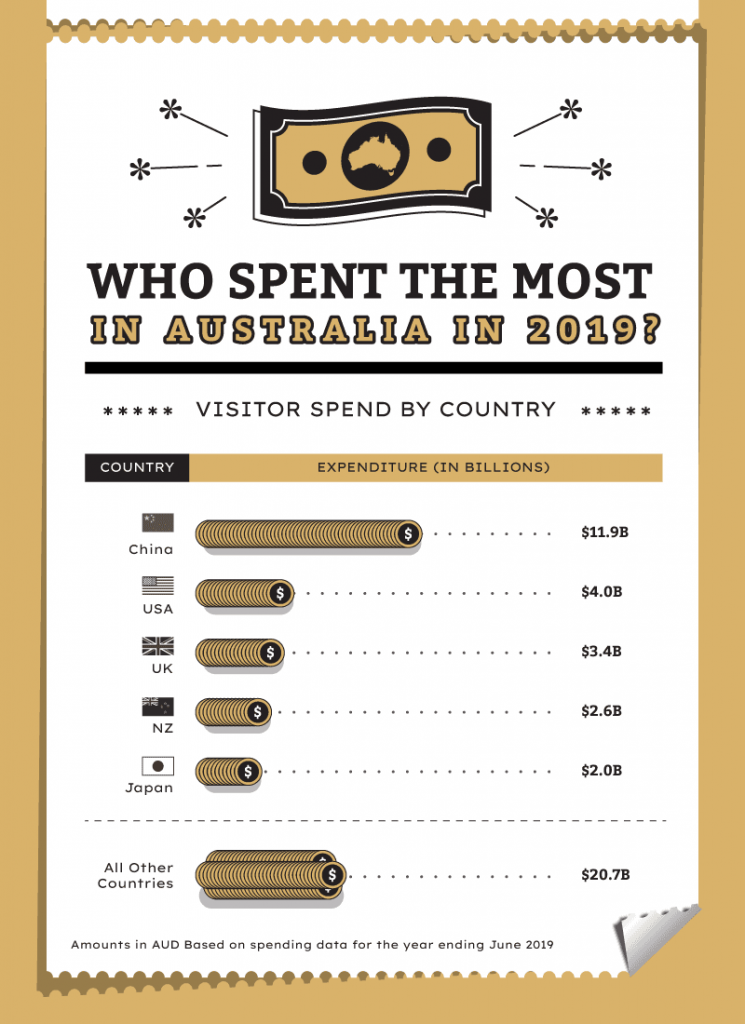
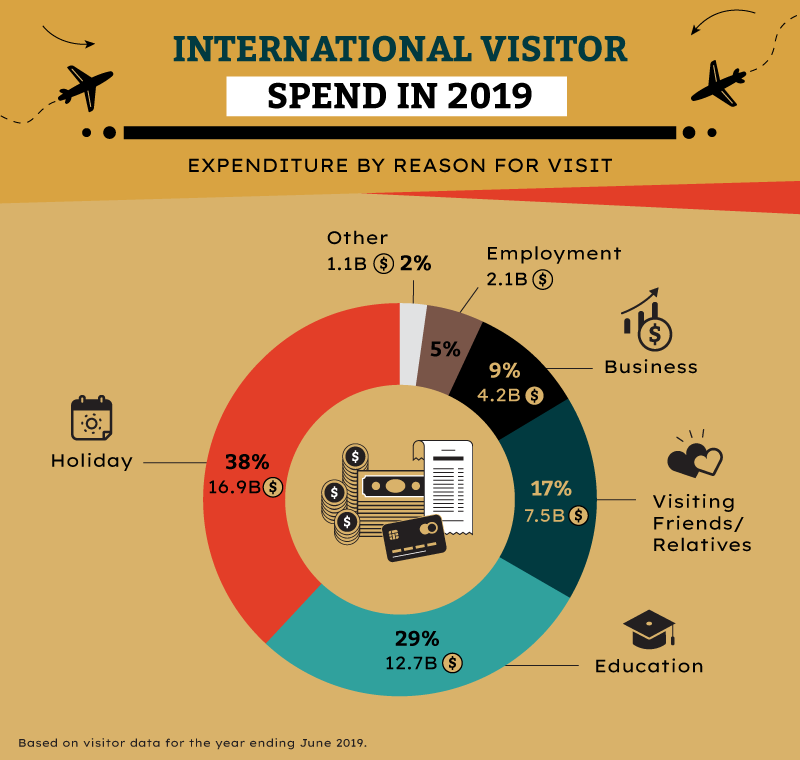
How much did international tourists spend in Australia in 2019?
- International tourists spent a total of $44.6 billion in Australia between July 2018 and June 2019.3
- Chinese were the top spenders at $11.9 billion, nearly triple the amount of the next-highest spenders (Americans at $4 billion).
- International visitors spent an average of $5,183 per trip, an average expenditure of $163 per night.
- Holidaymakers contributed the most overall with $16.9 billion spent.
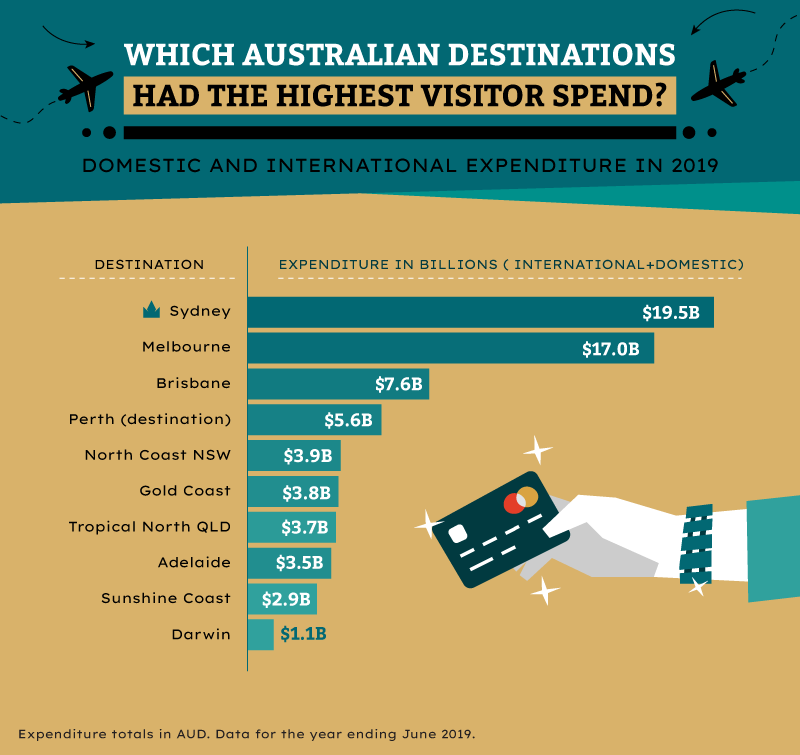
Which Australian destinations had the highest visitor spend?
- Sydney had the highest visitor spend receiving a combined $19.5 billion from both international and domestic visitors between July 2018 and June 2019.
- Melbourne also ranked high at a combined $17.0 billion.
How long do international tourists spend in Australia?
- Tourists spent 273 million visitor nights in Australia between July 2018 and June 2019.
- The overall average length of stay was 32 nights.
Australian camping & campervan statistics
- The number of camping trips throughout Australia has grown by 27.5% over the 10-year period from 2008 to 2018.5
- In 2018 over 6.9 million overnight camping trips were made in Australia.
- Camping trips – including caravan, campervan, commercial and non-commercial camping – made up 13.7% of visitor nights for domestic travellers in Australia in 2019 (year ending September)
Other Resources
Australian Outbound Tourism Statistics for 2019
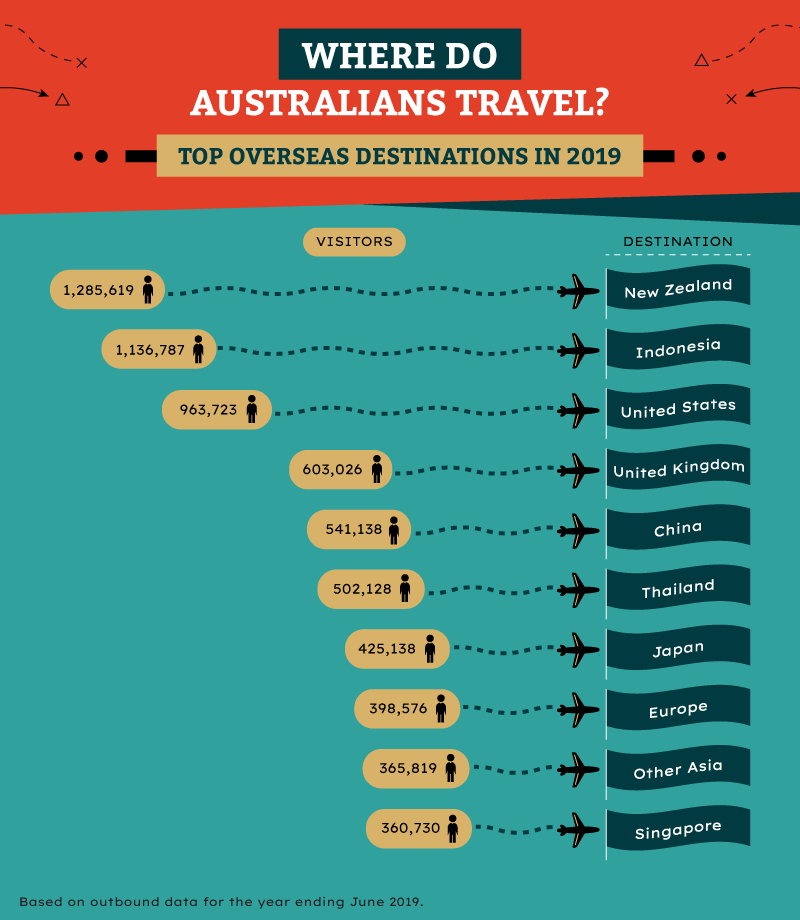
Where did Australian tourists visit in 2019?
- Australian tourists and travellers made over 9.5 million overseas trips in the year ending in June 2019.4
- The most popular destination was New Zealand, with over 1.2 million trips alone.
- Indonesia (Bali), the US (Los Angeles, Las Vegas, San Francisco) and the UK (London, Scotland), were also popular destinations.
Travel Statistics Resources
International Tourism – Visitor Statistics
- Visitors from China
- Visitors from Hong Kong
- Visitors from India
- Visitors from Japan
- Visitors from Malaysia
- Visitors from New Zealand
- Visitors from Singapore
- Visitors from South Korea
- Visitors from the UK
- Visitors from the USA
Statistics by Location
- Adelaide Statistics
- Brisbane Statistics
- Cairns Statistics
- Darwin Statistics
- Gold Coast Statistics
- Melbourne Statistics
- New South Wales Statistics
- Northern Territory Statistics
- Perth Statistics
- Queensland Statistics (incl. Great Barrier Reef)
- South Australia Statistics
- Sydney Statistics
- Tasmania Statistics
- Victoria Statistics (incl. Great Ocean Road and Twelve Apostles)
- Western Australia Statistics
Global Statistics
References
- ABS: Overseas Arrivals and Departures, Australia, June 2020 ↩
- TRA: International Visitor Survey, National Visitor Survey, 2020 ↩
- TRA: International Visitor Survey, Trends 2019, National Visitor Survey, Trends 2020 ↩
- ABS: Arrivals and departures: Visitor arrivals, short-term trips (seasonally adjusted) March 2020↩
- TTF: Estimated impact of Coronavirus on the Australian visitor economy↩
- TRA: International Visitor Survey, September 2022↩
- ABS: Overseas arrivals and departures, Australia 2023 & 2024 ↩
- ABS: Overseas Arrivals and Departures, Australia, June 2024 ↩
- TRA: International tourism results, Australia, March 2024 ↩