

Updated
At a Glance
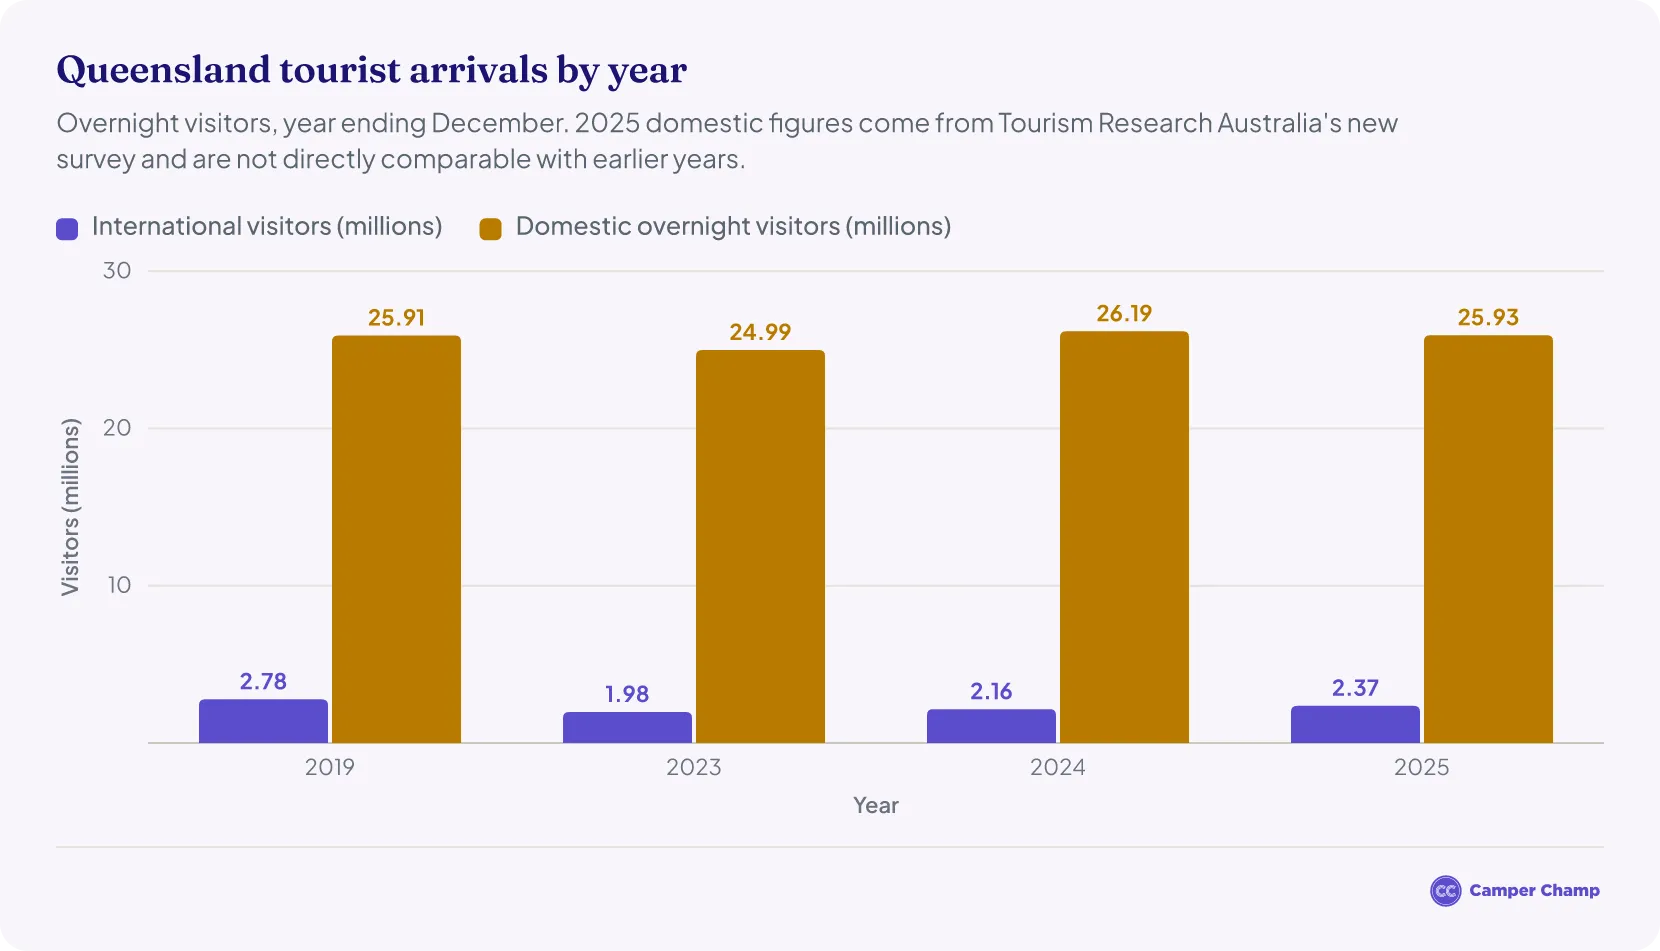
- 28.3 million overnight visitors travelled to Queensland in 2025: 25.9 million domestic1 and 2.37 million international.2
- Australians also made 55.4 million day trips in Queensland in 2025, up 13.8% on 20241.
- Overnight visitors spent about A$35.2 billion in 2025: A$27.7 billion by domestic visitors1 and A$7.48 billion by international visitors2.
- Brisbane was the most visited region, with about 10.97 million overnight visitors1.
- New Zealand was the largest international market, with a record 508,000 visitors2.
- Domestic overnight visitors stayed 3.5 nights on average1.
- K'gari (Fraser Island) was the most popular place to camp, with about 94,800 campers on park permits in the year to September 20263.
- A national park camping permit costs $7.75 per person per night from 1 July 20264.
How many tourists visit Queensland each year?
About 28.3 million overnight visitors travelled to Queensland in 2025 (year ending December).
- This total included about 25.9 million domestic overnight visitors, essentially unchanged (up 0.1%) on 202415. These figures come from Tourism Research Australia's new Domestic Tourism Statistics survey, which replaced the National Visitor Survey in January 2025, so 2025 domestic numbers are not directly comparable with the earlier years on this page.
- Queensland also had about 2.37 million international visitors in 20256, about 10% more than the 2.16 million recorded in 2024.
- International visitor numbers were still about 15% below Queensland’s 2019 level (2.78 million)7.
How much did tourists spend in Queensland in 2025?
- Domestic overnight visitors spent about A$27.68 billion in 20255 (down 1.3% on 2024, comparing like with like under the new survey1), while international visitors spent around A$7.48 billion6 (up about 20% from A$6.22 billion in 2024).
- Combined, overnight visitors spent about A$35.2 billion in Queensland in 2025. In 2019, before the pandemic, overnight visitors spent about A$25.52 billion: A$19.44 billion by domestic visitors8 and A$6.08 billion by international visitors7. Domestic figures before 2025 come from the older National Visitor Survey, so the two years are not directly comparable.
| Overnight visitor spending in Queensland | ||
|---|---|---|
| Year | International | Domestic |
| 2019 | A$6.08 B7 | A$19.44 B8 |
| 2023 | A$5.86 B | A$28.27 B |
| 2024 | A$6.22 B | A$29.05 B |
| 2025 | A$7.48 B | A$27.68 B1 |
Source · Data source: Tourism Research Australia (International Visitor Survey, National Visitor Survey and Domestic Tourism Statistics).
How many day trips are made in Queensland?
Australians made about 55.4 million domestic day trips in Queensland in 2025, up 13.8% on 20241. Counting day trips and overnight stays together, Queensland had about 81.3 million domestic visits.
- Day trippers spent about A$9.2 billion (up 27.6%), taking total domestic visitor spending in Queensland to A$36.9 billion1.
How long do tourists stay in Queensland?
- Domestic overnight visitors spent 92 million nights in Queensland in 2025, an average of 3.5 nights per trip. Interstate visitors stayed 4.9 nights on average, and Queenslanders travelling within the state 3.1 nights1.
- International visitors stayed an average of 23.5 nights, or 55.6 million nights in total6. International students, who stay about 113 nights on average, pull this figure up2.
Why do people visit Queensland?
- Of the 25.9 million domestic overnight visitors in 2025, 11.3 million came on holiday, 9.6 million to visit friends and relatives and 3.2 million for business1.
- Domestic holiday visitors spent an average of A$1,349 per trip, above the national average of A$1,1321.
- Among international visitors, 1.4 million of the 2.37 million came on holiday2.
Where do Queensland's international visitors come from?
New Zealand is Queensland's largest international market, with a record 508,000 visitors in 2025 (up 4.5%)2.
- The next largest markets were the United Kingdom (249,000 visitors), the United States (228,000), China (208,000) and Japan (163,000)2.
- China was the biggest market by spending, at about A$1.28 billion (up 40%), ahead of New Zealand (A$990.4 million) and the United Kingdom (A$658.2 million, a record)2.
| Queensland visitor numbers by year | |||||
|---|---|---|---|---|---|
| Year | Period | Total visitors | International visitors | Domestic overnight visitors | Visitor spending |
| 2025 | Year ending December 2025 | 28.3 million | 2.37 million2 | 25.9 million1 | A$35.2 billion |
| 2023 | Year ending June 2023 | 26.8 million | 1.5 million | 25.2 million | A$33 billion |
| 2022 | Year ending September 2022 | 24.9 million | 519,746 | 24.4 million | A$25.7 billion |
| 2021 | Year ending September 2021 | 20.4 million9 | 57,492 | 20.3 million9 | A$16.7 billion9 |
| 2020 | Year ending June 2020 | 22.4 million10 | 1.9 million | 20.4 million | A$19.8 billion10 |
| 2019 | Year ending June 2019 | 28 million | 2.76 million11 | 25.3 million | A$24.7 billion |
Source · Data source: Tourism Research Australia via Tourism and Events Queensland (International Visitor Survey, National Visitor Survey and Domestic Tourism Statistics).
What are the most visited places in Queensland?
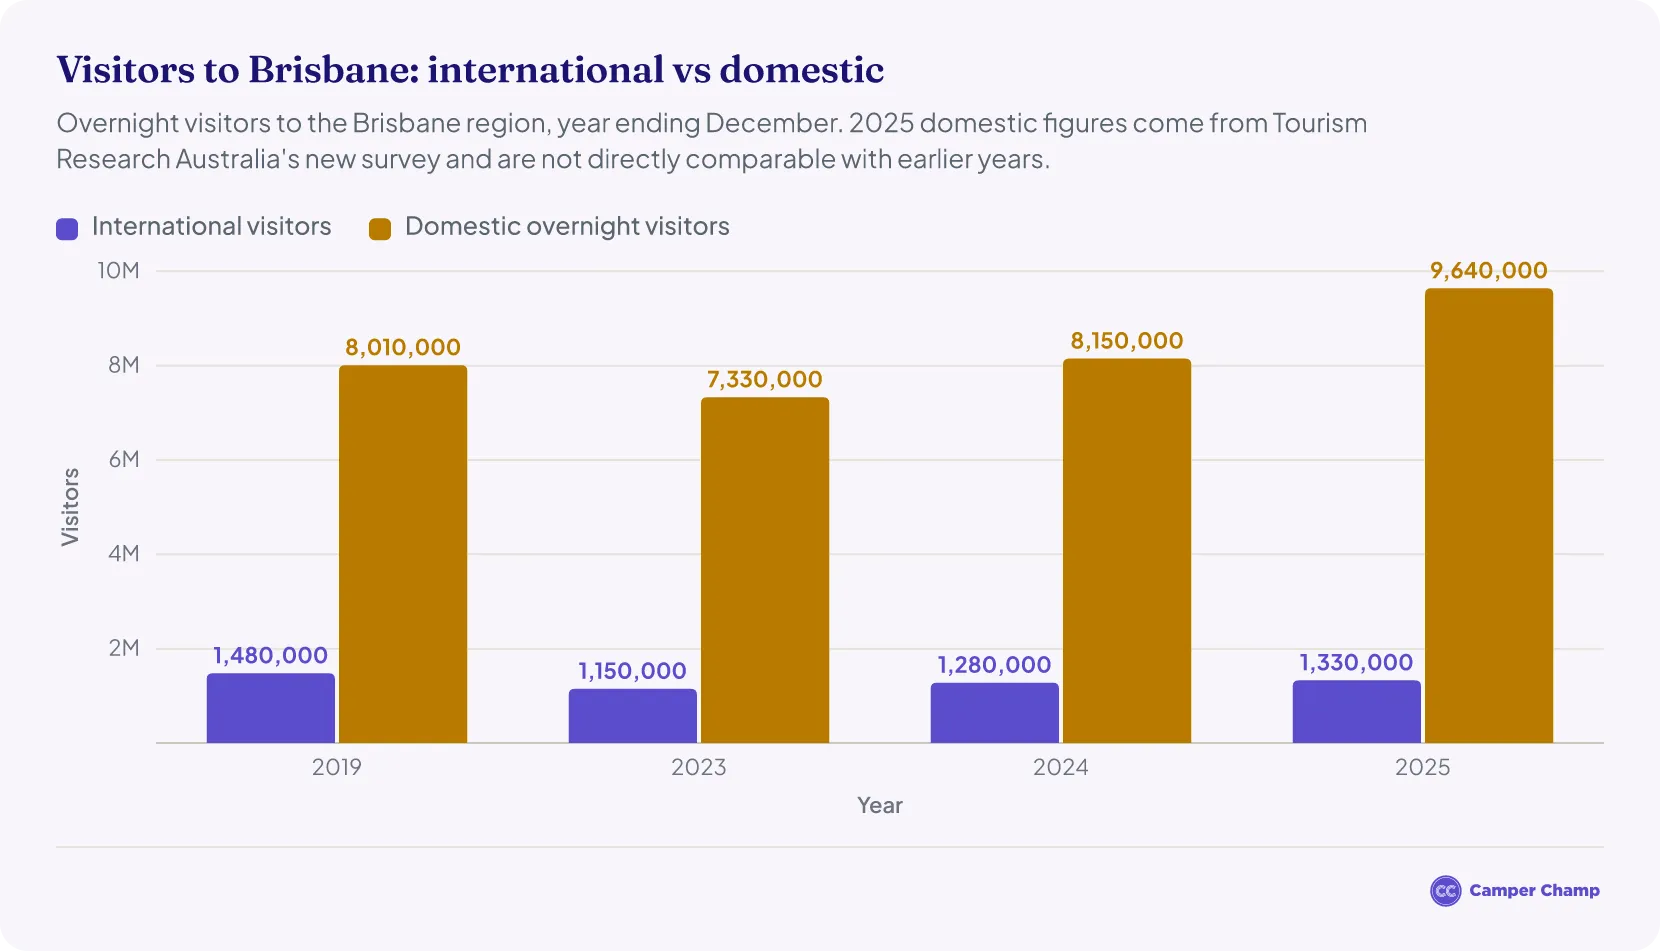
Brisbane is the most visited place in Queensland. About 9.64 million domestic overnight visitors1 and 1.33 million international visitors stayed in the Brisbane region in 20252. The Gold Coast came second, with 5.08 million domestic overnight visitors, followed by the Sunshine Coast with 4.27 million1.
| Most visited places in Queensland | ||||
|---|---|---|---|---|
| Rank | Region | Domestic overnight visitors | International visitors | Domestic overnight spending |
| 1 | Brisbane | 9.64 million1 | 1.33 million2 | A$8.86 billion |
| 2 | Gold Coast | 5.08 million | 682,000 | A$5.99 billion |
| 3 | Sunshine Coast | 4.27 million | 301,000 | A$3.39 billion |
| 4 | Queensland Country | 2.98 million | 42,000 | A$1.26 billion |
| 5 | Southern Great Barrier Reef | 1.95 million | 70,000 | A$1.47 billion |
| 6 | Tropical North Queensland (Cairns) | 1.76 million | 622,000 | A$2.87 billion |
| 7 | Mackay | 1.03 million | 25,000 | A$849.7 million |
| 8 | Townsville | 1.02 million | 84,000 | A$1.12 billion |
| 9 | Fraser Coast (incl. K'gari) | 845,000 | 74,000 | A$567.7 million |
| 10 | Whitsundays | 697,000 | 176,000 | A$912.6 million |
| 11 | Outback Queensland | 592,000 | 14,000 | A$332.1 million |
Source · Data source: Tourism and Events Queensland (Domestic Tourism Statistics Snapshot and International Tourism Snapshot, year ending December 2025).
How many tourists visit Brisbane each year?
- About 10.97 million overnight visitors travelled to the Brisbane region in 2025 (year ending December): 1.33 million international visitors6 and 9.64 million domestic overnight visitors1.
- Read more: Brisbane Tourism Statistics
How many tourists visit the Gold Coast each year?
- The Gold Coast welcomed about 5.76 million overnight visitors in 2025: 682,000 international visitors6 and 5.08 million domestic overnight visitors1.
- New Zealand is the Gold Coast's largest international market, with 217,000 visitors in 2025, down 2.4% on 20242.
- Read more: Gold Coast Tourism Statistics
| Gold Coast international visitors by market group | ||
|---|---|---|
| Market group | Visitors | Change on 2024 |
| New Zealand | 217,000 | −2.4% |
| Europe (excluding the UK) | 79,000 | −6.1% |
| United Kingdom | 75,000 | +43.3% |
| China | 72,000 | +37.3% |
| North America | 52,000 | +10.6% |
| Japan | 29,000 | +5.2% |
Source · Data source: Tourism and Events Queensland (International Tourism Snapshot, year ending December 2025).
How many tourists visit the Sunshine Coast each year?
- The Sunshine Coast had about 4.58 million overnight visitors in 2025: 301,000 international visitors2 and 4.27 million domestic overnight visitors1.
- Domestic overnight visitors spent about A$3.39 billion on the Sunshine Coast, and 2.3 million of them were on holiday1.
- The Fraser Coast, home to K'gari, had 845,000 domestic overnight visitors1 and 74,000 international visitors in 20252.
- Read more: Sunshine Coast Tourism Statistics, Noosa Tourism Statistics and K'gari (Fraser Island) Tourism Statistics
Great Barrier Reef, Cairns and Whitsundays tourism statistics
How many tourists visit the Great Barrier Reef each year?
- Over 2 million tourists visit the Great Barrier Reef each year12.
- Most Great Barrier Reef tourism is centred on Cairns and the Whitsundays.
How many tourists visit Cairns each year?
- Tropical North Queensland, the region around Cairns, drew about 2.38 million overnight visitors in 2025: 622,000 international visitors6 and 1.76 million domestic overnight visitors1.
- Read more: Cairns Tourism Statistics
How many tourists visit the Whitsundays each year?
- About 873,000 overnight visitors travelled to the Whitsundays in 2025: 176,000 international visitors and 697,000 domestic overnight visitors.13
How much do visitors spend in the Whitsundays?
- Visitors spent about A$1.2 billion in the Whitsundays in 2025: A$970.6 million by domestic visitors (including day trips) and A$233.5 million by international visitors.13
How long do visitors stay in the Whitsundays?
More tourism statistics
- Adelaide Tourism Statistics
- Cairns Tourism Statistics
- Cradle Mountain Tourism Statistics
- Esperance Tourism Statistics
- Great Barrier Reef Tourism Statistics
- Northern Territory Tourism Statistics
- Perth Tourism Statistics
- South Australia Tourism Statistics
- Sunshine Coast Tourism Statistics
- Tasmania Tourism Statistics
- Warner Bros. Movie World Tourism Statistics
- Western Australia Tourism Statistics
How many people camp in Queensland?
Australians took about 3.2 million caravan and camping trips in Queensland in 2024 and spent about 13 million nights there14. That was the third-highest of any state, behind New South Wales (5.1 million trips) and Victoria (3.9 million).
- Caravans and campervans: Queensland had 254,025 registered recreational vehicles in January 2025, 27% of Australia's fleet and the most of any state15.
- Across Australia: Australians took 17.3 million overnight caravan and camping trips in 202515. Queensland's own 2025 figures are only in a members-only industry report, so 2024 is the latest year publicly available for the state.
- National parks and forests: Queensland Parks and Wildlife Service issued about 231,000 camping permits for about 544,700 campers in 2025.
| Camping permits in Queensland parks and forests by year | ||
|---|---|---|
| Year | Camping permits | Campers |
| 2025 | 231,032 | 544,696 |
| 2024 | 234,848 | 585,906 |
| 2023 | 262,753 | 673,259 |
| 2022 | 255,815 | 667,221 |
| 2021 | 283,695 | 724,397 |
| 2020 | 206,456 | 546,727 |
| 2019 | 215,735 | 596,225 |
| 2018 | 188,643 | 520,325 |
| 2017 | 208,510 | 597,383 |
Source · Data source: Queensland Parks and Wildlife Service camping permits (Queensland Government Open Data Portal); Camper Champ analysis.
What are the most popular campgrounds in Queensland?
Queensland Parks and Wildlife Service (QPWS) issued about 238,000 camping permits, covering 549,000 campers, for stays that began between October 2025 and September 2026 in Queensland's national parks, state forests and recreation areas3.
- Year by year: camping permits peaked at about 283,700 in 2021, during COVID-19 travel restrictions, and were about 231,000 in 20253.
- Most popular camping spot: K'gari (Fraser Island) had about 94,800 campers, ahead of Cooloola Recreation Area (66,900, mostly on Teewah Beach) and Inskip Peninsula (50,900)3.
- Busiest campground: Ocean Beach camping area on Bribie Island had about 20,100 campers, the most of any single camping area3.
- National parks: Conondale National Park (17,400 campers) and Girraween National Park (13,800)3 were the most popular national parks for camping.
- Busiest month: September, with about 68,500 campers starting a stay, while February was the quietest (21,100)3.
| Most popular camping areas in Queensland | |||
|---|---|---|---|
| Rank | Park or forest | Campers | Camping permits |
| 1 | K'gari (Fraser Island) Recreation Area | 94,831 | 35,115 |
| 2 | Cooloola Recreation Area | 66,871 | 28,057 |
| 3 | Inskip Peninsula Recreation Area | 50,886 | 25,086 |
| 4 | Bribie Island Recreation Area | 29,164 | 11,344 |
| 5 | Danbulla State Forest | 23,494 | 9,222 |
| 6 | Conondale National Park | 17,381 | 6,499 |
| 7 | Imbil State Forest | 16,213 | 5,739 |
| 8 | Girraween National Park | 13,835 | 6,112 |
| 9 | Amamoor State Forest | 12,087 | 5,160 |
| 10 | Rinyirru (Lakefield) National Park | 11,366 | 3,713 |
Source · Data source: Queensland Parks and Wildlife Service camping permits (Queensland Government Open Data Portal); Camper Champ analysis.
How much does camping cost in Queensland's national parks?
- From 1 July 2026, a QPWS camping permit costs $7.75 per person per night, or $31 per family per night. Children under 5 camp free4.
- Planning a road trip between these parks? See campervan hire in Brisbane, Cairns and the Gold Coast, or read our Australia camping statistics.
FAQs
How many domestic visitors to Queensland come from interstate?
About a quarter. Of the 25.9 million domestic overnight visitors in 2025, 6.5 million came from other states and 19.4 million were Queenslanders travelling in their own state1.
Where in Queensland do international visitors spend the most per night?
Tropical North Queensland, the region around Cairns. International visitors there spent A$207 a night on average in 2025, ahead of the Whitsundays (A$178) and the Gold Coast (A$144). The Queensland average was A$1352.
When is the busiest time to go camping in Queensland?
September. About 68,500 campers began a stay in Queensland's parks and forests that month, while February was the quietest, with 21,1003.
How many national parks are in Queensland?
Queensland has more than 1,000 national parks and protected areas, looked after by around 875 rangers16.
Campervan hire in Australia
- Adelaide
- Alice Springs campervan rental
- Broome
- Cairns campervan rental
- Campervan hire in Brisbane
- Campervan hire in Melbourne
- Campervan hire in Sydney
- Campervan hire in Tasmania
- Darwin
- Devonport motorhome hire
- Gold Coast
- Hobart
- Launceston
- Perth motorhome hire
References
- Domestic Tourism Statistics Snapshot, year ending December 2025 (Tourism and Events Queensland) · teq.queensland.com ↑ b c d e f g h i j k l m n o p q r s t u v w x y z a2 b2
- International Tourism Snapshot, year ending December 2025 (Tourism and Events Queensland) · teq.queensland.com ↑ b c d e f g h i j k l m n o p q r s
- Camping and vehicle permits – QPWS permits issued for camping (Queensland Government Open Data Portal) · data.qld.gov.au ↑ b c d e f g h i j
- Camping fees from 1 July 2026 – Queensland parks and forests · parks.des.qld.gov.au ↑ b
- Domestic Tourism Statistics results — December quarter 2025 (Tourism Research Australia) · Tourism Research Australia ↑ b
- International tourism results — year ending December 2025 (International Visitor Survey) · Tourism Research Australia ↑ b c d e f
- International Visitor Survey tourism results — year ending December 2023 compared with 2019 (Tourism Research Australia) · Tourism Research Australia ↑ b c
- NVS results data tables for the year ending December 2023 compared to December 2019 (Tourism Research Australia) · Tourism Research Australia ↑ b
- Factsheet – Total Visitation, year ending September 2021 (Tourism and Events Queensland) · teq.queensland.com ↑ b c
- Total International and Domestic Fact Sheet, year ending June 2020 (Tourism and Events Queensland) · teq.queensland.com ↑ b
- International Tourism Snapshot, year ending June 2019 (Tourism and Events Queensland) · teq.queensland.com ↑
- Tourism on the Great Barrier Reef · Great Barrier Reef Marine Park Authority ↑
- Whitsundays Domestic Tourism Surpasses $970 Million (Tourism Whitsundays media release, 24 March 2026) · tourismwhitsundays.com.au ↑ b c d
- Caravan and Camping State of Industry 2025 (Caravan Industry Association of Australia) · assets.pc.gov.au ↑
- Australian caravan and camping industry statistics (Caravan Industry Association of Australia, updated 8 September 2026) · caravanindustry.com.au ↑ b
- QPWS celebrates 50 years of environmental conservation (Queensland Government ministerial statement) · statements.qld.gov.au ↑
- TRA — International tourism results, Australia, March 2024 · Tourism Research Australia