

Updated
At a Glance
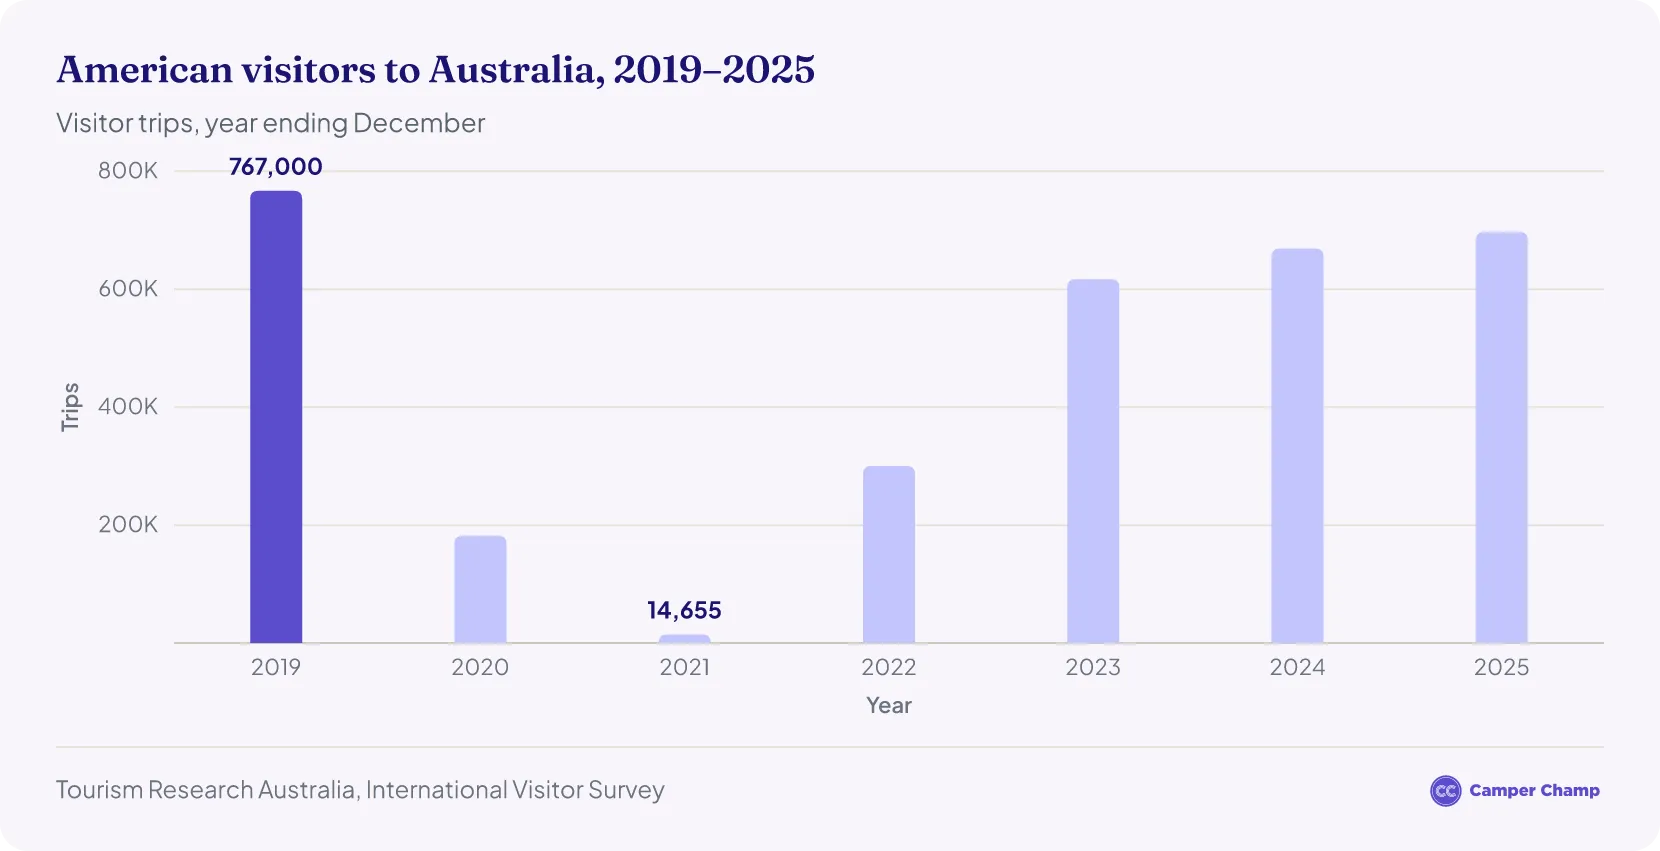
- Almost 697,000 US visitors travelled to Australia in 2025, up 4.21% on 2024.1
- US arrivals are up 2.0% in 2026 so far: 485,610 from January to August, against 476,200 a year earlier.2
- The 2025 total is still 9.14% below the pre-pandemic level of 767,000 in 2019.3
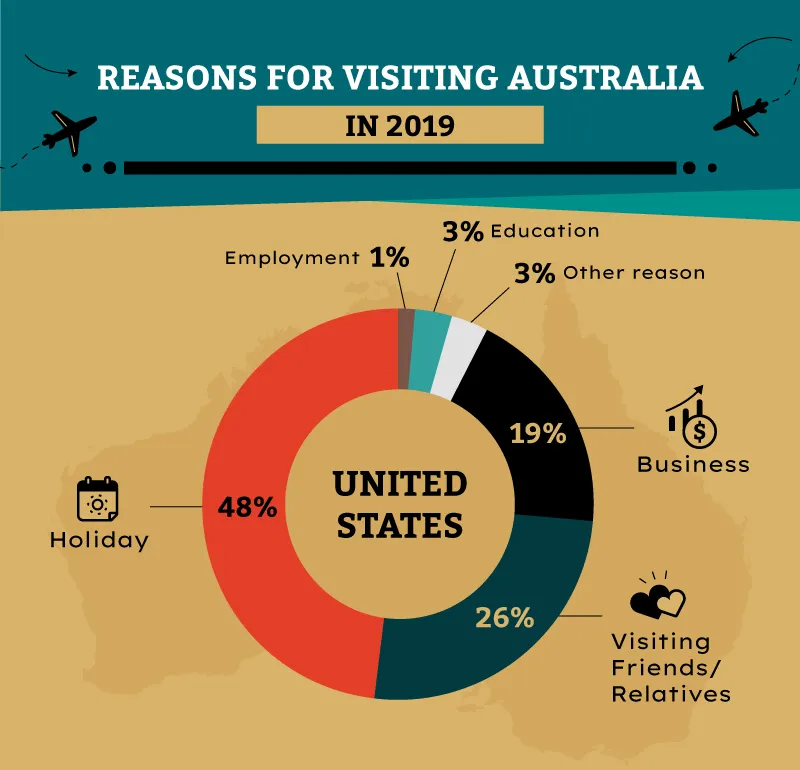
- The US was Australia's 4th-largest international visitor market in 2025, with 8.4% of all visitor trips.1
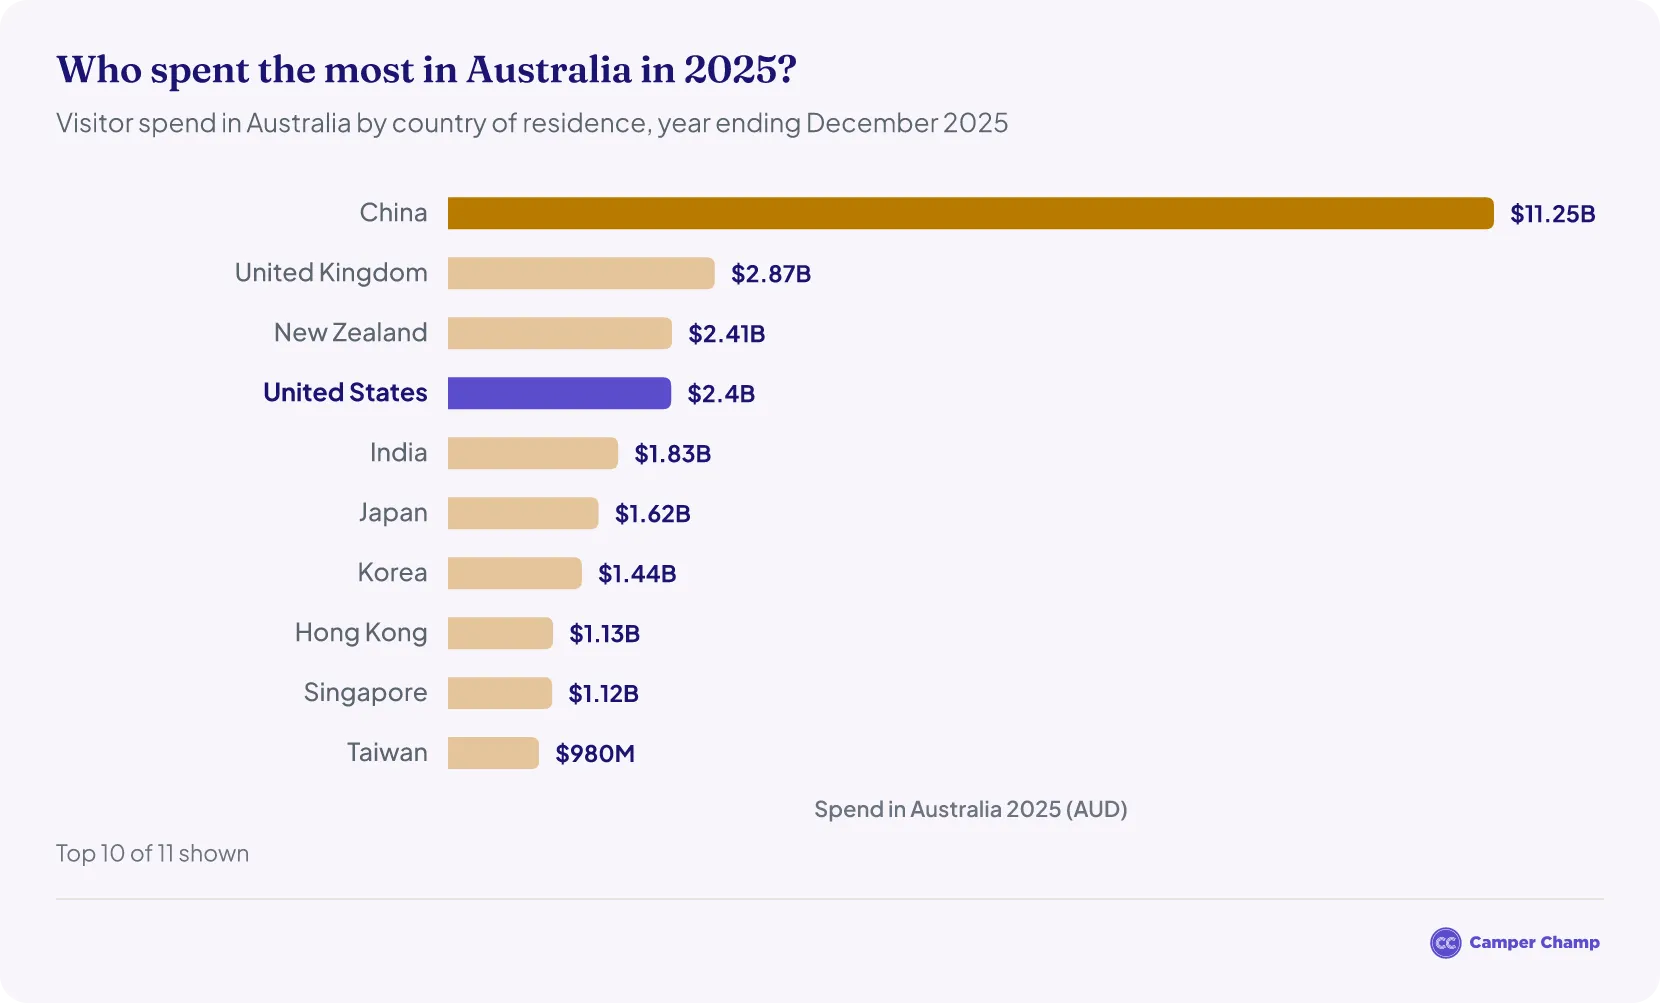
- US visitors spent $4.62 billion on their trips in 2025, including $2.40 billion within Australia — 6.1% of all international visitor spending.1
- Total trip spending was 17.33% higher than in 2019, even though visitor numbers have not fully recovered.3
- American visitors stayed an average of 17 nights per trip, less than half the 38-night average for all international visitors.1
How many American tourists visit Australia each year?
Almost 697,000 visitors from the United States travelled to Australia in 2025.1
- That was a 4.21% increase on the 669,000 US visitors in 2024.1
- Visitor numbers were still 9.14% lower than in 2019, before the pandemic, when 767,000 Americans came.3
- The United States ranked 4th among all international visitor markets to Australia in 2025, behind New Zealand, China and the United Kingdom.1
How many Americans have visited Australia in 2026?
485,610 short-term visitor arrivals from the United States were recorded from January to August 2026, 2.0% more than the 476,200 in the same months of 2025.2
- March was the busiest month so far, with 85,750 arrivals, and May the quietest, with 44,550.2
- In August 2026, 50,650 Americans arrived, up 5.3% on August 2025.2
- Arrivals are highest from December to March: December 2025 was last year's busiest month, with 102,590.2
The table below compares each month with 2025. These figures come from the Australian Bureau of Statistics, which counts every short-term arrival of any age. Tourism Research Australia's visitor figures above cover people aged 15 and over, so the ABS totals are higher.
Latest available: August 2026. September figures are due on 12 November 2026.
| US visitor arrivals to Australia by month, 2025 and 2026 | |||
|---|---|---|---|
| Month | 2025 | 2026 | Change |
| January | 72,090 | 76,860 | +6.6% |
| February | 79,290 | 78,010 | -1.6% |
| March | 83,460 | 85,750 | +2.7% |
| April | 49,040 | 54,900 | +11.9% |
| May | 42,360 | 44,550 | +5.2% |
| June | 51,750 | 48,440 | -6.4% |
| July | 50,090 | 46,450 | -7.3% |
| August | 48,120 | 50,650 | +5.3% |
| September | 41,820 | – | – |
| October | 56,280 | – | – |
| November | 68,080 | – | – |
| December | 102,590 | – | – |
| January to August | 476,200 | 485,6102 | +2.0% |
Source · Australian Bureau of Statistics, Overseas Arrivals and Departures, Australia, August 2026 (short-term visitors arriving, original series). Counts are arrivals, so a person who visits twice is counted twice. 2026 figures for September to December are not yet released.
US visitors to Australia by year, 2015–2025
744,970 short-term visitor arrivals from the United States were recorded in 2025, up 4.6% on 2024 but still 8.9% below the record of 817,990 in 2019.2
- Arrivals grew every year from 2015 to 2019.2
- They fell to 188,680 in 2020 and just 16,760 in 20212, while Australia's border was closed during the pandemic.
- Numbers have risen every year since, passing 700,000 again in 2024.2
These are Australian Bureau of Statistics arrival counts, so they run higher than the Tourism Research Australia visitor figures at the top of the page.
| US visitor arrivals to Australia by year, 2015–2025 | ||
|---|---|---|
| Year | US visitor arrivals | Change on previous year |
| 2015 | 618,630 | +10.1% |
| 2016 | 716,530 | +15.8% |
| 2017 | 780,570 | +8.9% |
| 2018 | 789,110 | +1.1% |
| 2019 | 817,990 | +3.7% |
| 2020 | 188,680 | -76.9% |
| 2021 | 16,760 | -91.1% |
| 2022 | 326,030 | +1,845.3% |
| 2023 | 659,740 | +102.4% |
| 2024 | 712,380 | +8.0% |
| 2025 | 744,9702 | +4.6% |
Source · Australian Bureau of Statistics, Overseas Arrivals and Departures, Australia, August 2026 (short-term visitors arriving, original series), totalled January to December. Counts are arrivals, so a person who visits twice is counted twice.
How much did American tourists spend in Australia in 2025?
American visitors spent about $4.62 billion on trips to Australia in 2025 (year ending December).1
- Their spending within Australia rose 20.27%, from $1.99 billion in 2024 to $2.40 billion.1 Total trip spending rose by 6.18%, from $4.35 billion to $4.62 billion.
- Spending within Australia was also 24.08% higher than in 2019, when it was $1.93 billion.4 Total trip spending was 17.33% above the 2019 figure of $3.93 billion.3
Average spend per American visitor
Each American visitor spent an average of about $3,440 in Australia1 in 2025, or $6,620 per trip once flights and other costs paid outside Australia are included.
- Per night, US visitors spent about $198 in Australia, well above the $125 average for all international visitors.1
- Their spend per visitor is below the $4,740 average for all international visitors because they stay fewer nights: 17 a trip, against 38.1
- Tourism Research Australia's own published average for American visitors was $3,100 in 2023–24 (July to June).5
These averages divide Tourism Research Australia's 2025 spending totals by its trip and night counts.
| Spending by US visitors to Australia | ||
|---|---|---|
| Year | Spend in Australia | Total trip spend |
| 2019 | 1.93 B | 3.93 B |
| 2020 | – | 1.11 B |
| 2021 | 0.10 B | 0.24 B |
| 2022 | 0.89 B | 1.93 B |
| 2023 | 1.96 B | 4.44 B |
| 2024 | 1.99 B | 4.35 B |
| 2025 | 2.40 B1 | 4.62 B1 |
Source · Note: “Spend in Australia” is money spent in the country. “Total trip spend” also covers costs paid outside Australia, such as international flights and pre-trip expenses.
The US share of international visitors to Australia
Why do Americans visit Australia?
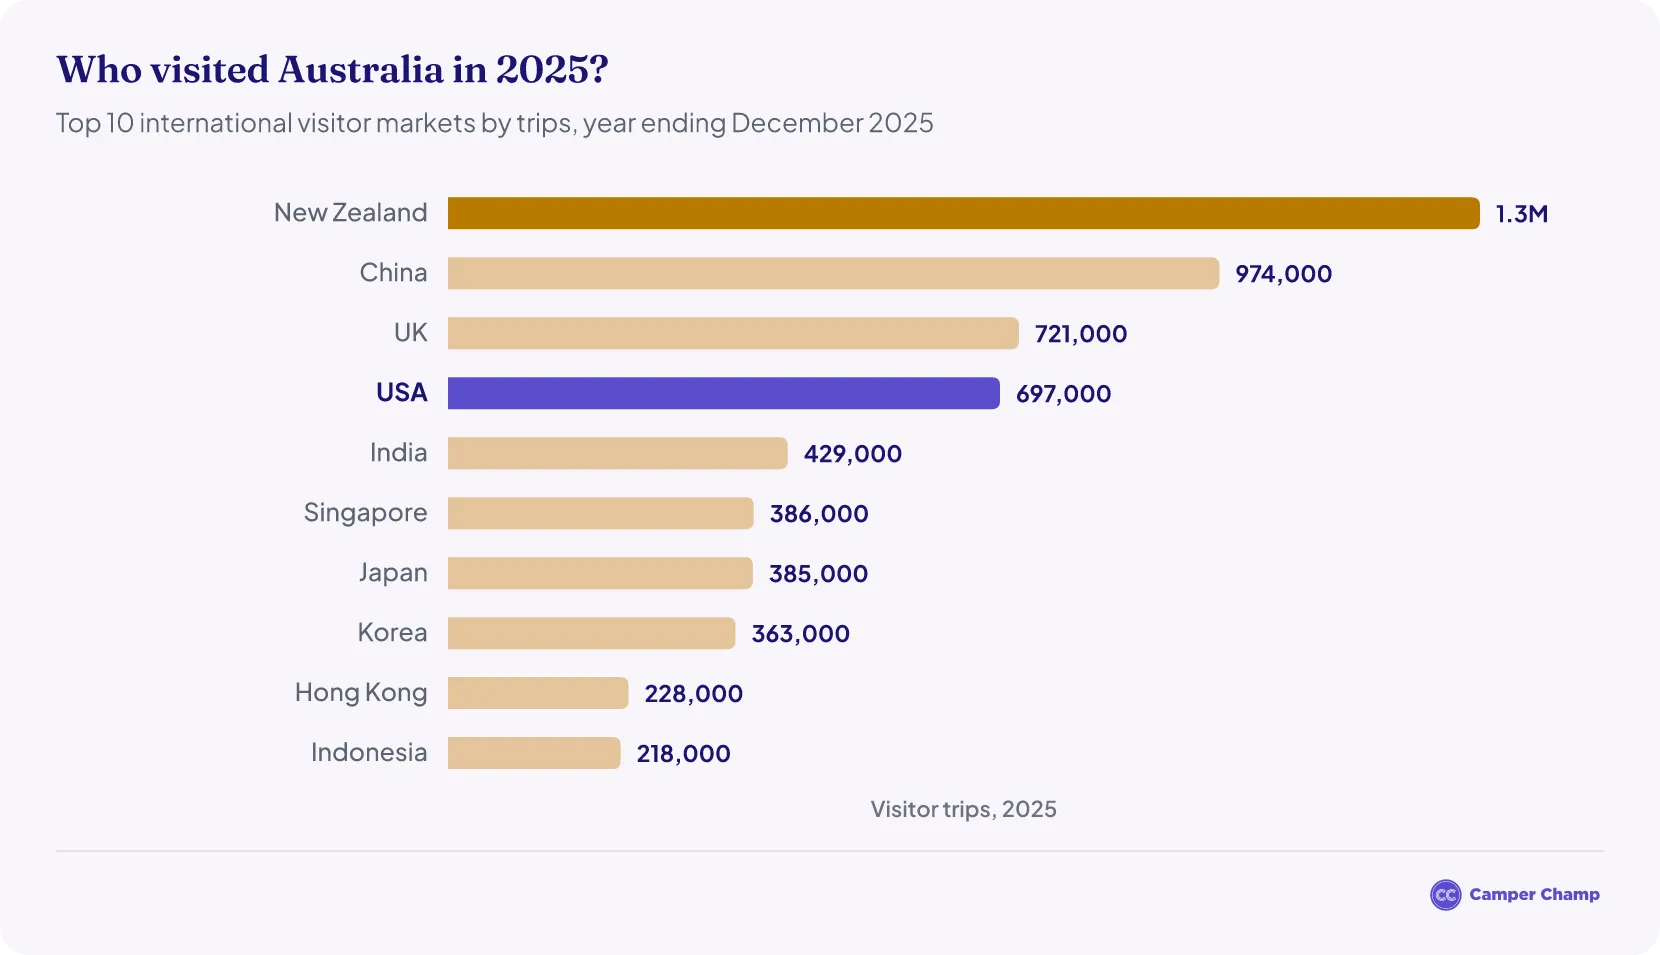
Half of American visitors (50%) came to Australia for a holiday in 2023–24, compared with 43% of all international visitors.5
- Visiting friends and relatives: 29% of US visitors (all visitors: 34%)5
- Business: 13% (all visitors: 9%)5
- Education: 2% (all visitors: 6%)5
- Employment: 1% (all visitors: 4%)5
- Other reasons: 4% (all visitors: 4%)5
More recent findings:
- Holidays were still the most common reason Americans visited Australia in the year to June 2025, ahead of visiting friends and relatives.6
- The US is Australia's biggest international market for holiday spending.7
- American holidaymakers spend an average of $536 per night, more than double the average across all international visitors.7
Latest available: shares by reason for 2023–24 (July to June), the most recent Tourism Research Australia has published for US visitors; top reason for the year to June 2025.
More visitor statistics for Australia
- Australia Tourism Statistics
- Chinese Tourism in Australia Statistics
- Hong Kong Tourism in Australia Statistics
- Indian Tourism in Australia Statistics
- Japanese Tourism in Australia Statistics
- Malaysia Tourism in Australia Statistics
- New Zealand Tourism in Australia Statistics
- Singapore Tourism in Australia Statistics
- South Korea Tourism in Australia Statistics
- UK Tourism in Australia Statistics
How long do American tourists stay in Australia?
- American visitors stayed an average of 17 nights per trip in 2025, well short of the 38-night average for all international visitors.1
- This may be because American workers get relatively little paid annual leave.
Where Americans travel, and where Australia ranks
- In 2018, Mexico and Europe were the most popular international destinations for Americans, according to the US National Travel and Tourism Office. Mexico alone drew more than 36 million American visitors.8
- Australia drew almost 697,000 American visitors in 2025,1 but it remains a minor destination for Americans.
- Oceania ranked 9th of the 10 world regions Americans visited in 2018, with a market share of just 0.9%.9
Where do American tourists go in Australia?
Only some states publish figures for American visitors. In 2025:
- New South Wales: the United States was the state's second-largest international market, behind China.10 US visitor numbers rose 7.2%, and their spending in the state rose 29.8% to $1.1 billion.
- Queensland: 228,000 US visitors went to Queensland, up 5.2% on 2024. They spent $502.4 million in the state.11
- South Australia: 44,000 US visitors stayed a total of 573,000 nights, about 6% of all US visitors to Australia.12
Where Americans go in Queensland
US visitors by Queensland region in 2025:
- Tropical North Queensland (Cairns and the Great Barrier Reef): 111,000, up 30.6%11
- Brisbane: 109,000, down 2.8%11
- Gold Coast: 35,000, up 6.3%11
- Sunshine Coast: 23,000, down 1.4%11
- Whitsundays: 18,000, down 24.8%11
We could not find 2025 figures for US visitors to Victoria, Western Australia, Tasmania or the territories.
How many Americans camp in Australia?
38,069 US visitors took a caravan or camping holiday in Australia in the year to June 2017, up 23% on the year before.13 This is the most recent national figure for American campers.
- In the Northern Territory, 13% of US visitors stayed in a caravan park or campsite in 2024. It was the third most common type of accommodation, well behind hotels (69%).14
- The Northern Territory had 31,000 US visitors in 2024, staying an average of 7.1 nights.14
Latest available: national figure for the year to June 2017; Northern Territory figures for 2024.
How much does it cost to hire a campervan in Australia?
Hiring a campervan in Australia typically costs $148 to $197 a day, depending on where you pick it up. The figures come from Camper Champ's own checks of supplier quotes for a 7-day budget or mid-range hire, made in October 2026. All prices are in Australian dollars.
- Cheapest pick-up cities: Brisbane ($148 a day), Sydney ($150) and Melbourne ($152).
- Most expensive: Hobart ($197 a day) and Darwin ($185).
- Cheapest time to hire: June, when rates in most cities fall to between $131 and $169 a day.
- Most expensive time: January, the height of the Australian summer, when rates in most cities reach $185 to $236 a day.
- Best deals: offers start at about $70 a day in Sydney, Cairns and Brisbane.
The table below shows the typical daily rate and the cheapest and dearest months for eight pick-up cities.
| Campervan hire prices in Australia | |||
|---|---|---|---|
| Pick-up city | Typical daily rate | Cheapest month | Most expensive month |
| Sydney | $150 | June 2027 ($131) | January 2027 ($185) |
| Melbourne | $152 | June 2027 ($136) | January 2027 ($186) |
| Brisbane | $148 | June 2027 ($133) | Sold out in January 2027 |
| Cairns | $160 | June 2027 ($132) | January 2027 ($186) |
| Adelaide | $166 | March 2027 ($136) | January 2027 ($193) |
| Perth | $175 | June 2027 ($156) | January 2027 ($199) |
| Darwin | $185 | June 2027 ($167) | April 2027 ($201) |
| Hobart | $197 | June 2027 ($169) | January 2027 ($236) |
Source · Camper Champ price checks of supplier quotes for a 7-day budget or mid-range campervan hire, collected October 2026. Daily rates in AUD; the typical rate is the average across the next 12 pick-up months.
FAQs
Has American travel to Australia recovered since COVID-19?
Spending has, but visitor numbers have not yet. US visitors' total trip spending reached $4.62 billion in 2025, 17.33% above 2019.3 The almost 697,000 Americans who visited in 2025 were still 9.14% short of the 767,000 who came in 2019.
Are American tourists spending more in Australia?
Yes. The number of US visitors rose 4.21% in 2025, while their spending within Australia rose 20.27% to $2.40 billion.1 Spending is growing much faster than visitor numbers, so the average American visitor is spending more on the ground.
What is the difference between 'spend in Australia' and 'total trip spend'?
Spend in Australia counts only what visitors spend while they are in the country. Total trip spend also includes costs paid outside Australia, such as international flights and pre-trip expenses. For US visitors in 2025, $2.40 billion of the $4.62 billion total was spent in Australia.1
Where do these statistics come from?
The 2024 and 2025 figures come from Tourism Research Australia's International Visitor Survey for the year ending December.1 The yearly and 2026 monthly arrivals tables use Australian Bureau of Statistics counts, which include visitors of all ages, so they are higher than the survey figures. A few sections use financial-year periods (July to June) and say so.
Campervan hire in Australia
- Adelaide campervan rental
- Alice Springs campervan rental
- Brisbane motorhome hire
- Broome campervan rental
- Campervan hire in Cairns
- Campervan hire in Gold Coast
- Campervan hire in Hobart
- Darwin
- Devonport motorhome hire
- Launceston campervan rental
- Melbourne campervan rental
- Perth motorhome hire
- Sydney motorhome hire
- Tasmania motorhome hire
References
- International tourism results — year ending December 2025 (International Visitor Survey) · Tourism Research Australia ↑ b c d e f g h i j k l m n o p q r s t u v w
- Overseas Arrivals and Departures, Australia, August 2026 — Table 5: Short-term visitors arriving, selected countries of residence (original) · Australian Bureau of Statistics ↑ b c d e f g h i j k
- International Visitor Survey tourism results — year ending December 2020 compared with 2019 (Tourism Research Australia) · Tourism Research Australia ↑ b c d e
- International Visitor Survey tourism results — year ending December 2023 compared with 2019 (Tourism Research Australia) · Tourism Research Australia ↑
- Visitor economy profile 2023–24 — Market: United States of America (Tourism Research Australia) · Tourism Research Australia ↑ b c d e f g
- Overseas arrivals and departures, Australia, 2024-25 financial year (ABS) · Australian Bureau of Statistics ↑
- Market insights snapshot — United States of America (Tourism Australia) · tourism.australia.com ↑ b
- U.S. Citizen International Outbound Travel Up Six Percent in 2018 (National Travel and Tourism Office) · travel.trade.gov ↑
- U.S. Citizen Travel to International Regions, 2018 Analysis · travel.trade.gov ↑
- Record-breaking year for international tourism in NSW (Destination NSW) · destinationnsw.com.au ↑
- International Tourism Snapshot, year ending December 2025 (Tourism and Events Queensland) · teq.queensland.com ↑ b c d e f
- International Performance to December 2025 (South Australian Tourism Commission) · tourism.sa.gov.au ↑
- More overseas visitors are caravanning and camping across Australia · caravanindustry.com.au ↑
- International market fact sheet: America, NT snapshot year ending December 2024 (Tourism NT) · tourismandeventsnt.com.au ↑ b
- TRA — International tourism results, Australia, March 2024 · Tourism Research Australia