

Updated
At a glance
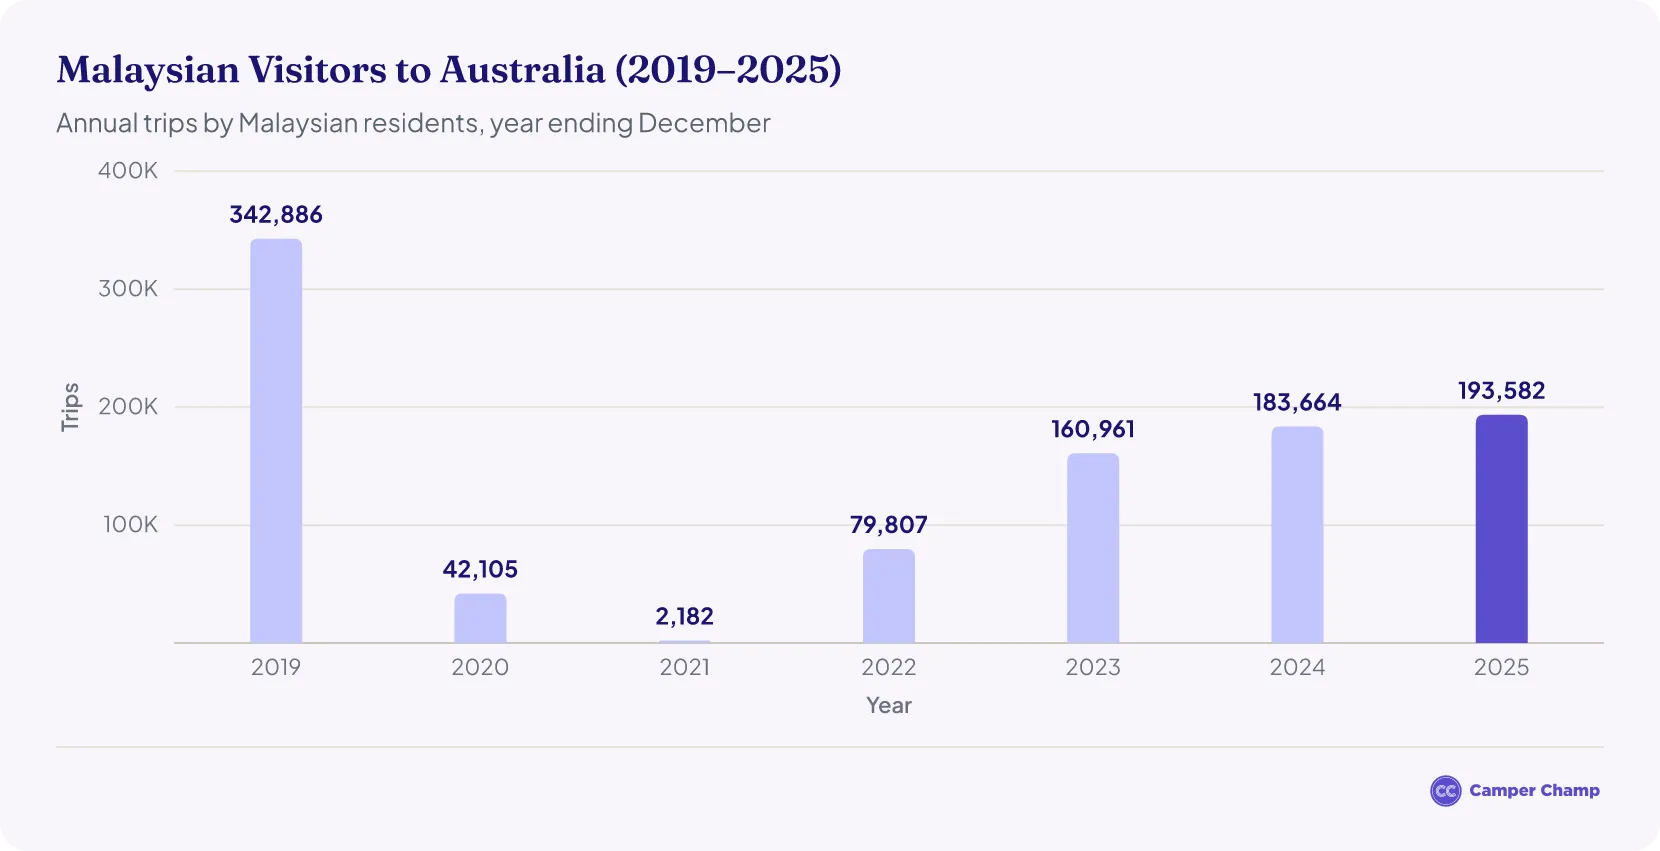
- About 193,600 Malaysian visitors came to Australia in 2025, up 5.4% on 20241 but still 43.5% below 20192.
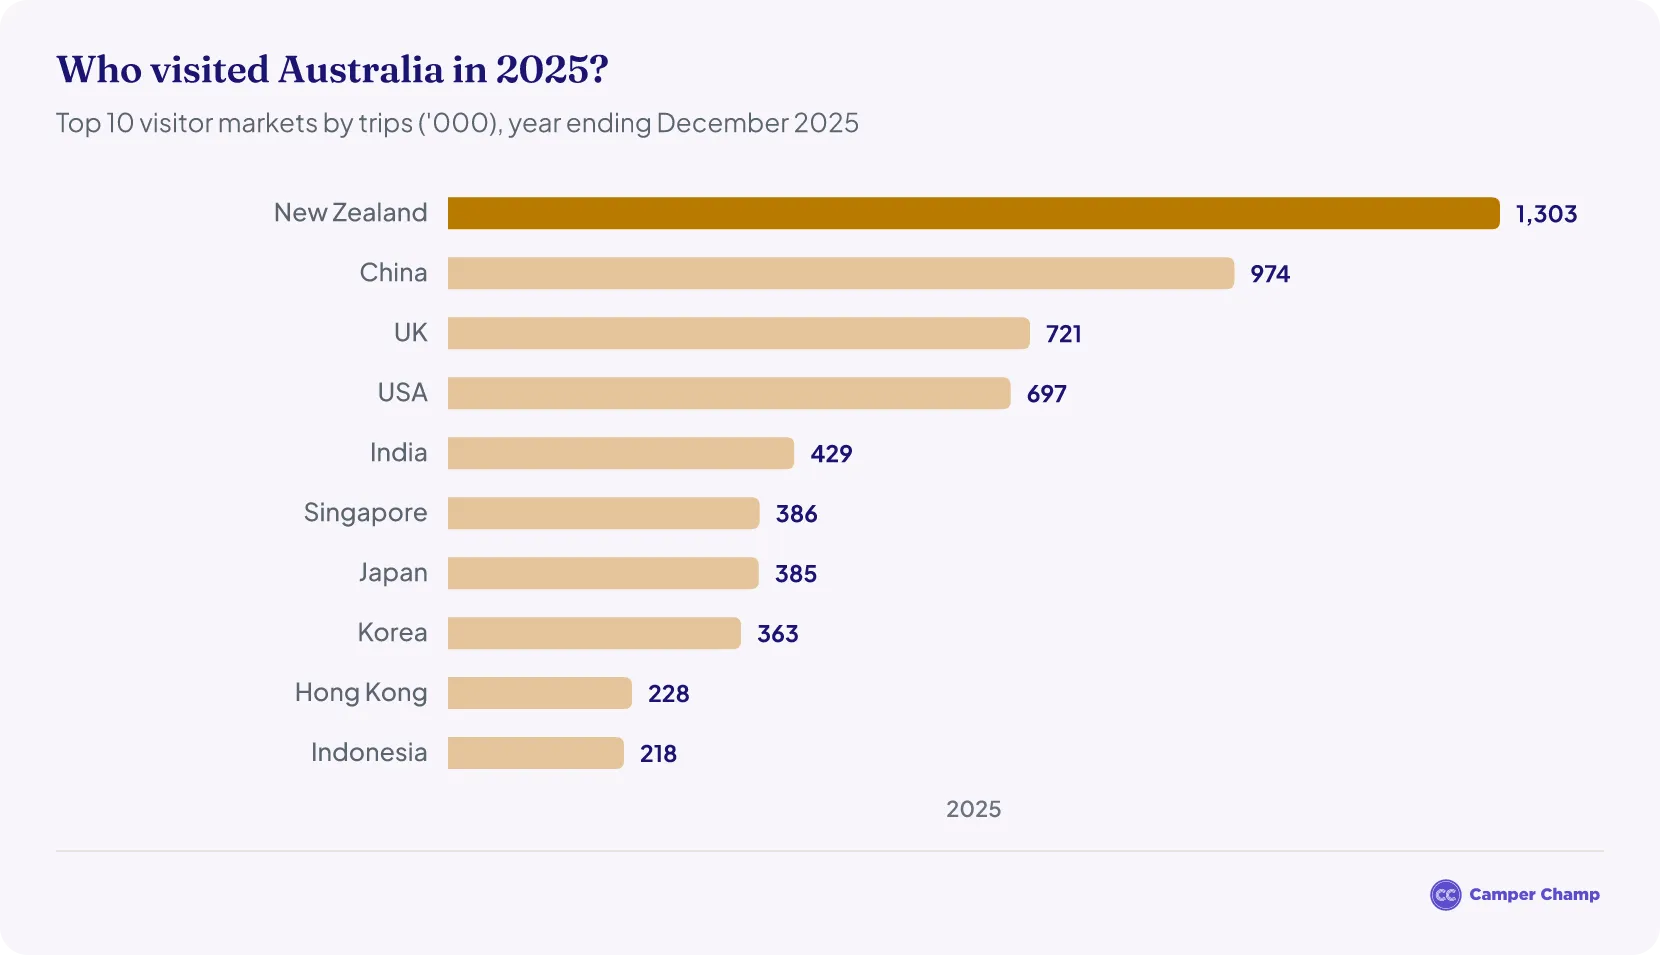
- Malaysia was Australia's 11th-largest source of visitors in 2025, just outside the top 103.
- Malaysian visitors spent $705 million in Australia in 2025, or $933 million including airfares and other trip costs1.
- In the year ending June 2026, over 195,000 Malaysian visitors came to Australia, up 8.5%4.
- Malaysian visitors favour Western Australia and Victoria: 31% went to WA in 2025, against 13% of all international visitors3.
- Only 16% of Malaysian visitors travelled beyond the capital cities and the Gold Coast in 20253.
How many Malaysian tourists visit Australia each year?
| Malaysian visitors to Australia by year (2019–2025) | ||
|---|---|---|
| Year | Malaysian visitors | Change on previous year |
| 2019 | 342,8862 | – |
| 2020 | 42,1055 | −87.7% |
| 2021 | 2,1825 | −94.8% |
| 2022 | 79,8076 | +3,557.2% |
| 2023 | 160,9617 | +101.7% |
| 2024 | 183,6641 | +14.1% |
| 2025 | 193,5821 | +5.4% |
Source · Tourism Research Australia, International Visitor Survey (trips by visitors aged 15 and over, year ending December).
How much did tourists from Malaysia spend in Australia in 2025?
Malaysian visitors spent about $933 million on their trips to Australia in 20251.
- Spending within Australia rose 2.9% to $705 million, up from $685 million in 20241, while total trip spending grew 3.9% from $898 million to $933 million.
- Both are still well short of 2019: spending in Australia was 27% below that year's $965 million2, and total trip spending 27.4% below its $1.28 billion.
- Malaysia ranked 16th among international markets for total spending in 20251.
| Tourism Spending by Malaysian Visitors in Australia | ||
|---|---|---|
| Year | Spend in Australia | Total trip spend |
| 2019 | $0.96 B2 | $1.28 B2 |
| 2020 | – | $0.27 B5 |
| 2021 | $0.02 B6 | $0.02 B6 |
| 2022 | $0.31 B6 | $0.42 B6 |
| 2023 | $0.59 B7 | $0.82 B7 |
| 2024 | $0.69 B1 | $0.90 B1 |
| 2025 | $0.70 B1 | $0.93 B1 |
Source · Note: “Spend in Australia” is spending within Australia, while “Total Trip Spend” includes all trip expenses, including those outside Australia such as international flights and pre-trip costs.
How many Malaysian tourists visited Australia in 2026?
Between January and August 2026, 136,930 short-term visitors arrived from Malaysia, 2.2% more than in the same months of 20258.
In the 12 months to June 2026, over 195,000 Malaysian visitors came to Australia4, up 8.5% on the year before, when just over 180,000 came.
How much did Malaysian visitors spend in the year to June 2026?
Over the same 12 months they spent about $1.06 billion on their trips, including $845 million within Australia4. That was 23.9% more than the year before, when they spent just over $856 million.
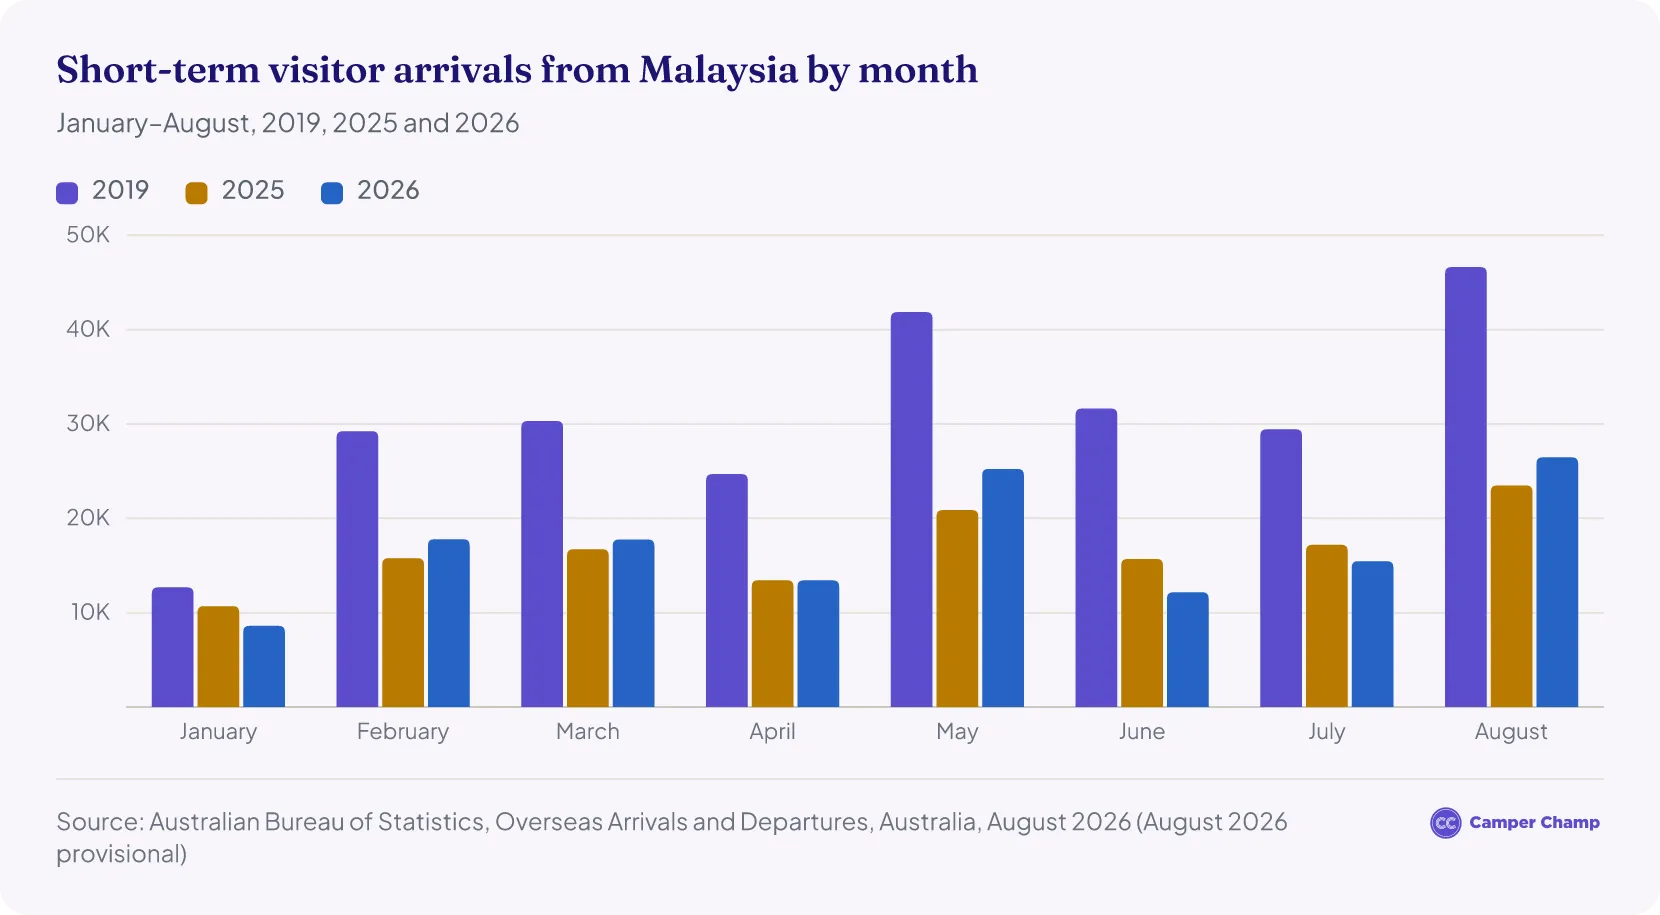
Malaysian arrivals in Australia by month (2025–2026)
213,680 short-term visitors from Malaysia arrived in Australia in 2025, up 5.2% on 2024 (203,080) but only about 56% of the 384,900 who came in 20198. These are border arrivals of visitors of all ages, so they run higher than the visitor survey figures above, which count visitors aged 15 and over1.
In August 2026, 26,470 arrived, up 12.7% on August 2025, making Malaysia the ninth-largest source of short-term visitors that month9.
| Short-term visitor arrivals from Malaysia by month (January–August) | ||||
|---|---|---|---|---|
| Month | 2019 | 2025 | 2026 | 2026 vs 2025 |
| January | 12,6908 | 10,7008 | 8,6108 | −19.5% |
| February | 29,2408 | 15,7808 | 17,7908 | +12.7% |
| March | 30,3208 | 16,7308 | 17,7608 | +6.2% |
| April | 24,6908 | 13,4408 | 13,4308 | −0.1% |
| May | 41,8608 | 20,8808 | 25,2408 | +20.9% |
| June | 31,6408 | 15,7008 | 12,1708 | −22.5% |
| July | 29,4408 | 17,2008 | 15,4608 | −10.1% |
| August | 46,6308 | 23,4908 | 26,4708 | +12.7% |
Source · Australian Bureau of Statistics, Overseas Arrivals and Departures, Australia, August 2026 (short-term visitor arrivals from Malaysia, original series; August 2026 is provisional).
When do Malaysian tourists visit Australia?
Malaysian visitors come most often in May and from August to September, and least often in January.
- In 2025, September was the busiest month, with 24,710 short-term visitors arriving from Malaysia, followed by August (23,490) and May (20,880)8.
- January was the quietest month of 2025, with 10,700 arrivals8.
- The pattern was the same before the pandemic: in 2019, August (46,630) and May (41,860) were the two busiest months and January (12,690) the quietest8.
- So far in 2026, August (26,470) and May (25,240) are again the busiest months8.
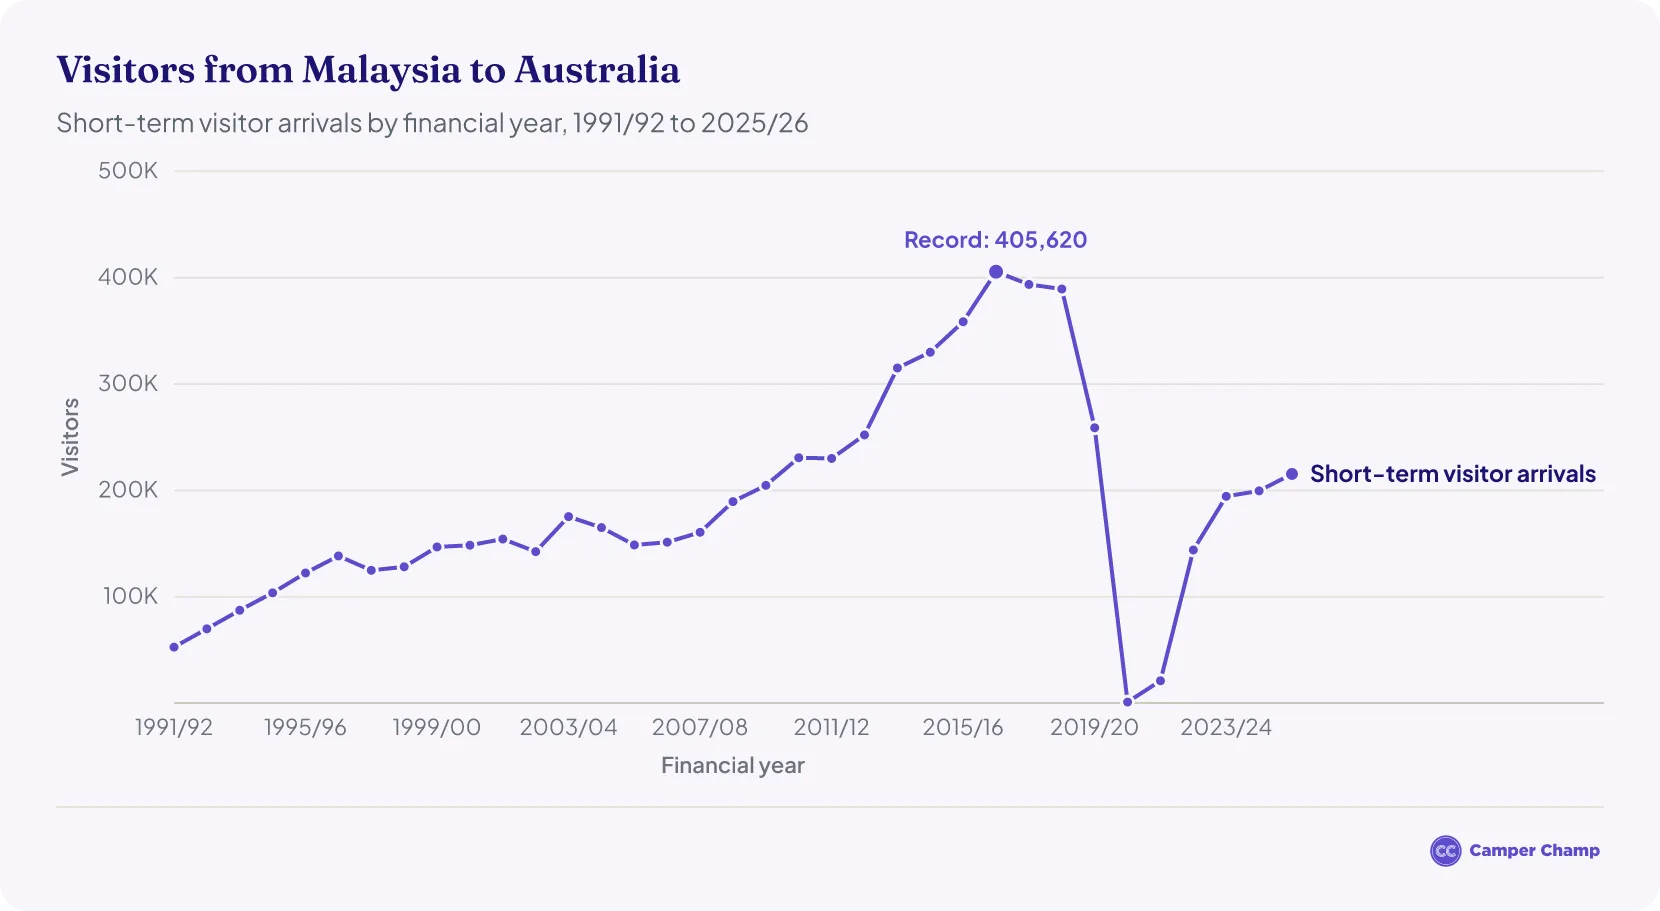
Malaysian visitors to Australia by financial year
Other Resources
- Australia Tourism Statistics
- Chinese Tourism in Australia Statistics
- Hong Kong Tourism in Australia Statistics
- Indian Tourism in Australia Statistics
- Japanese Tourism in Australia Statistics
- New Zealand Tourism in Australia Statistics
- Singapore Tourism in Australia Statistics
- South Korea Tourism in Australia Statistics
- UK Tourism in Australia Statistics
- USA Tourism in Australia Statistics
Malaysia’s share in the Australian tourism industry
- Malaysian visitors made 2.3% of all international trips to Australia in 2025, putting Malaysia 11th among source markets1.
Top countries that sent visitors to Australia in 2025
Malaysia’s contribution to tourism expenditure
- Malaysia's $933 million made up 1.7% of all international visitor trip spending in 20251.
- The $705 million they spent within Australia was 1.8% of the $39.2 billion spent by all international visitors in 20251.
- Malaysian visitors stayed 5.27 million nights in Australia in 2025, slightly fewer than the 5.29 million in 2024, so spending in Australia averaged about $134 per night1.
- Spending in Australia averaged about $3,640 per trip in 2025, or about $4,820 per trip once flights and pre-trip costs are included1.
- In the December quarter of 2025, total trip spending by Malaysian visitors reached $244 million, up 35.7% on the same quarter of 20241.
Where do Malaysian tourists go in Australia?
Malaysian visitors are far more likely than other international visitors to head to Western Australia and Victoria. In 2025, 41% of Malaysian visitors went to Victoria and 31% to Western Australia, compared with 34% and 13% of all international visitors3. Only 25% visited New South Wales, half the international average.
Here is where the 26,470 short-term visitors from Malaysia in August 20269 said they planned to stay:
- Western Australia: 9,440 (36%)9
- Victoria: 7,230 (27%)9
- South Australia: 700 (3%)9
- Tasmania: 270 (1%)9
- ACT: 210 (1%)9
- New South Wales, Queensland and the Northern Territory together: 8,620 (33%)9
Malaysia was Western Australia's second-largest source of visitors in August 2026, behind Singapore9. The ABS does not list Malaysia separately for New South Wales, Queensland or the Northern Territory, where it is not a top-10 market.
Do Malaysian tourists go camping in Australia?
Many Malaysian visitors make time for national parks, though most stay in the cities and in hotels.
- 41% of Malaysian visitors went to a national or state park in 2025, close to the 45% average for international visitors3.
- Among Malaysian leisure visitors to Western Australia, 69% visited a national or state park, against 39% of those who travelled elsewhere in Australia (2024–25 average)10.
- Only 16% of Malaysian visitors travelled beyond the capital cities and the Gold Coast in 2025, compared with 29% of all international visitors3.
- 55% of Malaysian leisure visitors to Western Australia travel independently rather than on a group tour, against 94% elsewhere in Australia10.
- In Western Australia, Malaysian leisure visitors mostly stayed in hotels, resorts and motels (54%) or with friends and relatives (38%). Caravan parks and camping grounds were not among their top three choices10.
There is no national count of Malaysian visitors who hire campervans or stay in caravan parks: the visitor figures in the caravan industry's latest national report, the 2026 edition, cover domestic travellers only11.
Campervan hire in Australia
Malaysian tourism in Australia: quick answers
How much does a Malaysian tourist spend in Australia?
On average, Malaysian visitors spent about $3,640 per trip within Australia in 2025 ($705 million across 193,600 trips)1. Including airfares and other costs outside Australia, the average trip cost about $4,820.
When do most Malaysian tourists visit Australia?
May, August and September are the busiest months. In 2025, September had the most arrivals from Malaysia (24,710) and January the fewest (10,700)8.
Which Australian state do Malaysian tourists visit most?
Victoria. In 2025, 41% of Malaysian visitors went to Victoria and 31% to Western Australia, compared with 34% and 13% of all international visitors3.
References
- International tourism results — year ending December 2025 (International Visitor Survey) · Tourism Research Australia ↑ b c d e f g h i j k l m n o p q r s t u v w
- IVS results for the year ending December 2024 compared to December 2019 · Tourism Research Australia ↑ b c d e f
- TRA market profile: Malaysia 2025 (Tourism Research Australia) · Tourism Research Australia ↑ b c d e f g h
- International tourism results — year ending June 2026 (International Visitor Survey) · Tourism Research Australia ↑ b c
- International Visitor Survey tourism results — year ending December 2021 compared with 2020 (Tourism Research Australia) · Tourism Research Australia ↑ b c
- International Visitor Survey tourism results — year ending December 2022 compared with 2021 (Tourism Research Australia) · Tourism Research Australia ↑ b c d e
- International Visitor Survey tourism results — year ending December 2023 compared with 2022 (Tourism Research Australia) · Tourism Research Australia ↑ b c
- Overseas Arrivals and Departures, Australia, August 2026 — Table 5: Short-term visitors arriving, selected countries of residence (original) · Australian Bureau of Statistics ↑ b c d e f g h i j k l m n o p q r s t u v w x y z a2 b2 c2 d2 e2 f2 g2
- Overseas Arrivals and Departures, Australia, August 2026 · Australian Bureau of Statistics ↑ b c d e f g h i j
- Tourism Western Australia, 2025 Malaysia market profile · assets-us-01.kc-usercontent.com ↑ b c
- Caravan and Camping State of Industry 2026 (Caravan Industry Association of Australia) · caravanindustry.com.au ↑
- TRA — International tourism results, Australia, March 2024 · Tourism Research Australia