

Updated
At a glance
- About 228,000 Hong Kong visitors came to Australia in 2025, up 14.8% on 2024.1
- In the 12 months to June 2026, about 231,000 came, up 14.0%,2 but arrivals from January to August 2026 were 4.0% behind the same months of 2025.3
- Hong Kong visitors spent $1.52 billion on their trips to Australia in 2025, including $1.13 billion spent within Australia.1
- Each visitor spent about $6,640 per trip in total, or about $4,940 within Australia.1
- The average stay was about 29.5 nights.1
- Hong Kong was Australia's 9th-largest international market for both visitors and spending.1
- New South Wales and Victoria were the most visited states, featuring on 48.8% and 45.5% of Hong Kong holiday and family trips in 2025.4
How many tourists from Hong Kong visit Australia each year?
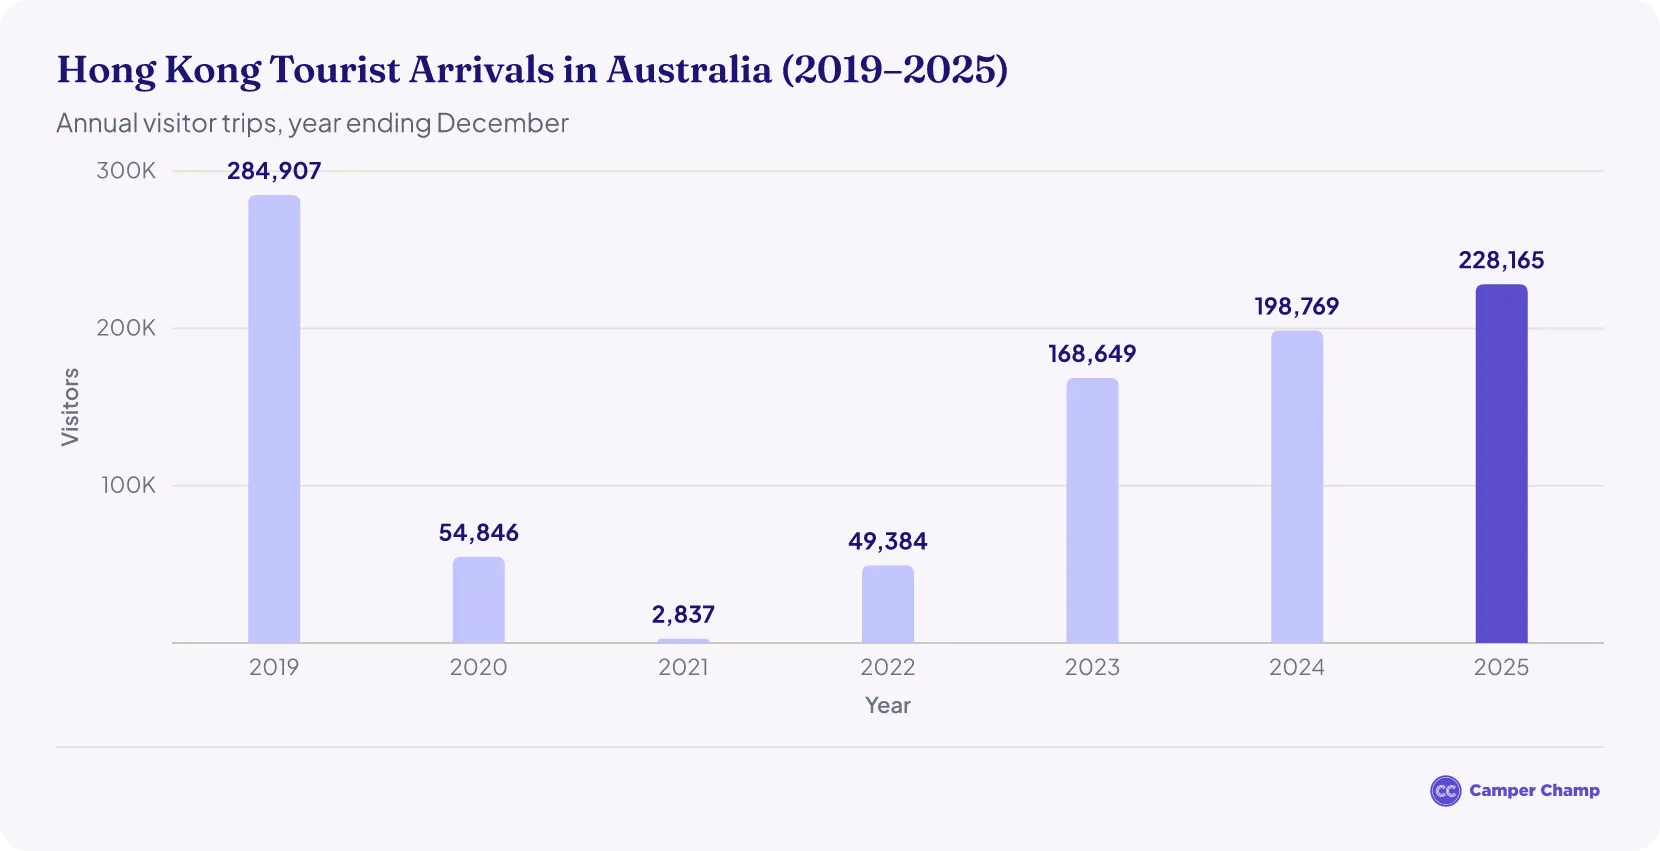
| Hong Kong visitors to Australia by year (2019–2025) | ||
|---|---|---|
| Year | Hong Kong visitors | Change on previous year |
| 2019 | 284,9075 | – |
| 2020 | 54,8466 | −80.7% |
| 2021 | 2,8376 | −94.8% |
| 2022 | 49,3847 | +1,640.7% |
| 2023 | 168,6498 | +241.5% |
| 2024 | 198,7695 | +17.9% |
| 2025 | 228,1651 | +14.8% |
Source · Tourism Research Australia, International Visitor Survey (trips by visitors aged 15 and over, year ending December).
How many Hong Kong tourists have visited Australia in 2026?
About 231,000 Hong Kong visitors travelled to Australia in the year ending June 2026, a 14.0% increase on the year ending June 2025.2
- Hong Kong visitors spent $1.23 billion in Australia over the same 12 months, up 33.7%, or $1.62 billion including airfares and other trip costs, up 26.9%.2
- In the June quarter of 2026, around 49,000 Hong Kong visitors came to Australia, 7.4% fewer than in the June quarter of 2025.2
- In August 2026, 26,430 short-term visitors arrived from Hong Kong, down 14.6% on August 2025 (30,950) and 21.8% below August 2019 (33,800). Hong Kong was Australia's 10th-largest source of visitors that month.9
- From January to August 2026, 160,190 short-term visitors arrived from Hong Kong, 4.0% fewer than in the same months of 2025 and about 75% of the 2019 level. February and March were well up on 2025, but every month since April has been lower.3
The 12-month figure still includes the busy second half of 2025, which is why it shows growth even though arrivals in 2026 itself are running slightly behind. Full-year 2026 figures are not out yet, and the latest monthly arrivals are provisional.
| Short-term visitor arrivals from Hong Kong by month (January–August) | ||||
|---|---|---|---|---|
| Month | 2019 | 2025 | 2026 | 2026 vs 2025 |
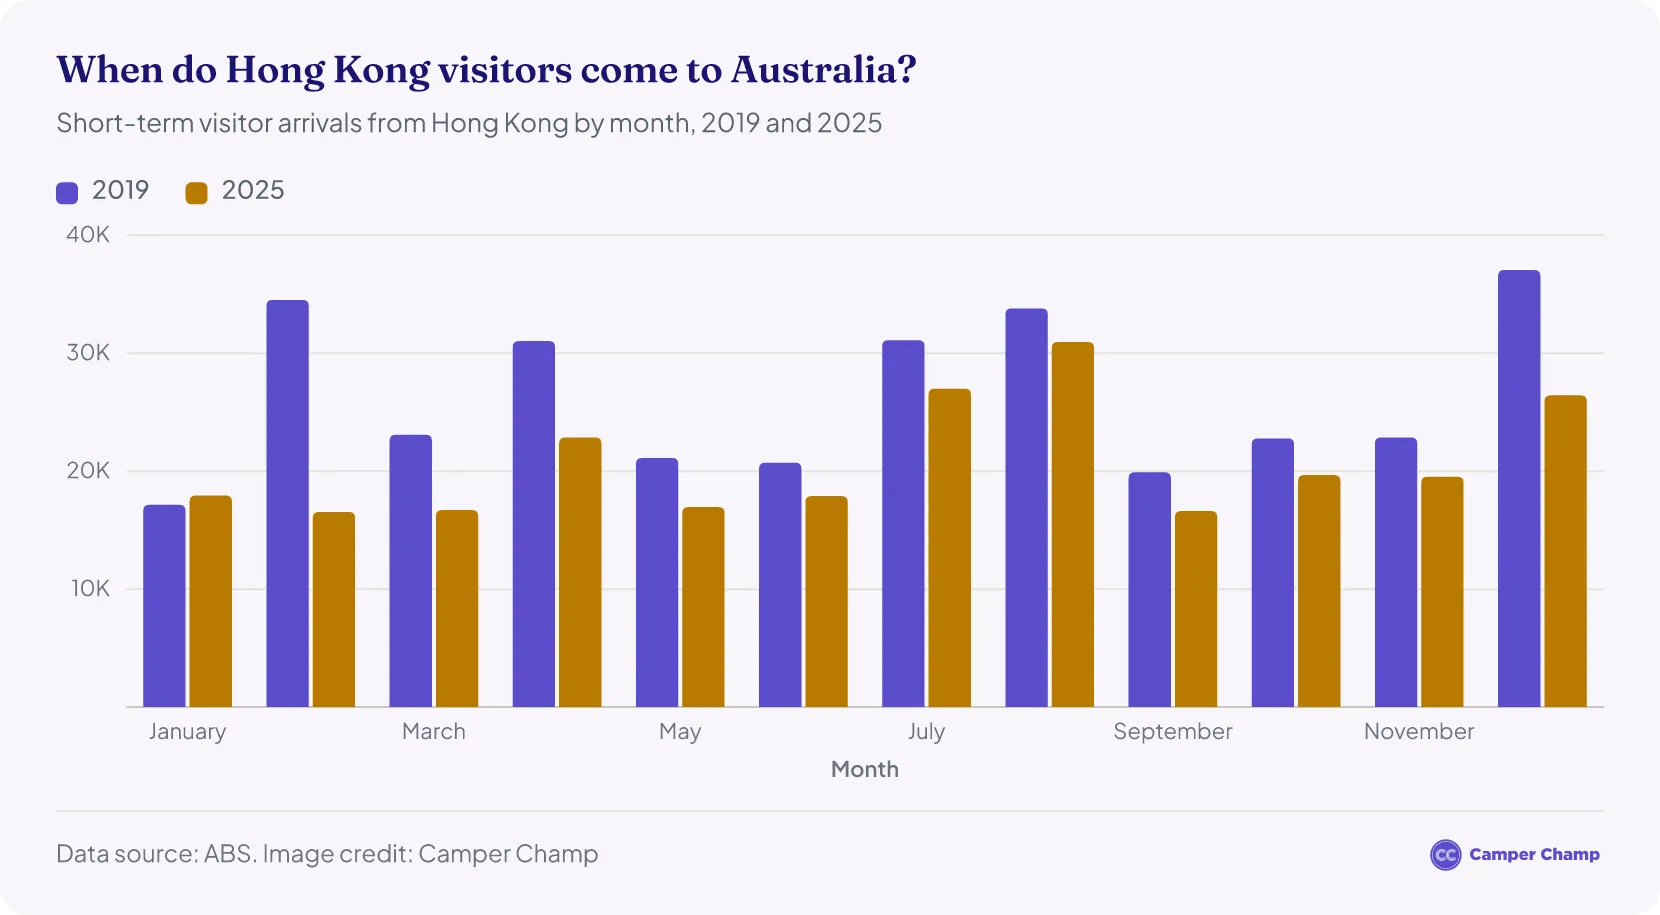
| January | 17,1503 | 17,9403 | 13,0503 | −27.3% |
| February | 34,5203 | 16,5403 | 24,3903 | +47.5% |
| March | 23,0903 | 16,7003 | 21,9903 | +31.7% |
| April | 31,0303 | 22,8603 | 20,6103 | −9.8% |
| May | 21,1203 | 16,9603 | 16,2403 | −4.2% |
| June | 20,7203 | 17,8903 | 16,2403 | −9.2% |
| July | 31,1103 | 27,0003 | 21,2403 | −21.3% |
| August | 33,8003 | 30,9503 | 26,4303 | −14.6% |
Source · Australian Bureau of Statistics, Overseas Arrivals and Departures, Australia, August 2026, Table 5 (short-term visitor arrivals from Hong Kong, original series; recent months are provisional).
Hong Kong visitors to Australia by year
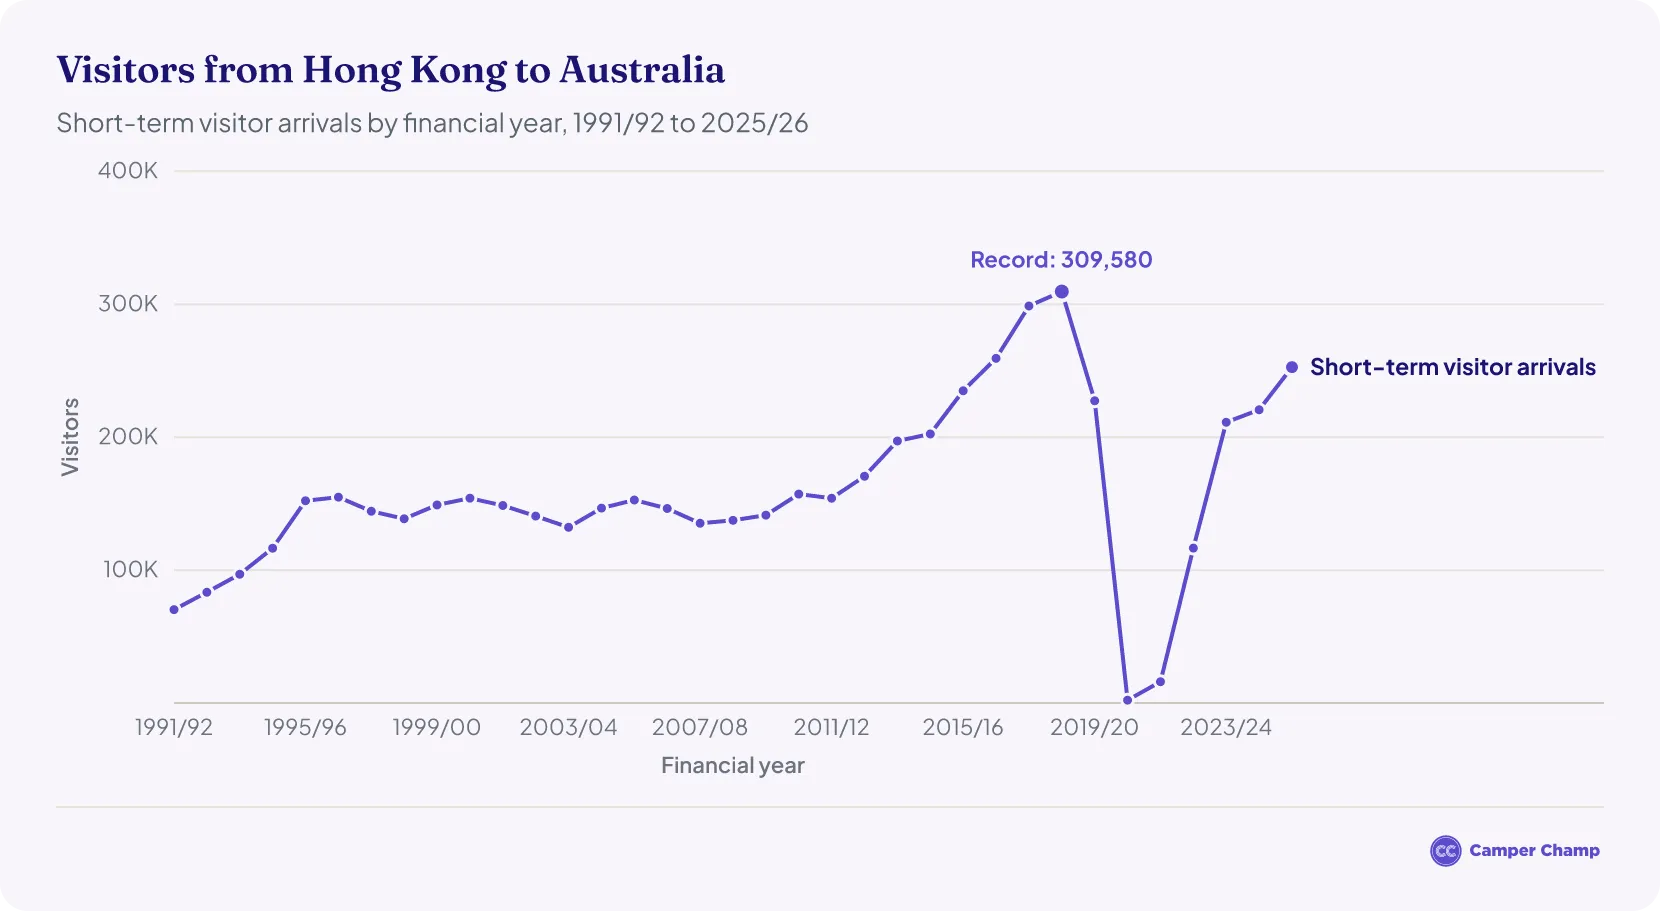
- Short-term visitor arrivals from Hong Kong grew by 14.6% in 2025/26, to 252,720.3
- Arrivals peaked at 309,580 in 2018/19, fell to 2,190 in 2020/21 during COVID-19 border closures, and have since recovered to 82% of that peak.3
These are border arrivals counted by financial year, so they run higher than the visitor survey figures used elsewhere on this page (228,000 in 2025), which count visitors aged 15 and over by calendar year.1
When do Hong Kong tourists visit Australia?
December is usually the busiest month for Hong Kong visitors to Australia, and February to April, around Lunar New Year and Easter, is often busy too.3 In 2025, August was the busiest month (30,950 arrivals), followed by July (27,000) and December (26,430), while February was the quietest (16,540).
What share of Australia's visitors come from Hong Kong?
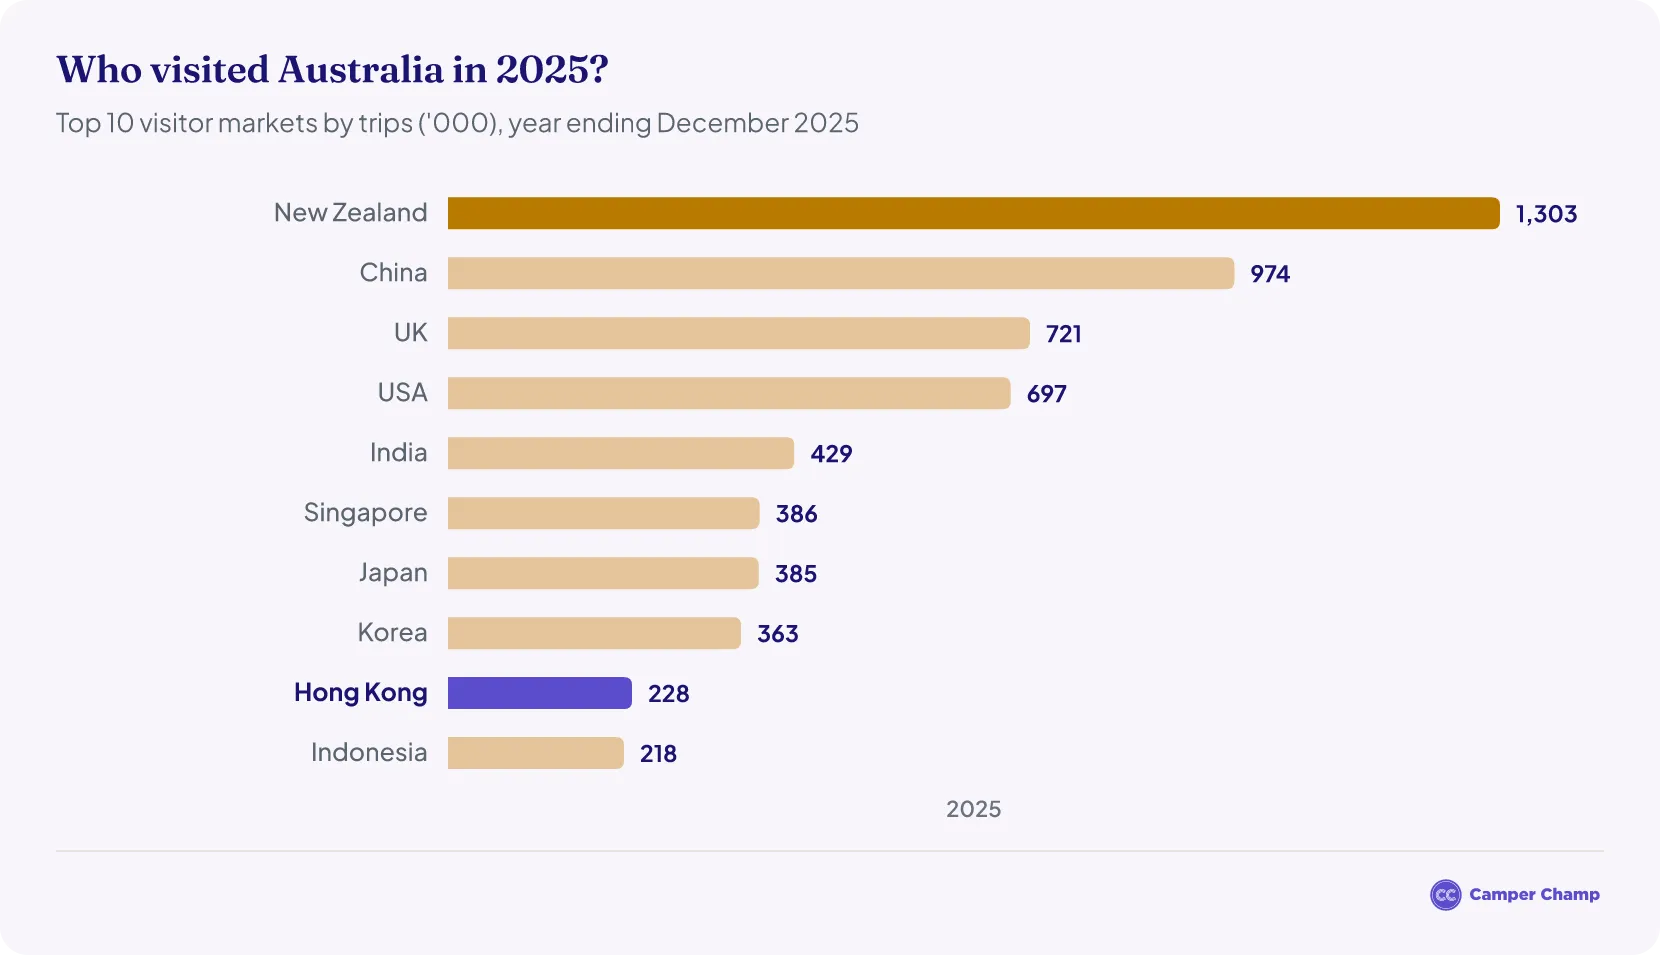
- Hong Kong contributed 2.8% of all international visitor trips to Australia in 2025.1
- That made Hong Kong the 9th-largest source of visitors, behind New Zealand, China, the United Kingdom, the United States, India, Singapore, Japan and South Korea.1
- Visitor numbers from Hong Kong grew by 14.8% in 2025, faster than the 8.4% growth across all international visitors.1
How much did tourists from Hong Kong spend in Australia in 2025?
Hong Kong visitors spent about $1.52 billion on trips to Australia in 2025.1
| Tourism Spending by Hong Kong Visitors in Australia — Year Ending December ($) | ||
|---|---|---|
| Year | Spend in Australia | Total Trip Spend |
| 2019 | 1.02 B5 | 1.39 B5 |
| 2020 | – | 0.32 B6 |
| 2021 | 0.03 B10 | 0.04 B6 |
| 2022 | 0.26 B7 | 0.36 B7 |
| 2023 | 0.85 B8 | 1.15 B8 |
| 2024 | 0.87 B8 | 1.23 B8 |
| 2025 | 1.13 B1 | 1.52 B1 |
Source · Note: “Spend in Australia” is spending within Australia, while “Total Trip Spend” includes all trip expenses, including those outside Australia such as international flights and pre-trip costs. Spend in Australia is not available for 2020; Tourism Research Australia's results for that year give total trip spend only.
What share of international visitor spending comes from Hong Kong?
How long do Hong Kong tourists stay in Australia?
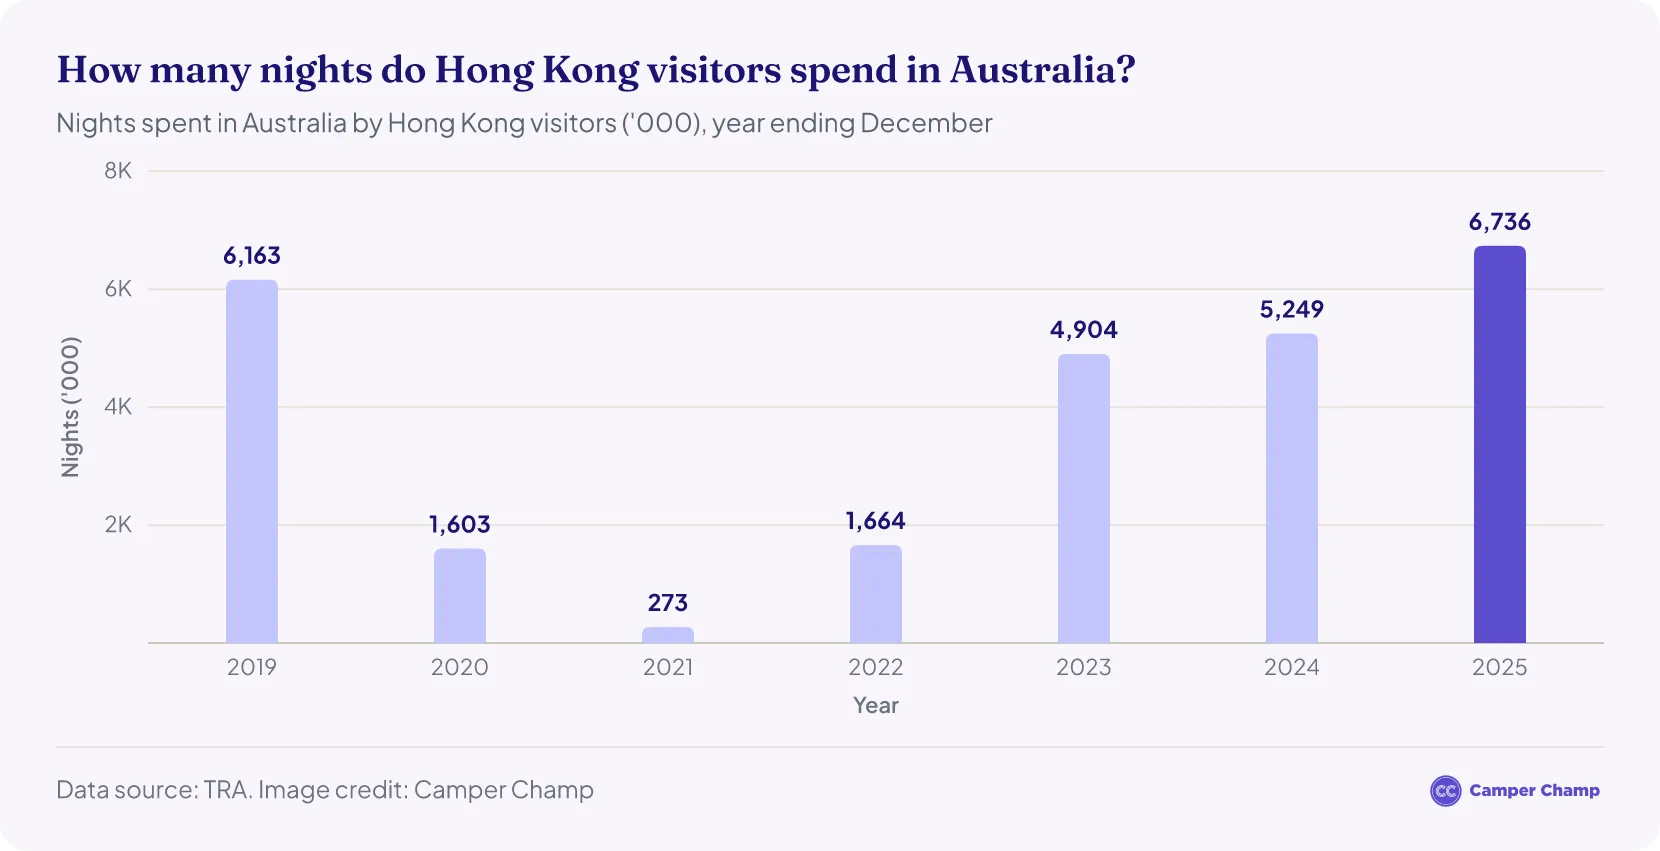
Hong Kong visitors spent 6.74 million nights in Australia in 2025, up 28.3% on 2024 and 9.3% above the 6.16 million nights in 2019.51
- That is about 29.5 nights per trip, up from 26.4 nights in 2024 and 21.6 nights in 2019.5
- The average is long because visitors who come to study or for other reasons stay about 100 nights, far longer than holiday visitors (about 11 nights).11
- In the year ending June 2026, Hong Kong visitors spent 6.72 million nights in Australia, up 25.2% on the year before.2
Why do Hong Kong tourists visit Australia?
Holidays are the most common reason Hong Kong residents travel to Australia, followed closely by visiting friends and relatives.11
- About 106,000 visits a year were holidays, averaging 11 nights in Australia.11
- About 82,000 were to visit friends and relatives, averaging 17 nights.11
- About 15,000 were business trips, averaging 6 nights.11
- About 27,000 were for other reasons, including study, averaging 100 nights.11
These figures are an annual average over the two years ending June 2024 and June 2025, from Tourism Research Australia's International Visitor Survey.11
What do Hong Kong tourists do in Australia?
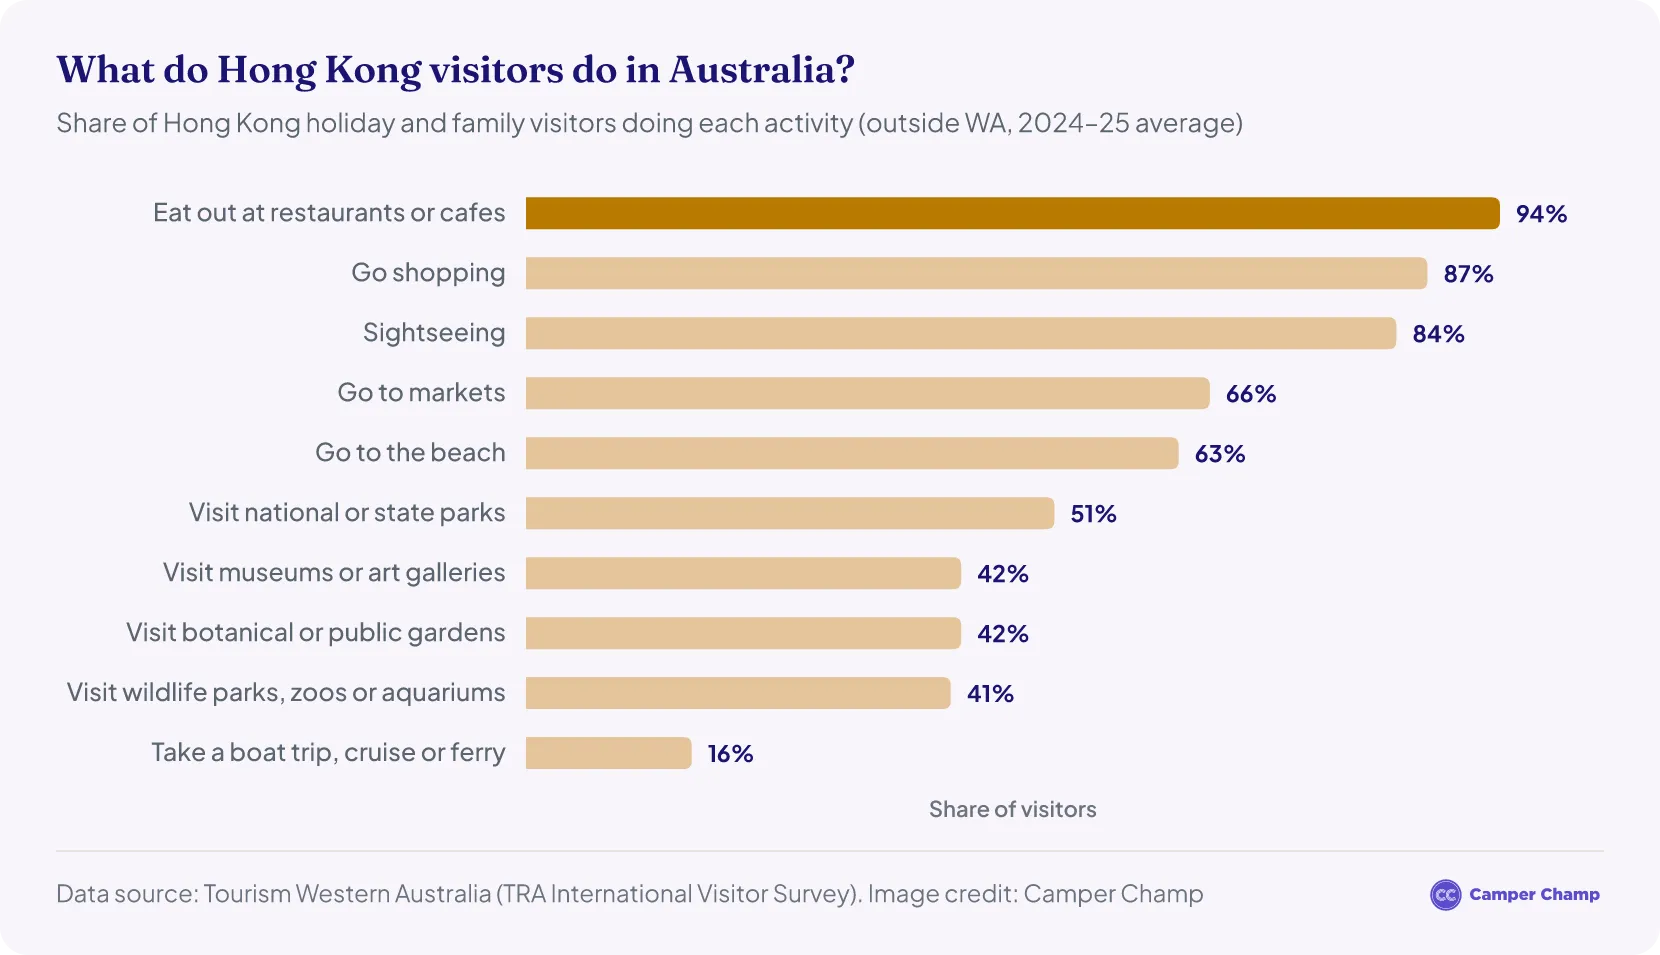
Food, shopping and sightseeing top the list. Among Hong Kong holiday and family visitors to Australia outside Western Australia, 94% eat out at restaurants or cafes, 87% go shopping and 84% go sightseeing.4
- 63% go to the beach and about half (51%) visit a national or state park.4
- 91% travel independently rather than on a group tour, and only 8% arrive on a travel package.4
- 65% are on a return visit to Australia.4
- 60% stay in hotels, resorts or motels, and two in three (66%) visit only one state.4
- Among Hong Kong travellers thinking about a future trip to Australia, Sydney (67%), the Gold Coast (55%) and Melbourne (50%) are the most considered destinations.4
These are two-year averages for 2024 and 2025 and cover holiday and family trips only. The survey sample is small, so read them as a rough guide.
Which states do Hong Kong tourists visit?
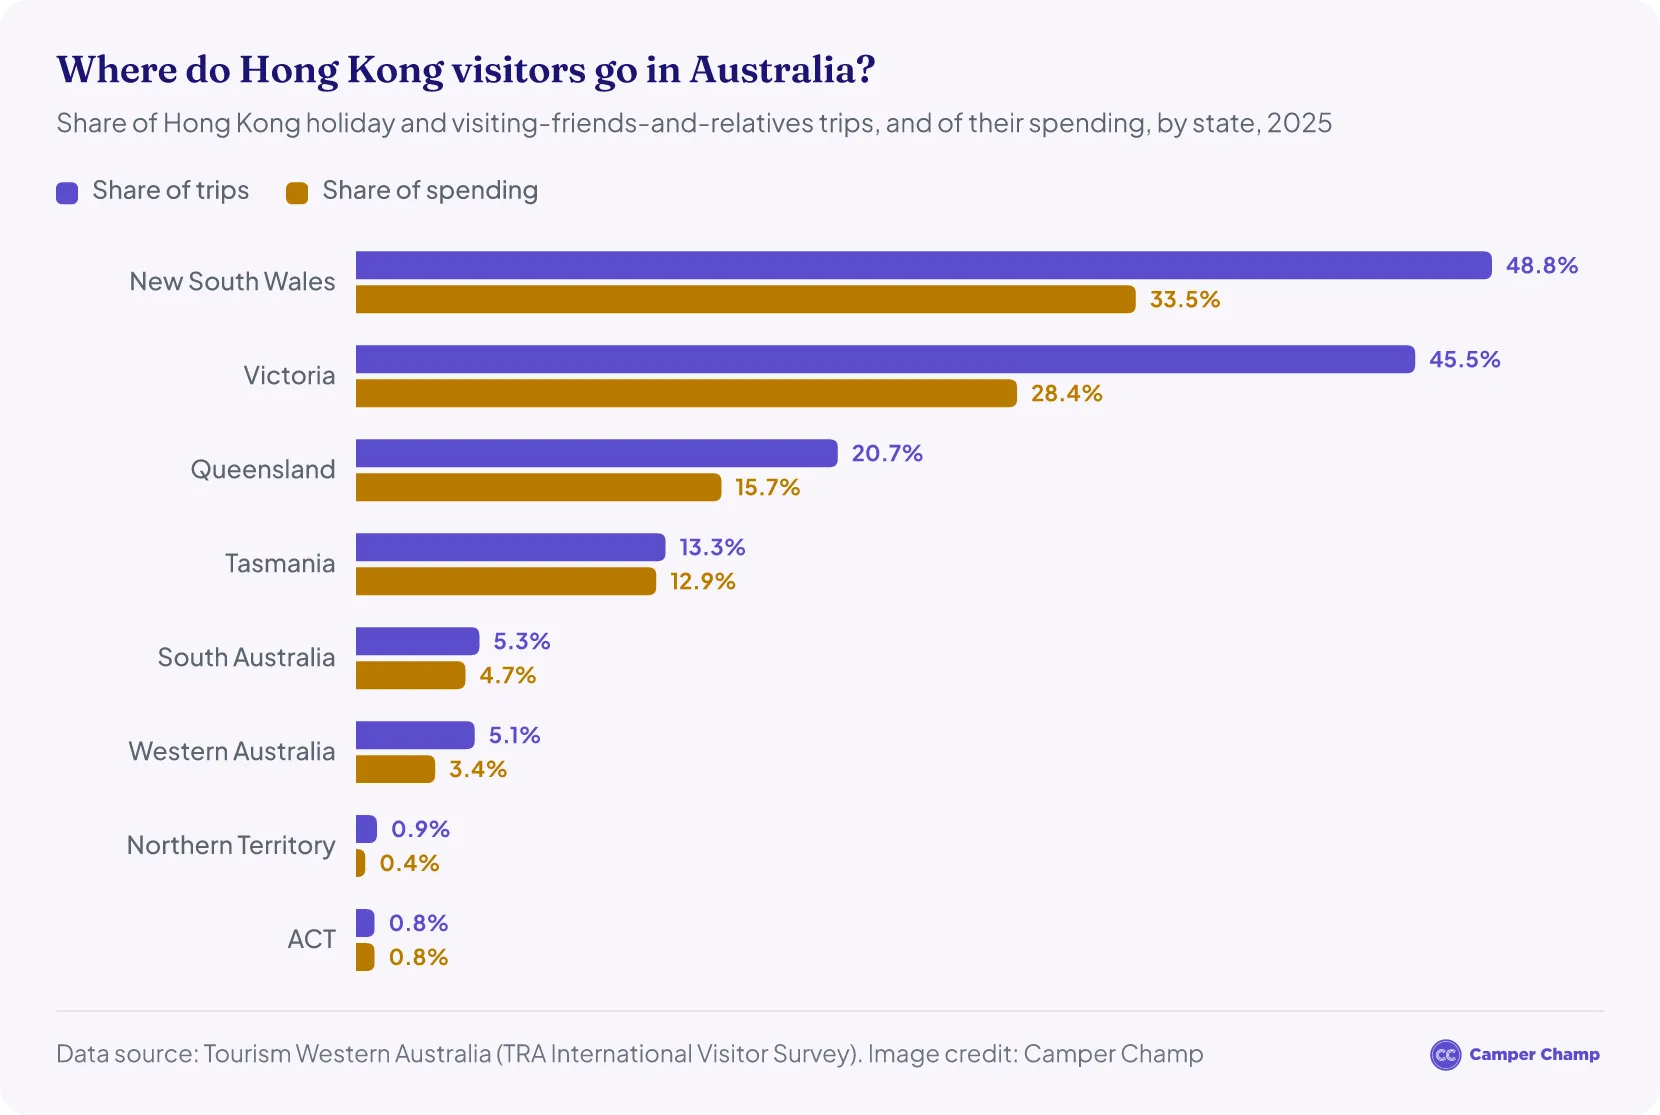
New South Wales and Victoria are the most visited states, each featuring on nearly half of all Hong Kong holiday and family trips in 2025.4
- New South Wales: 48.8% of trips (33.5% of spending)4
- Victoria: 45.5% (28.4%)4
- Queensland: 20.7% (15.7%)4
- Tasmania: 13.3% (12.9%)4
- South Australia: 5.3% (4.7%)4
- Western Australia: 5.1% (3.4%)4
- Northern Territory: 0.9% (0.4%)4
- ACT: 0.8% (0.8%)4
The shares add up to more than 100% because visitors who travel to several states are counted in each one. They cover holiday and visiting-friends-and-relatives trips only and come from a small survey sample, so treat them as a guide.4
Border arrivals tell a similar story. This is where the 26,430 short-term visitors who arrived from Hong Kong in August 2026 planned to stay:
- New South Wales: 11,060 (42%)9
- Victoria: 7,950 (30%)9
- Queensland: 3,760 (14%)9
- Western Australia: 2,260 (9%)9
- Tasmania: 650 (2%)9
- South Australia: 520 (2%)9
- ACT: 190 (0.7%)9
Hong Kong was not among the Northern Territory's top 10 sources that month, so no figure is published for it.9
Do Hong Kong tourists go camping in Australia?
There is no national count of Hong Kong visitors who hire campervans or stay in caravan parks: the caravan industry's latest national report, the 2026 edition, covers domestic travellers only.12 What data there is suggests camping is a small niche, though many Hong Kong visitors do head outdoors.
- Nine in ten (91%) travel independently rather than on a tour, and about half (51%) visit a national or state park.4
- Most stay in hotels: 60% of Hong Kong leisure visitors outside Western Australia stay in a hotel, resort or motel.4
- South Australia's tourism commission reports growing interest among Hong Kong visitors in self-drive journeys to regional areas.11
- Hong Kong was not among the top three international markets for caravan and camping in New South Wales in 2025: those were the UK, Germany and New Zealand.13
- Tasmania welcomed 28,400 Hong Kong visitors in the year ending March 2026. They stayed 335,500 nights and spent $111.7 million there, making Hong Kong Tasmania's highest-spending international market.14
Campervan hire in Australia
- Adelaide motorhome hire
- Broome
- Cairns motorhome hire
- Campervan hire in Alice Springs
- Campervan hire in Brisbane
- Campervan hire in Darwin
- Campervan hire in Devonport
- Campervan hire in Melbourne
- Campervan hire in Sydney
- Gold Coast
- Hobart campervan rental
- Launceston motorhome hire
- Perth campervan rental
- Tasmania campervan rental
Other Resources
- Australia Tourism Statistics
- Chinese Tourism in Australia Statistics
- Indian Tourism in Australia Statistics
- Japanese Tourism in Australia Statistics
- Malaysia Tourism in Australia Statistics
- New Zealand Tourism in Australia Statistics
- Singapore Tourism in Australia Statistics
- South Korea Tourism in Australia Statistics
- UK Tourism in Australia Statistics
- USA Tourism in Australia Statistics
References
- International tourism results — year ending December 2025 (International Visitor Survey) · Tourism Research Australia ↑ b c d e f g h i j k l m n o p q r s t u
- International tourism results — year ending June 2026 (International Visitor Survey) · Tourism Research Australia ↑ b c d e
- Overseas Arrivals and Departures, Australia, August 2026 — Table 5: Short-term visitors arriving, selected countries of residence (original) · Australian Bureau of Statistics ↑ b c d e f g h i j k l m n o p q r s t u v w x y z a2 b2 c2 d2 e2 f2
- Hong Kong Market Profile 2025 (Tourism Western Australia) · assets-us-01.kc-usercontent.com ↑ b c d e f g h i j k l m n o p q r s
- IVS results for the year ending December 2024 compared to December 2019 · Tourism Research Australia ↑ b c d e f g
- International Visitor Survey tourism results — year ending December 2021 compared with 2020 (Tourism Research Australia) · Tourism Research Australia ↑ b c d
- International Visitor Survey tourism results — year ending December 2023 compared with 2022 (Tourism Research Australia) · Tourism Research Australia ↑ b c
- IVS results for the year ending December 2024 compared to December 2023 · Tourism Research Australia ↑ b c d e
- Overseas Arrivals and Departures, Australia, August 2026 · Australian Bureau of Statistics ↑ b c d e f g h i
- International Visitor Survey tourism results — year ending December 2022 compared with 2021 (Tourism Research Australia) · Tourism Research Australia ↑
- International Market Update 2025: Hong Kong (South Australian Tourism Commission) · tourism.sa.gov.au ↑ b c d e f g h
- Caravan and Camping State of Industry 2026 (Caravan Industry Association of Australia) · caravanindustry.com.au ↑
- NSW Government media release: NSW number one for caravan and camping trips · nsw.gov.au ↑
- Tourism Tasmania, international visitor profile, year ending March 2026 · tourismtasmania.com.au ↑
- TRA — International tourism results, Australia, March 2024 · Tourism Research Australia