

Updated
At a Glance
- Over 385,000 Singaporean visitors travelled to Australia in 2025, up 6.9% on 20241.
- Singaporean arrivals are up 0.6% in 2026 so far: 279,980 from January to August, against 278,310 a year earlier2.
- The 2025 total was still 7.4% below the pre-pandemic level of 417,000 in 20193.
- Singapore was Australia's 6th-largest international visitor market in 2025, with 4.7% of all visitor trips1.
- Singaporean visitors spent $1.65 billion on their trips in 2025, including $1.12 billion within Australia — 2.9% of all international visitor spending1.
- 60% came for a holiday, compared with 43% of all international visitors4.
- Singaporean visitors stayed an average of 15 nights per trip, well under the 38-night average for all international visitors1.
How many Singaporean tourists visit Australia each year?
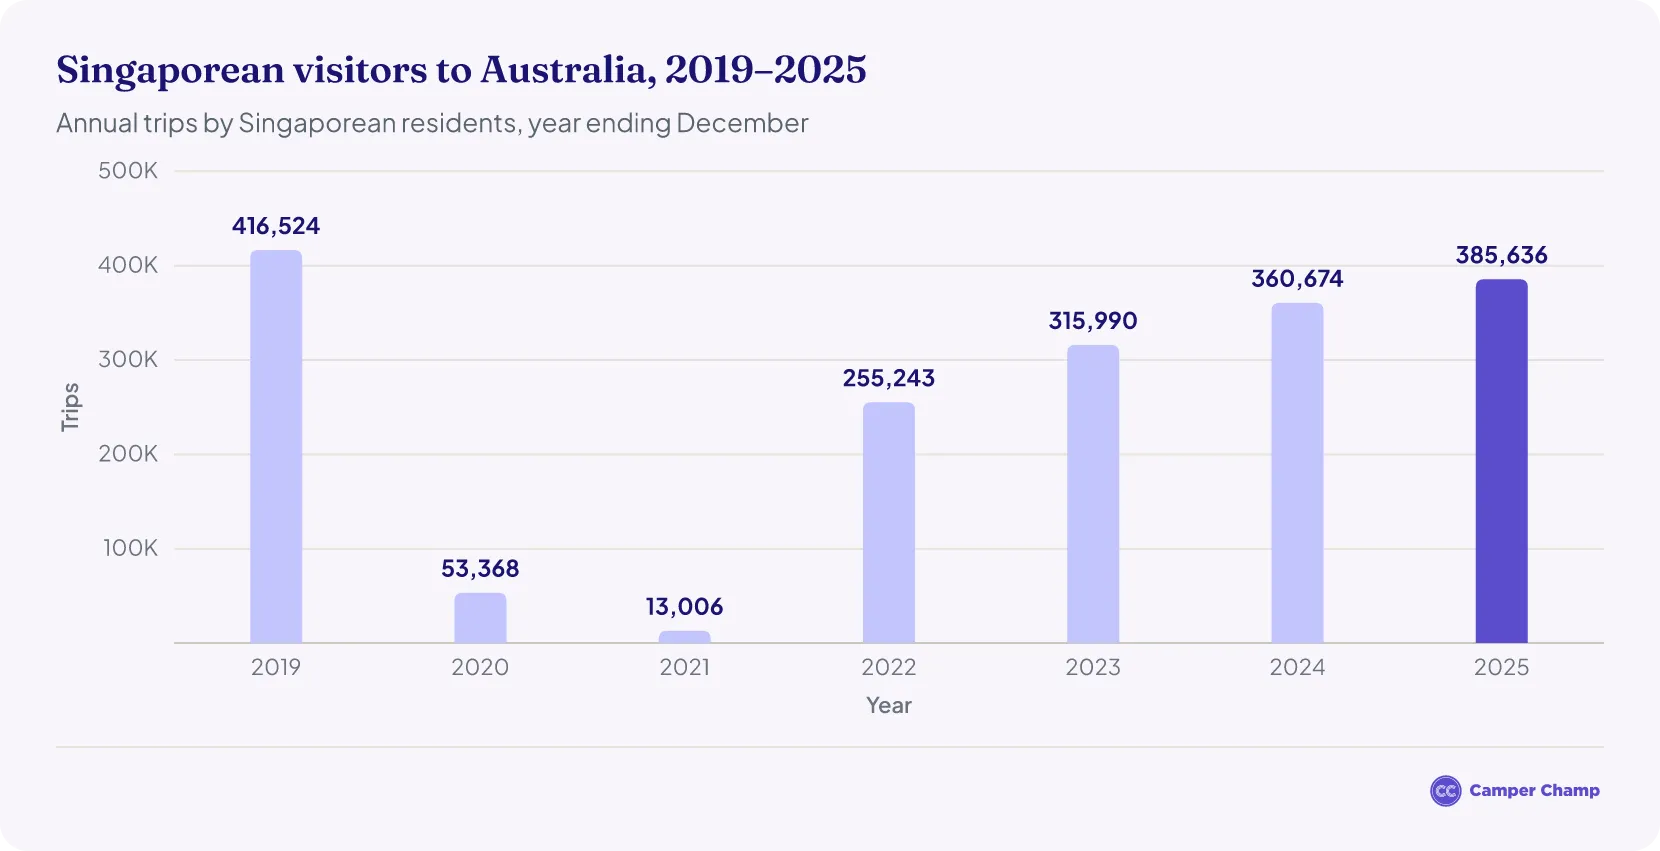
How many Singaporeans have visited Australia so far in 2026?
279,980 short-term visitor arrivals from Singapore were recorded from January to August 2026, 0.6% more than the 278,310 in the same months of 20252.
- June was the busiest month so far, with 54,260 arrivals, and January the quietest, with 14,0202.
- In August 2026, 42,910 Singaporeans arrived, up 2.9% on August 20252.
- February had the biggest rise, up 35.1%, while January had the biggest fall, down 15.1%2.
- In 2025 the busiest months were June (60,860 arrivals) and December (45,410)2.
In the 12 months to June 2026, over 391,000 Singaporean visitors came to Australia5, up 7.9% on the previous 12 months (over 363,000).
The table below compares each month with 2025. These are Australian Bureau of Statistics counts of every short-term arrival, of any age, so they run higher than Tourism Research Australia's figures for visitors aged 15 and over.
Latest available: August 2026. September figures are due on 12 November 2026.
| Short-term visitor arrivals from Singapore by month, 2025 and 2026 | |||
|---|---|---|---|
| Month | 2025 | 2026 | Change |
| January | 16,510 | 14,020 | -15.1% |
| February | 21,840 | 29,510 | +35.1% |
| March | 33,940 | 33,330 | -1.8% |
| April | 26,070 | 27,290 | +4.7% |
| May | 43,100 | 48,510 | +12.6% |
| June | 60,860 | 54,260 | -10.8% |
| July | 34,300 | 30,150 | -12.1% |
| August | 41,690 | 42,910 | +2.9% |
| September | 39,590 | – | – |
| October | 37,440 | – | – |
| November | 42,960 | – | – |
| December | 45,410 | – | – |
| January to August | 278,310 | 279,9802 | +0.6% |
Source · Australian Bureau of Statistics, Overseas Arrivals and Departures, Australia, August 2026 (short-term visitors arriving, original series). Counts are arrivals, so a person who visits twice is counted twice. 2026 figures for September to December are not yet released.
Singaporean visitors to Australia by year, 2015–2025
443,710 short-term visitor arrivals from Singapore were recorded in 2025, up 6.2% on 20242.
- Arrivals grew every year from 2015 to 2019, when they reached a record 478,5002.
- They fell to 58,320 in 2020 and just 15,830 in 20212, while Australia's border was closed during the pandemic.
- Numbers have risen every year since, and in 2025 were back to 93% of the 2019 record2.
These are Australian Bureau of Statistics arrival counts, so they run higher than the Tourism Research Australia visitor figures at the top of the page.
| Short-term visitor arrivals from Singapore by calendar year, 2015–2025 | ||
|---|---|---|
| Year | Singaporean visitor arrivals | Change on previous year |
| 2015 | 387,150 | +6.7% |
| 2016 | 429,760 | +11.0% |
| 2017 | 432,970 | +0.7% |
| 2018 | 447,980 | +3.5% |
| 2019 | 478,500 | +6.8% |
| 2020 | 58,320 | -87.8% |
| 2021 | 15,830 | -72.9% |
| 2022 | 295,800 | +1,768.6% |
| 2023 | 364,010 | +23.1% |
| 2024 | 417,900 | +14.8% |
| 2025 | 443,7102 | +6.2% |
Source · Australian Bureau of Statistics, Overseas Arrivals and Departures, Australia, August 2026 (short-term visitors arriving, original series), totalled January to December. Counts are arrivals, so a person who visits twice is counted twice.
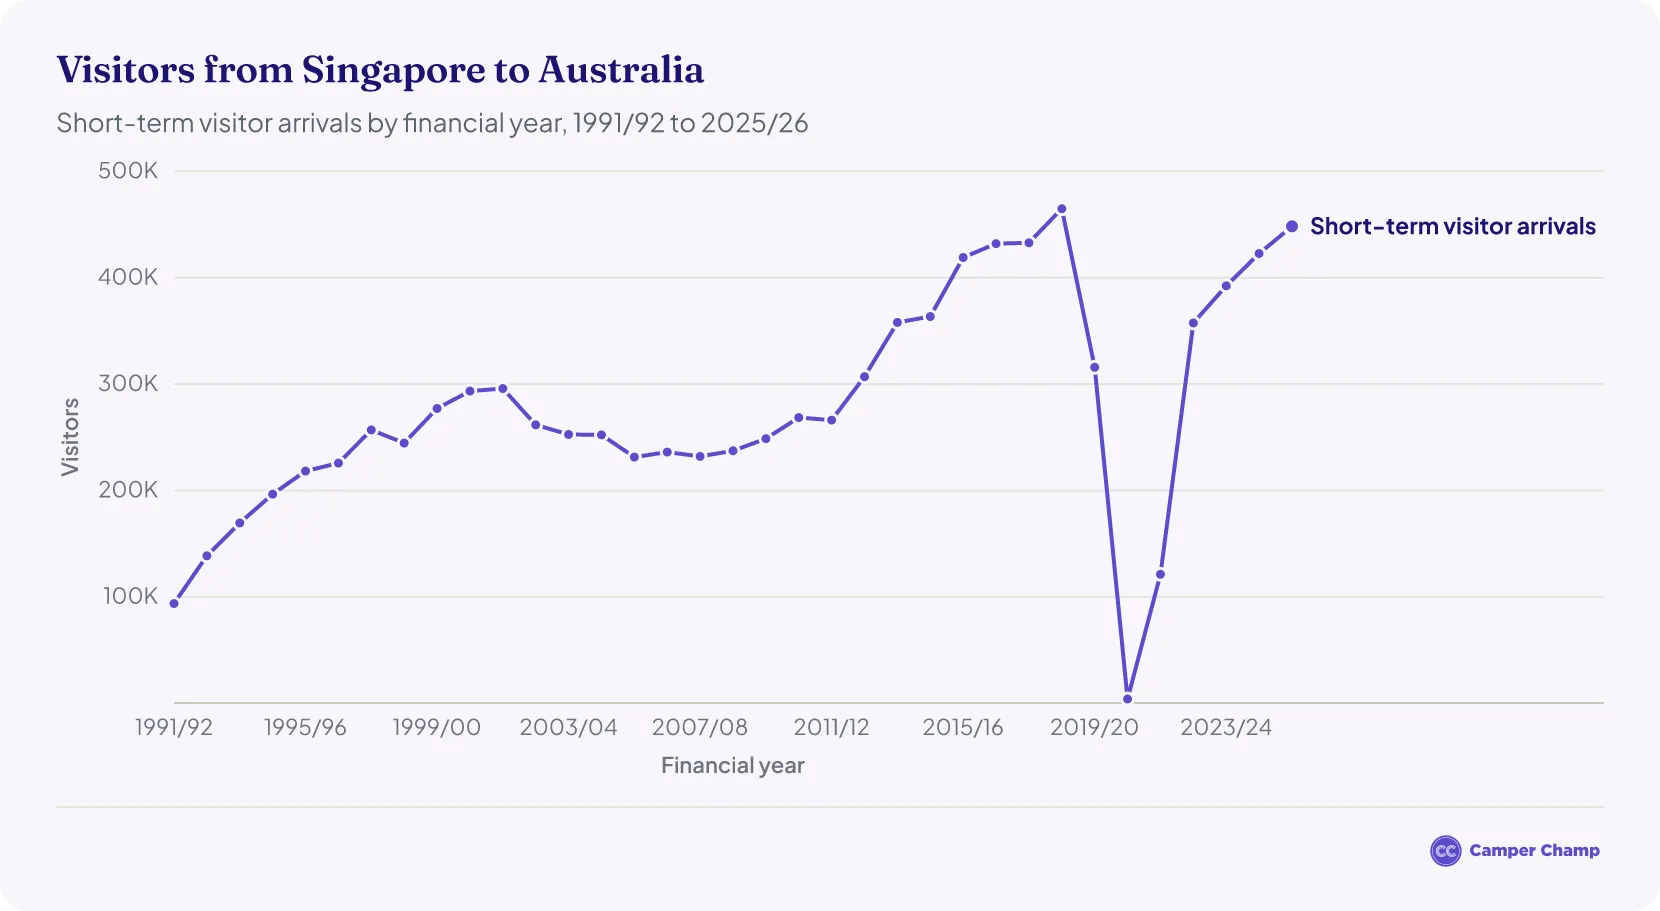
The chart below goes further back, using financial years (July to June). Arrivals from Singapore grew from 93,610 in 1991/92 to a record 464,850 in 2018/192. They collapsed to just 3,860 in 2020/21 when the borders closed for COVID-19, and in 2025/26 were back to 96% of the 2018/19 record.
How much did Singaporean tourists spend in Australia in 2025?
Singaporean visitors spent approximately $1.65 billion during trips to Australia in 2025 (year ending December)1.
- In 2025, spending within Australia by Singaporean visitors rose 3.1%, from $1.09 billion in 2024 to $1.12 billion1. Total trip spending also rose 4.2%, from $1.58 billion to $1.65 billion.
- Spending within Australia was 2.1% higher than the 2019 level of $1.1 billion3. Total trip spending in 2025 also exceeded the 2019 figure of $1.53 billion by 7.8%.
- Singapore ranked 8th among all visitor markets for total trip spending in 20251.
How much have Singaporean visitors spent in 2026?
In the 12 months to June 2026, Singaporean visitors spent about $1.66 billion on their trips, including $1.16 billion within Australia5. That was 2.9% more than the year before, when they spent about $1.61 billion.
Average spend per Singaporean visitor
Each Singaporean visitor spent an average of $2,910 in Australia4 in 2025, or about $4,270 per trip1 once flights and other costs paid outside Australia are included.
- Per night, Singaporean visitors spent about $189 in Australia, well above the $125 average for all international visitors1.
- They stayed 5.95 million nights in Australia in 2025, up from 5.45 million in 20241.
- Their spending in Australia per visitor is still below the $4,740 average for all international visitors, because their trips are much shorter: 15 nights, against 381.
The per-trip and per-night figures divide Tourism Research Australia's 2025 spending totals by its trip and night counts.
| Spending by Singaporean visitors to Australia | ||
|---|---|---|
| Year | Spend in Australia | Total trip spend |
| 2019 | 1.10 B3 | 1.53 B3 |
| 2020 | – | 0.24 B6 |
| 2021 | 0.09 B7 | 0.14 B7 |
| 2022 | 0.77 B7 | 1.11 B7 |
| 2023 | 1.18 B8 | 1.66 B8 |
| 2024 | 1.09 B8 | 1.58 B8 |
| 2025 | 1.12 B1 | 1.65 B1 |
Source · Note: “Spend in Australia” counts only money spent in Australia. “Total trip spend” also covers costs paid outside Australia, such as international flights and pre-trip costs.
Where does Singapore rank among Australia's visitor markets?
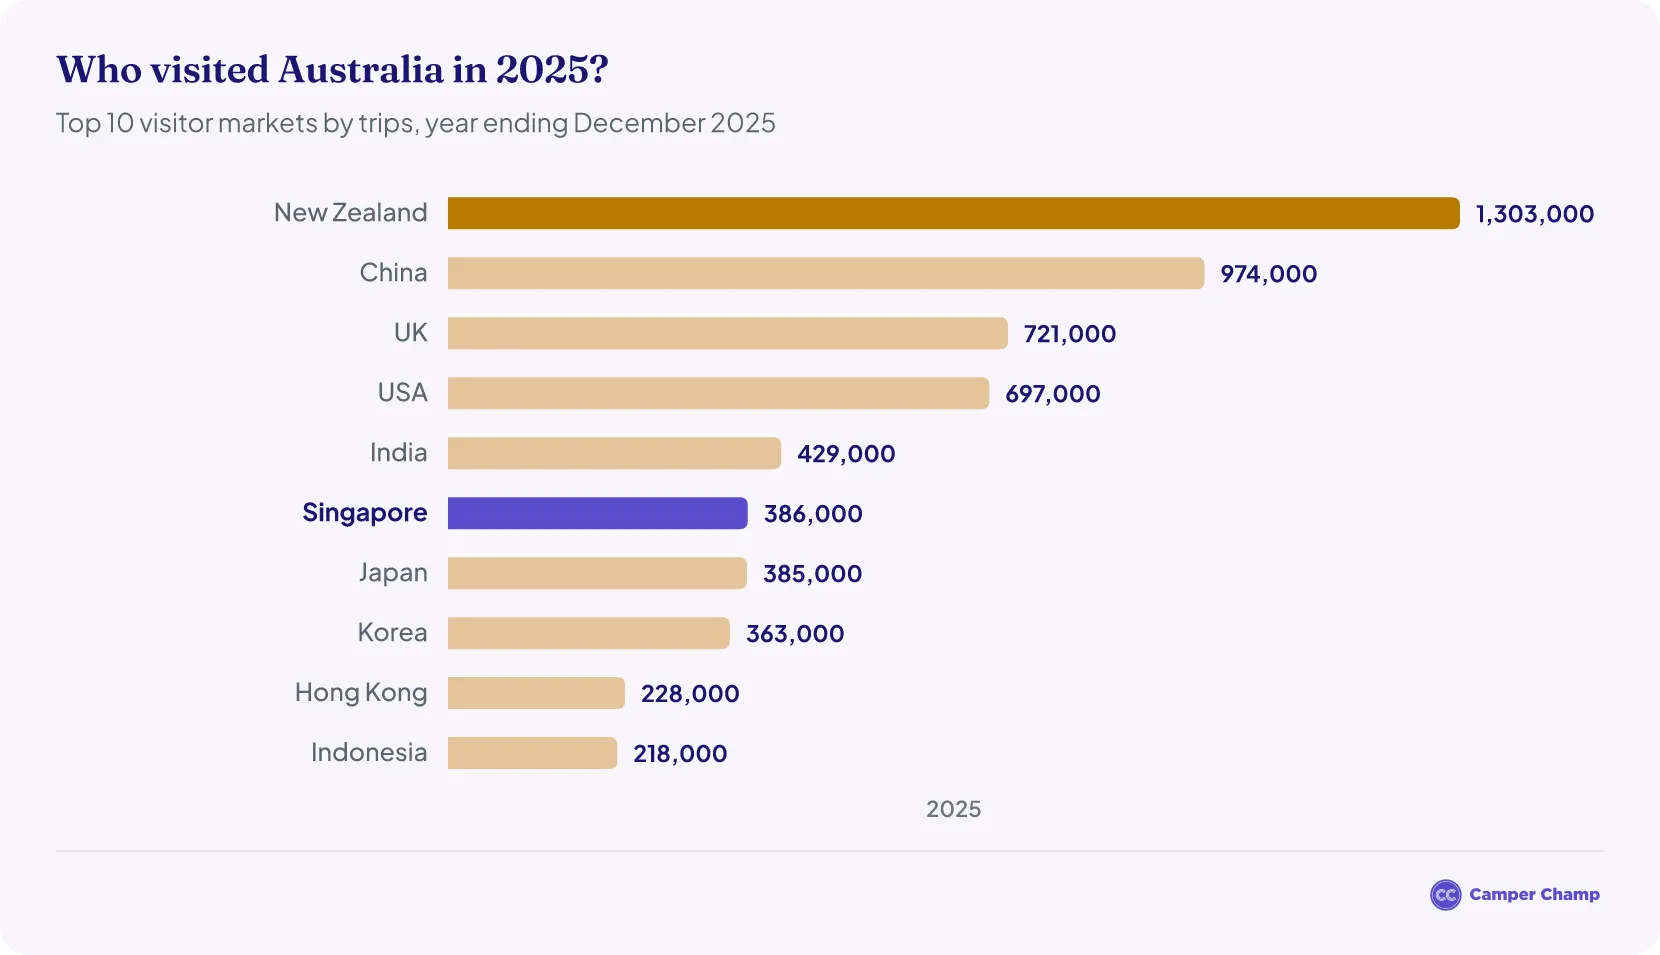
Singapore was Australia's 6th-largest international visitor market in 2025, with 386,000 trips, or 4.7% of all international visitor trips1.
- Singaporean visitors' $1.12 billion of spending in Australia was 2.9% of all international visitor spending, the 9th-highest of any country1. Their total trip spend of $1.65 billion ranked 8th, at 3.0% of the total.
- Chinese tourists were the top spenders, at $11.25 billion1.
- Singapore sent slightly more visitors than Japan and South Korea, but fewer than New Zealand, China, the United Kingdom, the United States and India.
The table below shows the 10 countries that sent the most visitors to Australia in 2025.
| Australia's top 10 international visitor markets, 2025 | |||
|---|---|---|---|
| Rank | Country | Trips | Spend in Australia |
| 1 | New Zealand | 1,303,000 | $2.41 billion |
| 2 | China | 974,000 | $11.25 billion |
| 3 | United Kingdom | 721,000 | $2.87 billion |
| 4 | United States | 697,000 | $2.40 billion |
| 5 | India | 429,000 | $1.83 billion |
| 6 | Singapore | 386,0001 | $1.12 billion |
| 7 | Japan | 385,000 | $1.62 billion |
| 8 | South Korea | 363,000 | $1.44 billion |
| 9 | Hong Kong | 228,000 | $1.13 billion |
| 10 | Indonesia | 218,000 | $0.98 billion |
Source · Tourism Research Australia, International Visitor Survey, year ending December 2025. Trips are by visitors aged 15 and over, rounded to the nearest thousand. Spend in Australia excludes international flights and other costs paid outside Australia.
Why do Singaporeans travel to Australia?
Six in ten Singaporean visitors (60%) came to Australia for a holiday in 2025, compared with 43% of all international visitors4.
- Visiting friends and relatives: 21% of Singaporean visitors (all visitors: 34%)
- Business: 14% (all visitors: 9%)
- Education: 3% (all visitors: 7%)
- Employment: 1% (all visitors: 4%)
- Other reasons: 1% (all visitors: 3%)4
43% travelled alone, fewer than the 54% of all international visitors, while 40% came with a group of family or friends (all visitors: 23%)4.
Tourism Research Australia expects visitors from Singapore to reach 524,000 a year by 20304. It notes that many come for a holiday and are more likely than the average international visitor to go to Western Australia.
More visitor statistics for Australia
- Australia Tourism Statistics
- Chinese Tourism in Australia Statistics
- Hong Kong Tourism in Australia Statistics
- Indian Tourism in Australia Statistics
- Japanese Tourism in Australia Statistics
- Malaysia Tourism in Australia Statistics
- New Zealand Tourism in Australia Statistics
- South Korea Tourism in Australia Statistics
- UK Tourism in Australia Statistics
- USA Tourism in Australia Statistics
How long do Singaporean tourists stay in Australia?
- On average, Singaporean visitors stayed 15 nights per trip in 2025, well under the 38-night average for all international visitors1.
- Just over half (52%) stayed a week or less, against 34% of all international visitors4.
- 31% stayed 8 to 14 nights, and only 8% stayed a month or more (all visitors: 25%)4.
Travel between Singapore and Australia
- Over 392,600 Australians visited Singapore in 20254.
- Singaporean residents made about 443,700 visits to Australia in the same year, so about 51,100 more trips went from Singapore to Australia than the other way4.
- Direct flights between the two countries were 88% full in 2024–25, still above pre-pandemic levels even as airlines added seats4.
Where do Singaporean tourists go in Australia?
Victoria and Western Australia are the states Singaporean visitors go to most: 35% went to Victoria in 2025 and 33% to Western Australia, well over twice the 13% of all international visitors who go there4. New South Wales came third (27%), although it is the most visited state for all international visitors (50%).
- Queensland: 12% of Singaporean visitors (all visitors: 29%)
- South Australia: 4% (all visitors: 5%)
- Tasmania: 4% (all visitors: 3%)
- Northern Territory: 1% (all visitors: 3%)
- Australian Capital Territory: 1% (all visitors: 2%)4
Many visitors go to more than one state, so these shares add up to more than 100%.
98% of Singaporean visitors went to a capital city or the Gold Coast, against 92% of all international visitors. Only 20% went anywhere else in Australia, against 29% of all visitors4.
Why do so many Singaporeans visit Perth and Western Australia?
Western Australia is a favourite with Singaporean visitors. 33% of them went there in 2025, against 13% of all international visitors4.
- More leisure trips than ever: Singaporeans on holiday or visiting friends and relatives made 111,100 trips to Western Australia in 2025, up 13.7% on 2024 and above the 91,400 in 20199. They spent $181 million in the state.
- Almost level with Victoria: Western Australia had 35.5% of Singapore's leisure trips to Australia, just behind Victoria (36.1%) and well ahead of New South Wales (23.7%)9.
- Perth and the South West: 98% of these visitors spent time in Perth and 28% went on to the South West, home to Margaret River9.
- Short, repeat trips: they stayed 8 nights on average in Western Australia, against 13 nights in the rest of Australia, and 85% had been to Australia before9.
- Families, nature and wine: 48% travelled as a family group, against 21% elsewhere in Australia9. 69% visited national or state parks and 35% went to wineries, against 51% and 16% elsewhere.
Tourism Western Australia puts the state's pull down to strong flight connections and a shared time zone with Singapore10. If you're planning a road trip from Perth, see campervan hire in Perth.
What do Singaporean tourists do in Australia?
Most Singaporean visitors spend their time eating out, shopping and sightseeing. In 2025, 92% ate out at restaurants or cafés, 79% went shopping and 78% went sightseeing4.
- Markets: 55% visited markets, more than the 46% of all international visitors4.
- Beaches: 55% went to the beach, fewer than the 63% of all international visitors4.
- Nature and wildlife: 47% visited national or state parks (all visitors: 45%) and 36% went to wildlife parks, zoos or aquariums (all visitors: 34%)4.
- Gardens: 42% visited botanical or other public gardens, the same as all international visitors4.
- Culture: 31% visited museums or art galleries (all visitors: 35%) and 29% historic sites (all visitors: 30%)4.
Three in four (75%) had been to Australia before, compared with 59% of all international visitors4. 95% rated their trip 7 out of 10 or higher.
How much does it cost to hire a campervan in Australia?
Hiring a campervan in Australia typically costs $152 to $197 a day, depending on where you pick it up. The figures come from Camper Champ's own checks of supplier quotes for a 7-day budget or mid-range hire, collected in the week to 1 November 2026. All prices are in Australian dollars.
- Cheapest pick-up cities: Brisbane ($152 a day), Sydney ($153) and Melbourne ($158).
- Most expensive: Hobart ($197 a day) and Darwin ($187).
- Cheapest time to hire: June, when rates in most cities fall to between $131 and $169 a day. June is also the month most Singaporeans visit.
- Most expensive time: October 2027 in most cities, at $189 to $209 a day, and January in Hobart ($228). These months are quoted up to a year ahead, so prices may change.
- Best deals: offers start at about $70 a day in Adelaide, Sydney, Brisbane and Cairns.
Driving with a Singapore licence: you can drive in Australia on an overseas licence for up to three months, as long as it is in English11. If it isn't, you'll need an International Driving Permit, which you must get before you leave home. Australians drive on the left, the same side of the road as in Singapore.
The table below shows the typical daily rate and the cheapest and dearest months for eight pick-up cities.
| Campervan hire prices in Australia by pick-up city | |||
|---|---|---|---|
| Pick-up city | Typical daily rate | Cheapest month | Most expensive month |
| Sydney | $153 | June 2027 ($131) | October 2027 ($193) |
| Melbourne | $158 | June 2027 ($137) | October 2027 ($196) |
| Brisbane | $152 | June 2027 ($133) | October 2027 ($190) |
| Cairns | $160 | June 2027 ($131) | October 2027 ($189) |
| Adelaide | $166 | March 2027 ($141) | October 2027 ($209) |
| Perth | $176 | June 2027 ($156) | October 2027 ($203) |
| Darwin | $187 | June 2027 ($167) | October 2027 ($206) |
| Hobart | $197 | June 2027 ($169) | January 2027 ($228) |
Source · Camper Champ price checks of supplier quotes for a 7-day budget or mid-range campervan hire, collected in the week to 1 November 2026. Daily rates in AUD; the typical rate is the average across the next 12 pick-up months. Brisbane had no vans available for January 2027.
Campervan hire in Australia
- Alice Springs
- Brisbane
- Broome motorhome hire
- Cairns campervan rental
- Campervan hire in Adelaide
- Campervan hire in Perth
- Campervan hire in Sydney
- Campervan hire in Tasmania
- Darwin
- Devonport campervan rental
- Gold Coast campervan rental
- Hobart motorhome hire
- Launceston campervan rental
- Melbourne
FAQs
Do Singaporeans need a visa to visit Australia?
Yes, but it's quick to get. Singapore passport holders can apply for an Electronic Travel Authority (ETA) in the Australian ETA app12. There is an A$20 service charge, and most applications are decided straight away. An ETA lets you visit as often as you like in a 12-month period and stay up to 3 months each time.
Has Singaporean travel to Australia recovered since COVID-19?
Almost. The 386,000 Singaporean visitors in 2025 were 7.4% fewer than the 417,000 who came in 20193. Their total trip spending of $1.65 billion was already 7.8% above the 2019 figure of $1.53 billion.
Are Singaporean tourists spending more in Australia?
Yes. The number of Singaporean visitors rose 6.9% in 2025, and their spending within Australia rose 3.1% to $1.12 billion. Their total trip spending, which also covers flights and other costs paid at home, rose 4.2% to $1.65 billion1.
When do most Singaporeans visit Australia?
Singaporean arrivals peak in June and December. In 2025, 60,860 Singaporeans arrived in June and 45,410 in December, while January (16,510) and February (21,840) were the quietest months. In 2026 so far, June has been the busiest month, with 54,260 arrivals2. June is also the cheapest month to hire a campervan in most Australian cities.
Which state do Singaporean tourists visit most?
Victoria. 35% of Singaporean visitors went there in 2025, just ahead of Western Australia (33%) and New South Wales (27%). Across all international visitors, New South Wales is the most visited state, and only 13% go to Western Australia4.
How long do Singaporean tourists stay in Australia?
About 15 nights on average in 2025, less than half the 38-night average for all international visitors. Just over half (52%) stayed a week or less4.
References
- International tourism results — year ending December 2025 (International Visitor Survey) · Tourism Research Australia ↑ b c d e f g h i j k l m n o p q r s t u v
- Overseas Arrivals and Departures, Australia, August 2026 — Table 5: Short-term visitors arriving, selected countries of residence (original) · Australian Bureau of Statistics ↑ b c d e f g h i j k l m n o
- IVS results for the year ending December 2024 compared to December 2019 · Tourism Research Australia ↑ b c d e f
- Visitor economy profile 2025 — Market: Singapore (Tourism Research Australia) · Tourism Research Australia ↑ b c d e f g h i j k l m n o p q r s t u v w x
- International tourism results — year ending June 2026 (International Visitor Survey) · Tourism Research Australia ↑ b
- International Visitor Survey tourism results — year ending December 2021 compared with 2020 (Tourism Research Australia) · Tourism Research Australia ↑
- International Visitor Survey tourism results — year ending December 2022 compared with 2021 (Tourism Research Australia) · Tourism Research Australia ↑ b c d
- IVS results for the year ending December 2024 compared to December 2023 · Tourism Research Australia ↑ b c d
- Singapore market profile 2025 (Tourism Western Australia) · assets-us-01.kc-usercontent.com ↑ b c d e
- Singapore — international markets (Tourism Western Australia) · tourism.wa.gov.au ↑
- Driving in Australia (Tourism Australia, australia.com) · australia.com ↑
- Electronic Travel Authority (subclass 601) (Department of Home Affairs) · immi.homeaffairs.gov.au ↑
- TRA — International tourism results, Australia, March 2024 · Tourism Research Australia