

Updated
At a Glance
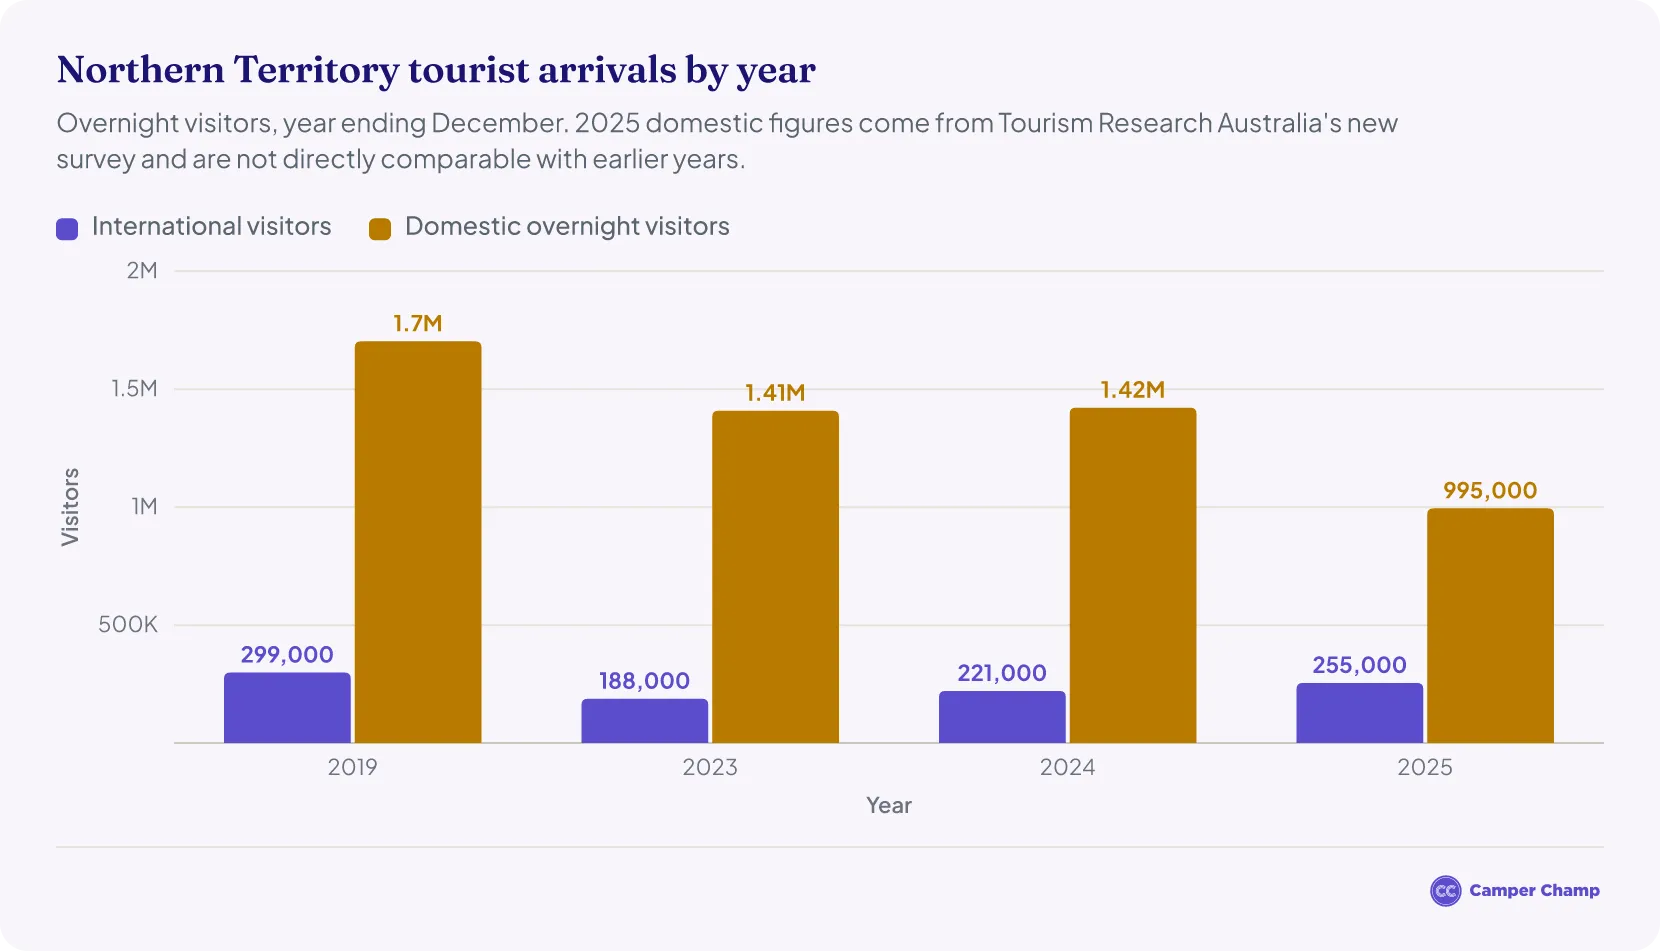
- 1.25 million tourist trips were made to the Northern Territory in 2025: 995,000 domestic overnight trips1 and 255,000 international trips2.
- So far in 2026 (January–June), tourists made about 532,000 trips to the Territory3 and spent about A$1.01 billion4.
- Australians also made about 1.22 million day trips in the Territory in 20251.
- Overnight visitors spent about A$2.25 billion in 2025: A$1.73 billion by domestic visitors1 and A$527 million by international visitors2.
- Greater Darwin is the most visited region, with about 881,000 overnight visitors a year (2022–2024 average)5.
- Interstate visitors made 617,000 overnight trips in 2025, up 26.5% on 20246.
- Domestic overnight visitors stayed about 4.3 nights on average1.
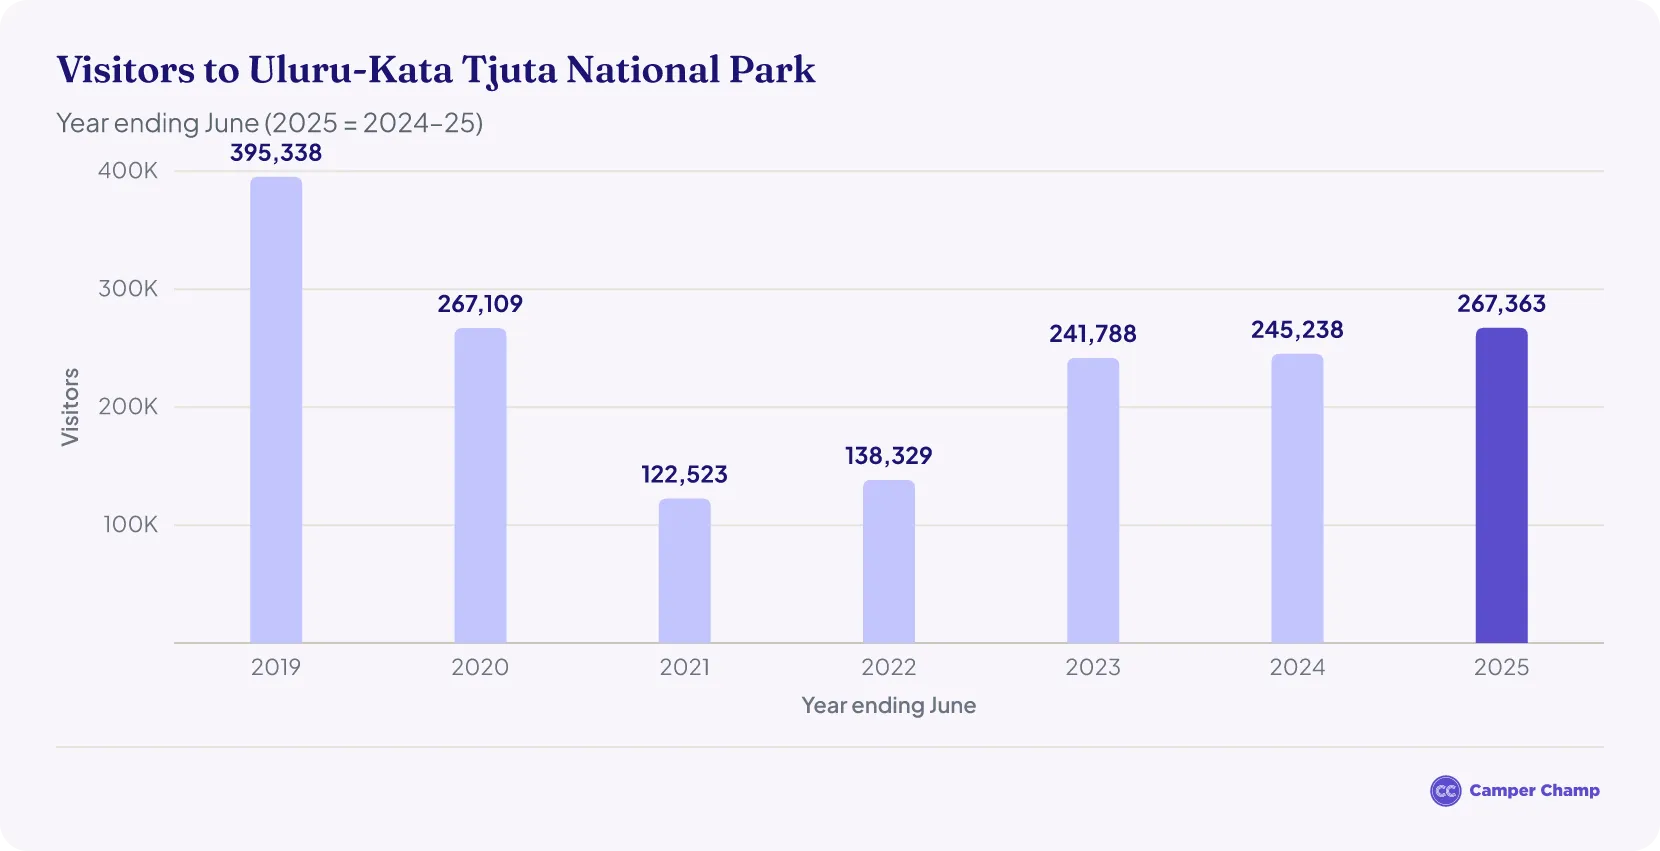
- Uluru-Kata Tjuta National Park had 267,363 visitors in 2024–257.
- Litchfield National Park was the busiest Territory-run national park, with about 280,100 visitors in 20258.
How many tourists visit the Northern Territory each year?
Tourists made about 1.25 million trips to the Northern Territory in 2025 (year ending December), counting both Australian and international travellers.
- Australians made about 995,000 overnight trips to the Territory1, while international visitors made about 255,000 trips, up 15% on 2024 (221,000)2.
- Earlier years look higher because they come from the old National Visitor Survey, which counted about 1.42 million domestic overnight trips in 2024. Tourism Research Australia replaced that survey with its new Domestic Tourism Statistics in January 20259. The two series are not directly comparable, so the lower 2025 total does not mean fewer people visited.
How many tourists have visited the Northern Territory in 2026?
Tourists made about 532,000 trips to the Northern Territory3 in the first six months of 2026 (January to June), down 3% on the same months of 202510. They spent about A$1.01 billion, up 12%4.
- Australians made 444,000 overnight trips3, down 2% on 453,000 a year earlier10, and spent about A$770 million3, up 9%10.
- International visitors made about 87,500 trips11, down 7% on 94,3004, but spent about A$239 million, up 26%11.
- Australians also made about 665,000 day trips in the Territory3, up 8%10.
- The dry-season June quarter was much busier than the wet-season March quarter, with 276,000 domestic overnight trips against 168,0003.
- These are the latest figures available, from Tourism Research Australia's June quarter 2026 releases. The 2026 totals add the March and June quarters together.
| Overseas visitors to the Northern Territory by month | |||
|---|---|---|---|
| Month | 2026 | 2025 | Change |
| January | 3,290 | 2,580 | +28% |
| February | 4,450 | 2,910 | +53% |
| March | 5,460 | 4,490 | +22% |
| April | 4,290 | 3,970 | +8% |
| May | 5,450 | 4,840 | +13% |
| June | 5,510 | 7,090 | −22% |
| July | 7,330 | 8,900 | −18% |
| August | 6,940 | 6,520 | +6% |
| January–August | 42,720 | 41,300 | +3% |
Source · Data source: Australian Bureau of Statistics, Overseas Arrivals and Departures, Australia, August 2026 (Table 11).
How much do tourists spend in the Northern Territory?
Overnight visitors spent about A$2.25 billion in the Northern Territory in the year ending December 2025.
- This included about A$1.73 billion from domestic overnight travellers1 and about A$527 million from international visitors, up 12% on 2024 (A$468 million)2.
- In 2024, tourists spent about A$2.95 billion (A$2.48 billion domestic and A$468 million international), around 14% higher than in 2019 (about A$2.59 billion).
- As with trip numbers, 2025 domestic spending comes from the new Domestic Tourism Statistics, so it is not directly comparable with earlier years.
| Visitor spending in the Northern Territory | ||
|---|---|---|
| Year | International | Domestic |
| 2019 | A$0.44 B | A$2.15 B |
| 2023 | A$0.46 B | A$2.50 B |
| 2024 | A$0.47 B2 | A$2.48 B |
| 2025 | A$0.53 B2 | A$1.73 B1 |
How important is tourism to the Northern Territory's economy?
Tourism directly contributed about A$1.2 billion to the Northern Territory economy in 2023–24, or 3.8% of gross state product6.
- The industry directly employed about 7,970 people, or 5.1% of the Territory's workforce6. Including indirect jobs, tourism supported 16,958 jobs.
- These are the latest figures from Tourism Research Australia's state tourism satellite accounts, published by the Northern Territory Government.
How many day trips are made in the Northern Territory?
Australians made about 1.22 million domestic day trips in the Northern Territory in 2025 and spent about A$261 million on them1. Together with overnight trips, that makes about 2.21 million domestic trips and about A$1.99 billion in domestic visitor spending.
- 2025 is the first full year of Tourism Research Australia's new Domestic Tourism Statistics, so there is no like-for-like 2024 figure for day trips.
How long do tourists stay in the Northern Territory?
- Domestic overnight visitors spent about 4.23 million nights in the Northern Territory in 2025, an average of about 4.3 nights per trip1.
- International visitors spent 4.42 million nights in the Territory, down 4.1% on 2024 even though more of them came, an average stay of 17.4 nights2.
- Visitors to Greater Darwin stay longest, at about 7.5 nights on average across 2022–20245, compared with 4.9 nights in Alice Springs and the MacDonnell Ranges13. In the Uluru (Lasseter) region, the 2020–2024 average was 4.2 nights14.
Where do NT visitors come from?
Interstate visitors made 617,000 overnight trips to the Northern Territory in 2025, up 26.5% on 2024. New South Wales, Victoria and Queensland were the largest interstate markets6. Territorians travelling within the Territory made the rest of the 995,000 domestic overnight trips.
- International visitors made about 255,000 trips, up 15.1% on 20242. About 143,000 international visitors stayed in Darwin and 150,000 in regional parts of the Territory; many visited both.
- In Greater Darwin, the United Kingdom is the largest international market, ahead of the United States and New Zealand (2022–2024 average)5.
When is the best time to visit the NT?
Most tourists visit the Northern Territory during the mid-year dry season. Australians made about 328,000 overnight trips to the Territory in the September quarter of 2025 and spent 1.58 million nights there, more than in any other quarter1. The June quarter was next, with 276,000 trips, while the March quarter, in the wet season, was the quietest, with 178,000.
- Day trips peaked earlier, in the June quarter, at about 351,0001.
- For weather and events, see when is the best time of year to visit Darwin.
| Northern Territory domestic tourism by quarter | |||
|---|---|---|---|
| Quarter (2025) | Overnight trips | Visitor nights | Day trips |
| March quarter | 178,000 | 709,000 | 264,000 |
| June quarter | 276,000 | 1.10 million | 351,000 |
| September quarter | 328,000 | 1.58 million | 329,000 |
| December quarter | 214,000 | 842,000 | 276,000 |
Source · Data source: Tourism Research Australia, Domestic Tourism Statistics (December quarter 2025 release).
| Northern Territory visitor numbers by year | |||||
|---|---|---|---|---|---|
| Year | Period | Total visitors | International visitors | Domestic overnight visitors | Visitor spending |
| 2026 (so far) | January–June 2026 | 532,000 | 87,500114 | 444,0003 | A$1.01 billion |
| 2025 | Year ending December 2025 | 1.25 million | 255,0002 | 995,0001 | A$2.25 billion |
| 2024 | Year ending December 2024 | 1.64 million | 221,0002 | 1.42 million | A$2.95 billion |
| 2023 | Year ending June 2023 | 1.64 million | 150,00015 | 1.49 million16 | A$3.02 billion |
| 2022 | Year ending September 2022 | 1.46 million | 43,91317 | 1.41 million18 | A$2.61 billion |
| 2021 | Year ending September 2021 | 1.33 million | 4,18917 | 1.33 million18 | A$1.88 billion |
| 2020 | Year ending June 2020 | 1.6 million | 233,00019 | 1.3 million20 | A$1.9 billion |
| 2019 | Year ending June 2019 | 1.9 million | 294,00019 | 1.65 million20 | A$2.5 billion |
Source · Data source: Tourism Research Australia (International Visitor Survey, National Visitor Survey and Domestic Tourism Statistics).
What are the most visited places in the Northern Territory?
Greater Darwin is the most visited region in the Northern Territory (more on Darwin below). Alice Springs and the MacDonnell Ranges came second, with about 325,000 overnight visitors a year13, followed by Katherine Daly with 286,00021.
- The Uluru (Lasseter) region drew the second-most international visitors (47,000 a year) and had the highest spend per trip, at about A$1,50914.
- These regional figures are averages over several years because single-year samples are small; Tourism NT has not yet published 2025 regional reports.
| Most visited regions in the Northern Territory | ||||||
|---|---|---|---|---|---|---|
| Rank | Region | Overnight visitors a year | Domestic | International | Visitor spending a year | Years averaged |
| 1 | Greater Darwin5 | 881,000 | 785,000 | 96,000 | A$1.3 billion | 2022–2024 |
| 2 | Alice Springs MacDonnell13 | 325,000 | 286,000 | 40,000 | A$341 million | 2022–2024 |
| 3 | Katherine Daly21 | 286,000 | 276,000 | 9,000 | A$222 million | 2020–2024 |
| 4 | Lasseter (Uluru)14 | 209,000 | 162,000 | 47,000 | A$316 million | 2020–2024 |
| 5 | Kakadu Arnhem22 | 169,000 | 162,000 | 8,000 | A$146 million | 2020–2024 |
| 6 | Barkly23 | 71,000 | 67,000 | 4,000 | A$36 million | 2020–2024 |
Source · Data source: Tourism NT regional reports, year ending December 2024 (Tourism Research Australia National and International Visitor Surveys).
How many tourists visit Darwin each year?
- About 881,000 overnight visitors a year travelled to Greater Darwin across 2022–2024: 785,000 domestic and 96,000 international, spending about A$1.3 billion5.
- In 2025, about 143,000 international visitors stayed in Darwin, up from 126,000 in 20242.
- Holidays are the main reason to visit (430,000 visitors a year), followed by business (222,000)5.
- Read more: Darwin Tourism Statistics
How many tourists visit Uluru each year?
- Uluru drew 267,363 visitors in 2024–25 (year ending June 2025), up 9.0% on 2023–24 (245,238)7.
- Visitation is still about a third below the 2018–19 peak of 395,33824, the last full year before the Uluru climb closed in October 2019.
- Visitor numbers fell to 122,523 in 2020–21 during the pandemic7 and have risen every year since.
How many tourists visit Kakadu each year?
- Kakadu National Park had 176,230 visitors in 2024–25 (year ending June 2025), down 5.6% on 2023–24 (186,737)7.
- The busiest year in the park's latest annual report was 2022–23, with 191,601 visitors7.
- The wider Kakadu Arnhem tourism region had about 169,000 overnight visitors a year across 2020–202422.
- Counts come from the park's entry gates, and Territorians do not need a park pass, so Territory visitors are under-counted7.
How many tourists visit Alice Springs each year?
- About 325,000 overnight visitors a year travelled to Alice Springs and the MacDonnell Ranges across 2022–2024: 286,000 domestic and 40,000 international13.
- The Alice Springs Telegraph Station Historical Reserve had about 197,800 visitors in 2025, up from 142,900 in 2024, and Tjoritja / West MacDonnell National Park about 137,3008.
How much do visitors spend in Alice Springs?
- Visitors spent about A$341 million a year in the region, or about A$1,050 per trip (2022–2024 average)13.
How long do visitors stay in Alice Springs?
- Visitors stayed 4.9 nights on average, adding up to about 1.6 million visitor nights a year (2022–2024 average)13.
More tourism statistics
- Bondi Beach Tourism Statistics
- Byron Bay Tourism Statistics
- Cradle Mountain Tourism Statistics
- Darwin Tourism Statistics
- Queensland Tourism Statistics
- South Australia Tourism Statistics
- Sunshine Coast Tourism Statistics
- Sydney Opera House Tourism Statistics
- Tasmania Tourism Statistics
- Warner Bros. Movie World Tourism Statistics
- Western Australia Tourism Statistics
- Whitsundays Tourism Statistics
How many people camp in the Northern Territory?
Australians took about 236,000 caravan and camping trips in the Northern Territory in 2024 and spent about 992,000 nights there25. They spent about A$935 per trip, more than caravanners and campers in any other state or territory.
- Parks and reserves: visits to the 22 parks and reserves Parks and Wildlife NT reports on rose to about 3.36 million in 2025, from 3.19 million in 20248.
- Caravan and camping figures are for 2024, the latest year in the Caravan Industry Association's public State of Industry report. See also our Australia camping statistics.
What are the most visited national parks in the Northern Territory?
Litchfield National Park was the most visited national park managed by Parks and Wildlife NT in 2025, with about 280,100 visitors. Nitmiluk National Park (Katherine Gorge) was next with 251,200, followed by Watarrka National Park (Kings Canyon) with 208,9008.
- Most visited reserve: Casuarina Coastal Reserve in Darwin had about 1.42 million visits, the most of any park or reserve on the list8.
- Biggest jump: visits to Arltunga Historical Reserve, east of Alice Springs, nearly quadrupled to 41,800, from 10,800 in 20248.
- Biggest fall: Elsey National Park, home to the Mataranka thermal pools, dropped to 146,800 visits, from 201,600 in 20248.
- Planning a road trip between these parks? See campervan hire in Darwin and Alice Springs.
| Most visited parks and reserves in the Northern Territory | ||||
|---|---|---|---|---|
| Rank | Park or reserve | Region | 2025 visitors | 2024 visitors |
| 1 | Casuarina Coastal Reserve | Darwin | 1,422,200 | 1,346,000 |
| 2 | Litchfield National Park | Darwin | 280,100 | 244,200 |
| 3 | Nitmiluk National Park | Katherine | 251,200 | 259,800 |
| 4 | Watarrka National Park (Kings Canyon) | Alice Springs | 208,900 | 193,500 |
| 5 | Alice Springs Telegraph Station Historical Reserve | Alice Springs | 197,800 | 142,900 |
| 6 | Berry Springs Nature Reserve | Darwin | 186,600 | 175,800 |
| 7 | Elsey National Park | Katherine | 146,800 | 201,600 |
| 8 | Tjoritja / West MacDonnell National Park | Alice Springs | 137,300 | 145,400 |
| 9 | Howard Springs Nature Park | Darwin | 126,600 | 120,700 |
| 10 | Karlu Karlu (Devils Marbles) Conservation Reserve | Barkly | 110,100 | 98,800 |
Source · Data source: Parks and Wildlife NT park visitor data (Department of Tourism and Hospitality); ranking by Camper Champ.
FAQs
How many cruise ships visit Darwin?
Darwin Port welcomed 113 cruise ships in 2024–256, according to the Northern Territory Government.
How does the Northern Territory compare with other states for tourism?
It is Australia's smallest domestic tourism market, drawing about 0.9% of all domestic overnight visitors in Australia6.
How long do international visitors stay in Darwin?
About 28.5 nights on average across 2022–2024, compared with 5 nights for domestic visitors5.
Campervan hire in Australia
- Adelaide
- Alice Springs
- Brisbane
- Broome motorhome hire
- Campervan hire in Cairns
- Darwin
- Devonport campervan rental
- Gold Coast
- Hobart campervan rental
- Launceston motorhome hire
- Melbourne campervan rental
- Perth
- Sydney
- Tasmania motorhome hire
References
- Domestic Tourism Statistics results — December quarter 2025 (Tourism Research Australia) · Tourism Research Australia ↑ b c d e f g h i j k l m
- International tourism results — year ending December 2025 (International Visitor Survey) · Tourism Research Australia ↑ b c d e f g h i j k l
- Domestic Tourism Statistics results — June quarter 2026 compared to June quarter 2025 (Tourism Research Australia) · Tourism Research Australia ↑ b c d e f g
- International tourism results — year ending June 2026 (International Visitor Survey) · Tourism Research Australia ↑ b c d
- Greater Darwin Tourism Regional Report — year ending December 2024 (Tourism NT) · tourismandeventsnt.com.au ↑ b c d e f g
- Tourism — Northern Territory Economy (industry analysis) · nteconomy.nt.gov.au ↑ b c d e f g
- Director of National Parks Annual Report 2024–25 · dcceew.gov.au ↑ b c d e f
- Parks and Wildlife visitor data — Darwin region (NT Government) · dth.nt.gov.au ↑ b c d e f g h
- Changes to the Australian resident tourism statistics collection in 2025 (Tourism Research Australia) · Tourism Research Australia ↑
- Domestic Tourism Statistics results — March quarter 2026 compared to March quarter 2025 (Tourism Research Australia) · Tourism Research Australia ↑ b c d
- International tourism results — March quarter 2026 (International Visitor Survey) · Tourism Research Australia ↑ b c
- Overseas Arrivals and Departures, Australia, August 2026 — Table 11: Short-term visitors arriving, state of intended stay (ABS) · Australian Bureau of Statistics ↑
- Alice Springs MacDonnell Regional Report, year ending December 2024 (Tourism NT) · tourismandeventsnt.com.au ↑ b c d e f
- Lasseter Regional Report, Year Ending December 2024 · tourismandeventsnt.com.au ↑ b c
- International Visitor Survey results tables, year ending June 2023 compared with June 2022 (Tourism Research Australia) · Tourism Research Australia ↑
- National Visitor Survey results tables, year ending June 2023 compared with June 2022 (Tourism Research Australia) · Tourism Research Australia ↑
- International Visitor Survey results tables, year ending September 2022 compared with September 2021 (Tourism Research Australia) · Tourism Research Australia ↑ b
- National Visitor Survey results tables, year ending September 2022 compared with September 2021 (Tourism Research Australia) · Tourism Research Australia ↑ b
- International Visitor Survey results, year ending June 2020 (Tourism Research Australia) · Tourism Research Australia ↑ b
- National Visitor Survey results, year ending June 2020 (Tourism Research Australia) · Tourism Research Australia ↑ b
- Katherine Daly Regional Report, year ending December 2024 (Tourism NT) · tourismandeventsnt.com.au ↑ b
- Kakadu Arnhem Regional Report, year ending December 2024 (Tourism NT) · tourismandeventsnt.com.au ↑ b
- Barkly Regional Report, year ending December 2024 (Tourism NT) · tourismandeventsnt.com.au ↑
- Tourism Key Figures and Statistics · dcceew.gov.au ↑
- Caravan and Camping State of Industry 2025 (Caravan Industry Association of Australia) · assets.pc.gov.au ↑