

Updated
At a Glance
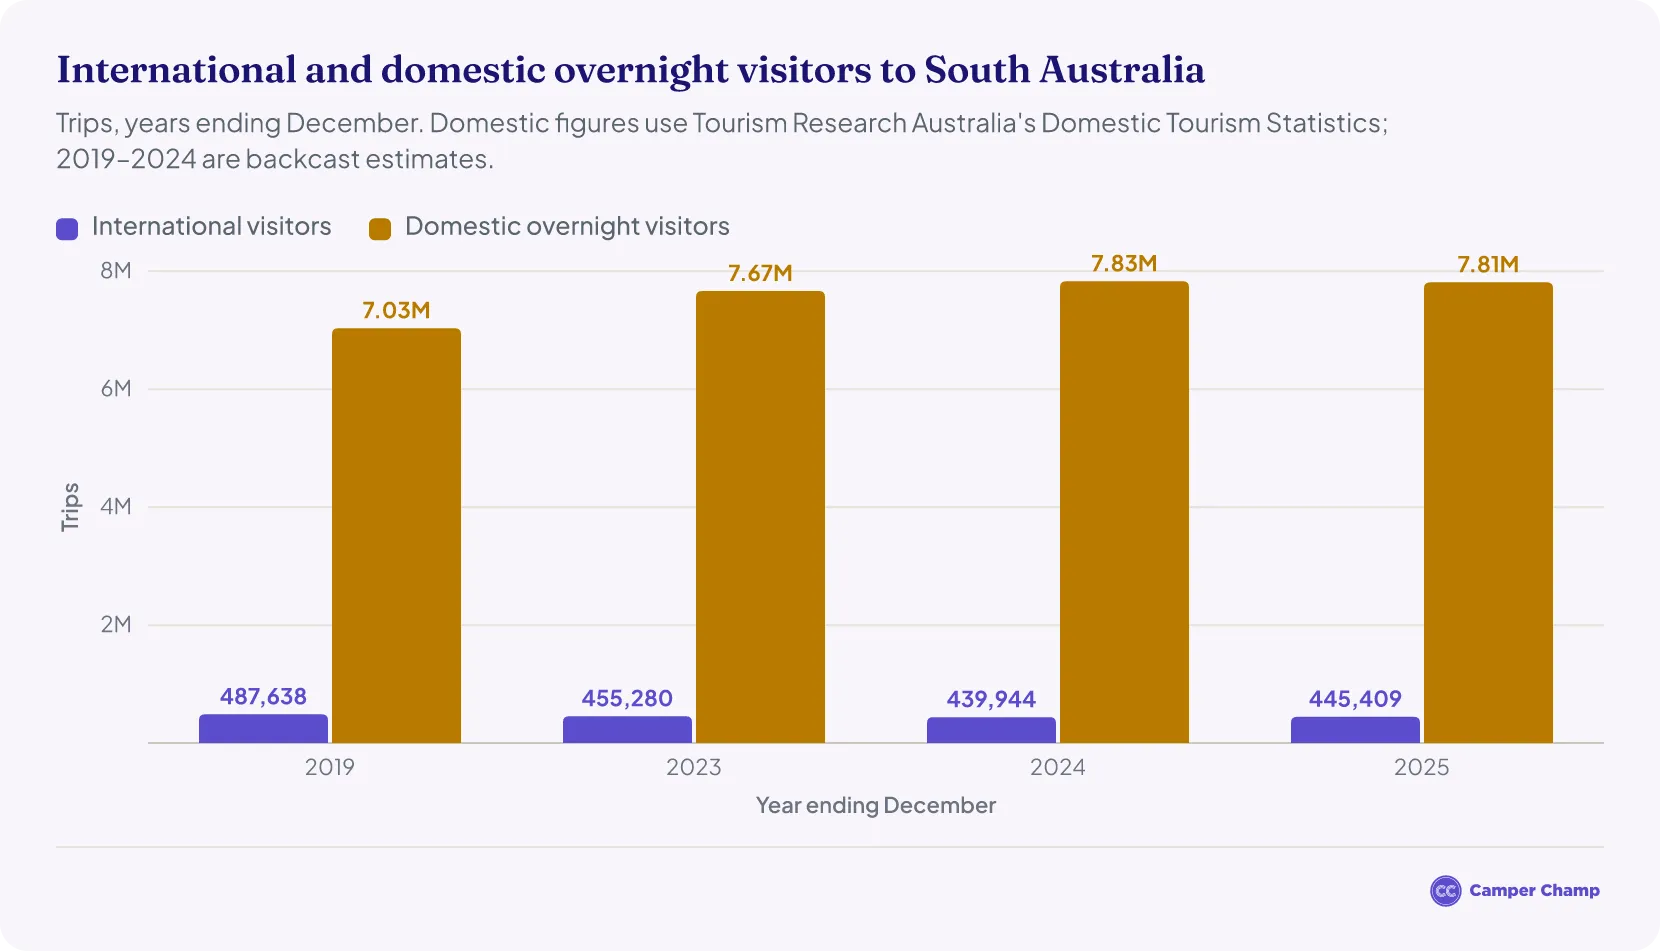
- 8.26 million tourist trips were made to South Australia in 2025: 7.81 million domestic overnight trips1 and 445,000 international trips2.
- So far in 2026 (January–June), tourists made about 4.12 million trips to the state3 and spent about A$4.59 billion4.
- Australians also made about 16.4 million day trips1 in South Australia in 2025.
- Overnight visitors spent about A$8.25 billion in 2025: A$6.49 billion by domestic visitors1 and A$1.76 billion by international visitors2.
- Adelaide is the most visited region, with about 3.61 million overnight visits5 in the year ending June 2026.
- Interstate visitors made 2.13 million overnight trips in 2025, about the same as in 202467.
- Domestic overnight visitors stayed about 3.3 nights on average1.
- Tourism directly contributed A$4.5 billion to the state economy in 2024–25 and supported 69,800 jobs, counting indirect ones8.
- The United Kingdom is the largest international market, with 68,000 visitors in 20259.
How many tourists visit South Australia each year?
Tourists made about 8.26 million trips to South Australia in 2025 (year ending December), not counting about 16.4 million day trips by Australians.
- Of these, about 7.81 million were domestic overnight trips, just 0.2% below the 7.83 million in 20241.
- International visitors made about 445,000 trips in 2025, up 1.2% from about 440,000 in 20242.
Tourism Research Australia replaced its National Visitor Survey with the Domestic Tourism Statistics collection in January 2025, so domestic figures for 2024 and earlier are its backcast estimates on the new basis6.
How many tourists have visited South Australia in 2026?
Tourists made about 4.12 million3 trips to South Australia between January and June 2026, down 3% on the same months of 202510. They spent about A$4.59 billion, up 10%4.
- Australians made 3.91 million overnight trips3, down 3% on 4.01 million a year earlier10, and spent about A$3.80 billion, up 15%3.
- International visitors made about 210,500 trips4, down 1% on 212,50011, and spent about A$790 million, down 9%4.
- Australians also made about 8.43 million day trips in the state, up 6%3.
- The March quarter was busier than the June quarter, with 2.08 million domestic overnight trips against 1.83 million3.
- Figures come from Tourism Research Australia's June quarter 2026 releases, the latest available. The 2026 totals combine the March and June quarters.
| Overseas visitors to South Australia by month | |||
|---|---|---|---|
| Month | 2026 | 2025 | Change |
| January | 21,970 | 21,200 | +4% |
| February | 30,340 | 25,380 | +20% |
| March | 25,340 | 24,250 | +4% |
| April | 20,360 | 19,860 | +3% |
| May | 16,730 | 18,610 | −10% |
| June | 14,180 | 15,680 | −10% |
| July | 19,280 | 21,170 | −9% |
| August | 18,660 | 17,960 | +4% |
| January–August | 166,860 | 164,110 | +2% |
Source · Data source: Australian Bureau of Statistics, Overseas Arrivals and Departures, Australia, August 2026 (Table 11).
How much do tourists spend in South Australia?
Overnight visitors spent about A$8.25 billion in South Australia in the year ending December 2025.
- Domestic overnight visitors spent about A$6.49 billion of this1, and international visitors about A$1.76 billion, up 30.6% from A$1.35 billion in 20242.
- In 2024, overnight visitors spent about A$8.47 billion (A$7.12 billion domestic and A$1.35 billion international)6, around 48% more than in 2019 (about A$5.71 billion13).
- Domestic spending is not directly comparable with earlier years: Tourism Research Australia's new domestic survey began in 2025, and it advises caution when comparing spending with its backcast estimates for 2024 and earlier.
| Visitor spending in South Australia | ||
|---|---|---|
| Year | International | Domestic (overnight) |
| 2019 | A$1.21 B13 | A$4.50 B6 |
| 2023 | A$1.31 B14 | A$7.00 B6 |
| 2024 | A$1.35 B2 | A$7.12 B6 |
| 2025 | A$1.76 B2 | A$6.49 B1 |
Source · Data source: Tourism Research Australia (International Visitor Survey; Domestic Tourism Statistics).
How important is tourism to South Australia's economy?
Tourism directly contributed about A$4.5 billion to the South Australian economy in 2024–258, or 2.9% of gross state product. That contribution was up 2.2% on 2023–24.
- The industry directly employed about 39,200 people, or 3.7% of the state's workforce8. Including indirect jobs, tourism supported 69,800 jobs.
- Counting its indirect effects as well, tourism contributed about A$8.7 billion to the state economy8.
- These are the latest figures from Tourism Research Australia's state tourism satellite accounts, published by the South Australian Tourism Commission.
How many day trips are made in South Australia?
Australians made about 16.4 million domestic day trips in South Australia in 2025 and spent about A$2.79 billion on them1. Together with overnight trips, that makes about 24.2 million domestic trips and about A$9.28 billion in domestic visitor spending.
- 2025 is the first full year of Tourism Research Australia's new Domestic Tourism Statistics, so there is no like-for-like 2024 figure for day trips.
How long do tourists stay in South Australia?
- Domestic overnight visitors spent about 25.6 million nights in South Australia in 2025, an average of about 3.3 nights per trip1.
- International visitors spent 14.7 million nights in the state, up 8.3% on 2024, an average stay of about 33 nights2.
- In the year ending June 2026, interstate visitors stayed longest in Adelaide, about 3.8 nights on average, followed by the Fleurieu and Eyre peninsulas, at 3.6 nights each5.
Where do South Australia's visitors come from?
Interstate visitors made 2.13 million overnight trips to South Australia in 2025, about the same as in 2024 (2.14 million)67. South Australians travelling within their own state made the other 5.68 million domestic overnight trips, also little changed on 202467.
- International visitors made about 445,000 trips, up 1% on 20242. The United Kingdom was the largest market, with 68,000 visitors, ahead of the United States (44,000), New Zealand (41,000), China (38,000) and India (24,000)9.
- About 404,000 international visitors stayed in Adelaide and 123,000 in regional parts of the state2; many visited both.
When is South Australia's peak tourist season?
Summer is South Australia's busiest time for overnight stays. Australians made about 2.10 million overnight trips to the state in the March quarter of 2025 and spent 7.49 million nights there, more than in any other quarter1. The December quarter was next, with 2.05 million trips, while the September quarter, in winter, was the quietest, with 1.75 million.
- Day trips peaked later in the year, in the September quarter, at about 4.25 million1.
- Planning a trip? See our 7-day Adelaide campervan itinerary.
| Quarter (2025) | Overnight trips | Visitor nights | Day trips |
|---|---|---|---|
| March quarter | 2.10 million | 7.49 million | 3.91 million |
| June quarter | 1.91 million | 6.22 million | 4.02 million |
| September quarter | 1.75 million | 5.43 million | 4.25 million |
| December quarter | 2.05 million | 6.43 million | 4.20 million |
Source · Data source: Tourism Research Australia, Domestic Tourism Statistics (December quarter 2025 release).
| Year | Period | Total visitors | International visitors | Domestic overnight visitors | Visitor spending |
|---|---|---|---|---|---|
| 2026 (so far) | January–June 2026 | 4.12 million | 210,5004 | 3.91 million3 | A$4.59 billion |
| 2025 | Year ending December 2025 | 8.26 million | 445,0002 | 7.81 million1 | A$8.25 billion |
| 2024 | Year ending December 2024 | 8.27 million | 440,00014 | 7.83 million6 | A$8.47 billion |
| 2023 | Year ending June 2023 | 7.78 million | 357,00015 | 7.43 million16 | A$7.70 billion |
| 2022 | Year ending September 2022 | 6.83 million | 95,06717 | 6.73 million18 | A$5.60 billion |
| 2021 | Year ending September 2021 | 6.13 million | 9,01617 | 6.12 million18 | A$4.43 billion |
| 2020 | Year ending June 2020 | 6.90 million | 355,00019 | 6.55 million20 | A$4.95 billion |
| 2019 | Year ending June 2019 | 7.87 million | 467,00019 | 7.40 million20 | A$5.93 billion |
Source · Data source: Tourism Research Australia (International Visitor Survey, National Visitor Survey and Domestic Tourism Statistics).
What are the most visited places in South Australia?
Adelaide is the most visited region in South Australia, with about 3.61 million overnight visits in the year ending June 20265. The Fleurieu Peninsula came second, with about 1.14 million, followed by the Yorke Peninsula with 765,000 and the Limestone Coast with 717,000.
- Kangaroo Island drew the most international visitors of any regional area (26,000), and visitors there spent about A$1,019 per overnight trip5, the most outside Adelaide.
- These regional figures come from the South Australian Tourism Commission's year ending June 2026 report. They use Tourism Research Australia's new survey method, so they can't be compared with earlier regional reports.
| Rank | Region | Overnight visits | Interstate | Intrastate | International | Visitor spending |
|---|---|---|---|---|---|---|
| 1 | Adelaide | 3.61 million | 1.43 million | 1.78 million | 404,000 | A$7.56 billion |
| 2 | Fleurieu Peninsula | 1.14 million | 158,000 | 957,000 | 20,000 | A$740 million |
| 3 | Yorke Peninsula | 765,000 | 59,000 | 698,000 | 8,000 | A$444 million |
| 4 | Limestone Coast | 717,000 | 271,000 | 422,000 | 24,000 | A$563 million |
| 5 | Flinders Ranges and Outback | 670,000 | 158,000 | 495,000 | 17,000 | A$467 million |
| 6 | Murray River, Lakes and Coorong | 608,000 | 104,000 | 497,000 | 7,000 | A$391 million |
| 7 | Eyre Peninsula | 493,000 | 90,000 | 392,000 | 11,000 | A$421 million |
| 8 | Riverland | 474,000 | 82,000 | 385,000 | 7,000 | A$332 million |
| 9 | Barossa | 376,000 | 80,000 | 286,000 | 10,000 | A$391 million |
| 10 | Adelaide Hills | 277,000 | 89,000 | 171,000 | 17,000 | A$305 million |
| 11 | Clare Valley | 184,000 | 33,000 | 144,000 | 7,000 | A$162 million |
| 12 | Kangaroo Island | 107,000 | 28,000 | 52,000 | 26,000 | A$115 million |
Source · Data source: South Australian Tourism Commission, Visits to SA Regions, year ending June 2026 (Tourism Research Australia Domestic Tourism Statistics and International Visitor Survey).
Adelaide visitors and spending
- Adelaide had about 3.61 million overnight visits in the year ending June 2026: 1.43 million from interstate, 1.78 million from South Australians and 404,000 from overseas5.
- Visitors spent about A$7.56 billion in Adelaide, including A$2.22 billion on day trips, and about A$1,478 per overnight trip5.
- Nine in ten international visitors to South Australia stay in Adelaide5.
- Read more: Adelaide Tourism Statistics
How many tourists visit Kangaroo Island each year?
Kangaroo Island had about 107,000 overnight visits in the year ending June 2026: 28,000 from interstate, 52,000 from South Australians and 26,000 from overseas5. No other regional area of South Australia draws as many international visitors. Australians also made about 48,000 day trips to the island.
- Visitors spent about A$115 million on the island in the year ending June 2026, or about A$1,019 per overnight trip5. Overseas visitors accounted for about A$50 million of that, more than 40% of the total. At about A$320 per night, visitor spending on the island was the highest of any South Australian region.
- Visitors spent about 337,000 nights on the island. International visitors stayed 3.3 nights on average, interstate visitors 2.9 nights and South Australians 3.2 nights5.
How many tourists visit the Barossa Valley each year?
- The Barossa had about 376,000 overnight visits in the year ending June 2026: 80,000 from interstate, 286,000 from South Australians and 10,000 from overseas5.
- Visitors spent about A$391 million in the region, including A$134 million on day trips, and about A$684 per overnight trip5.
- Australians made about 1 million day trips to the Barossa, far more than its overnight visits. Visitors spent about A$290 per night, second only to Kangaroo Island among the state's regions.5
- Interstate visitors stayed 3.0 nights on average and South Australians 2.1 nights5.
How many people camp in South Australia?
Australians took about 1.2 million caravan and camping trips in South Australia in 2024 and spent about 4.4 million nights there21. Their spending came to about A$820 million, up 6%, or about A$669 per trip.
- Trips were down 1% and nights down 9% on 2023, as travellers took shorter getaways, but interstate caravan and camping trips rose 29%21.
- Caravan and camping figures are for 2024, the latest year in the Caravan Industry Association's public State of Industry report. See also our Australia camping statistics.
- South Australia does not publish current visitor numbers for its national parks, so this page has no park ranking.
Where do people camp in South Australia?
Camping is most popular in the Flinders Ranges and Outback and along the Murray. Camping of all kinds accounted for about 32% of domestic visitors' nights in the Flinders Ranges and Outback22 and the same share in the Murray River, Lakes and Coorong23, just ahead of the Riverland at 31%24.
- Caravan parks and commercial camping grounds took 27% of domestic visitors' nights in the Flinders Ranges and Outback22, more than in any other region.
- Overseas visitors camp most in the Riverland, where they spent nearly half of their nights in caravan parks or commercial camping grounds24.
- Camping is least common on Kangaroo Island, where about 11% of domestic visitors' nights were spent in caravan parks25, and in the Adelaide Hills, at 18% including camping outside commercial grounds26.
- These are the latest regional figures, for the year ending December 2024, from the South Australian Tourism Commission's regional profiles. They show each region's share of visitor nights, not the number of campers.
| Region | Domestic overnight visits | Caravan parks and camping grounds | Other camping | All camping |
|---|---|---|---|---|
| Flinders Ranges and Outback | 662,00022 | 27% | 5% | 32% |
| Murray River, Lakes and Coorong | 382,00023 | 16% | 16% | 32% |
| Riverland | 456,00024 | 24% | 7% | 31% |
| Clare Valley | 218,00027 | 23% | 6% | 29% |
| Barossa | 232,00028 | 23% | 5% | 28% |
| Yorke Peninsula | 612,00029 | 18% | 10% | 28% |
| Fleurieu Peninsula | 699,00030 | 20% | 6% | 26% |
| Limestone Coast | 775,00031 | 12% | 11% | 23% |
| Eyre Peninsula | 442,00032 | 12% | 7% | 19% |
| Adelaide Hills | 191,00026 | 13% | 5% | 18% |
| Kangaroo Island | 152,00025 | 11% | Not reported | 11% or more |
Source · Data source: South Australian Tourism Commission, Regional Tourism Profiles, year ending December 2024 (Tourism Research Australia, National Visitor Survey).
More tourism statistics
- Brisbane Tourism Statistics
- Broome Tourism Statistics
- Cairns Tourism Statistics
- Darwin Tourism Statistics
- Esperance Tourism Statistics
- Fraser Island Tourism Statistics
- Gold Coast Tourism Statistics
- Great Ocean Road Tourism Statistics
- New South Wales Tourism Statistics
- Noosa Tourism Statistics
- Perth Tourism Statistics
- Whitsundays Tourism Statistics
FAQs
Is tourism in South Australia growing?
Partly. International visitors rose 1% to 445,000 in 20252, but domestic overnight trips held steady. Interstate visitors made 2.13 million overnight trips and South Australians made 5.68 million within their own state, both about the same as in 2024, so domestic overnight trips overall were down just 0.2%67.
How much is cruise tourism worth to South Australia?
The cruise industry injected about A$198 million into the state's economy in the 2024–25 season and supported 613 jobs34, according to the South Australian Tourism Commission. Ships called at Adelaide, Kangaroo Island, Port Lincoln and Robe, among other ports.
How does South Australia compare with other states for tourism?
South Australia is the country's fifth-largest domestic tourism market, drawing about 6.9% of all domestic overnight trips in Australia in 20251.
How much do visitors spend per trip in South Australia?
Overnight visitors spent about A$1,062 per trip across the state in the year ending June 2026, compared with A$628 per trip in regional South Australia5.
What is the most visited place in South Australia?
Adelaide, with about 3.61 million overnight visits in the year ending June 20265. Outside the city, the Fleurieu Peninsula is the most visited region, with about 1.14 million overnight visits, ahead of the Yorke Peninsula and the Limestone Coast.
Campervan hire in Australia
- Broome motorhome hire
- Cairns
- Campervan hire in Adelaide
- Campervan hire in Alice Springs
- Campervan hire in Brisbane
- Campervan hire in Darwin
- Campervan hire in Launceston
- Campervan hire in Melbourne
- Devonport campervan rental
- Gold Coast
- Hobart motorhome hire
- Perth
- Sydney
- Tasmania motorhome hire
References
- Domestic Tourism Statistics results — December quarter 2025 (Tourism Research Australia) · Tourism Research Australia ↑ b c d e f g h i j k l m n o
- International tourism results — year ending December 2025 (International Visitor Survey) · Tourism Research Australia ↑ b c d e f g h i j k
- Domestic Tourism Statistics results — June quarter 2026 compared to June quarter 2025 (Tourism Research Australia) · Tourism Research Australia ↑ b c d e f g
- International tourism results — year ending June 2026 (International Visitor Survey) · Tourism Research Australia ↑ b c d e
- Visit to SA Regions — year ending June 2026 (South Australian Tourism Commission) · tourism.sa.gov.au ↑ b c d e f g h i j k l m n o p q
- Tourism Research Australia — Domestic Tourism Statistics: 2019–2024 overnight backcast data (revised) · Tourism Research Australia ↑ b c d e f g h i j
- Domestic Tourism Statistics South Australia All Purpose December 2025 (South Australian Tourism Commission) · tourism.sa.gov.au ↑ b c d
- State Tourism Satellite Account 2024–25 snapshot — South Australia (South Australian Tourism Commission) · tourism.sa.gov.au ↑ b c d
- International Performance to December 2025 (South Australian Tourism Commission) · tourism.sa.gov.au ↑ b
- Domestic Tourism Statistics results — March quarter 2026 compared to March quarter 2025 (Tourism Research Australia) · Tourism Research Australia ↑ b
- International tourism results — March quarter 2026 (International Visitor Survey) · Tourism Research Australia ↑
- Overseas Arrivals and Departures, Australia, August 2026 — Table 11: Short-term visitors arriving, state of intended stay (ABS) · Australian Bureau of Statistics ↑ b
- IVS results for the year ending December 2024 compared to December 2019 · Tourism Research Australia ↑ b
- IVS results for the year ending December 2024 compared to December 2023 · Tourism Research Australia ↑ b
- International Visitor Survey results tables, year ending June 2023 compared with June 2022 (Tourism Research Australia) · Tourism Research Australia ↑
- National Visitor Survey results tables, year ending June 2023 compared with June 2022 (Tourism Research Australia) · Tourism Research Australia ↑
- International Visitor Survey results tables, year ending September 2022 compared with September 2021 (Tourism Research Australia) · Tourism Research Australia ↑ b
- National Visitor Survey results tables, year ending September 2022 compared with September 2021 (Tourism Research Australia) · Tourism Research Australia ↑ b
- International Visitor Survey results, year ending June 2020 (Tourism Research Australia) · Tourism Research Australia ↑ b
- National Visitor Survey results, year ending June 2020 (Tourism Research Australia) · Tourism Research Australia ↑ b
- Caravan and Camping State of Industry 2025 (Caravan Industry Association of Australia) · assets.pc.gov.au ↑ b
- Regional Profile – Flinders Ranges and Outback, year end December 2024 (South Australian Tourism Commission) · tourism.sa.gov.au ↑ b c
- Regional Profile – Murray River, Lakes and Coorong, year end December 2024 (South Australian Tourism Commission) · tourism.sa.gov.au ↑ b
- Regional Profile – Riverland, year end December 2024 (South Australian Tourism Commission) · tourism.sa.gov.au ↑ b c
- Regional Profile – Kangaroo Island, year end December 2024 (South Australian Tourism Commission) · tourism.sa.gov.au ↑ b
- Regional Profile – Adelaide Hills, year end December 2024 (South Australian Tourism Commission) · tourism.sa.gov.au ↑ b
- Regional Profile – Clare Valley, year end December 2024 (South Australian Tourism Commission) · tourism.sa.gov.au ↑
- Regional Profile – Barossa, year end December 2024 (South Australian Tourism Commission) · tourism.sa.gov.au ↑
- Regional Profile – Yorke Peninsula, year end December 2024 (South Australian Tourism Commission) · tourism.sa.gov.au ↑
- Regional Profile – Fleurieu Peninsula, year end December 2024 (South Australian Tourism Commission) · tourism.sa.gov.au ↑
- Regional Profile – Limestone Coast, year end December 2024 (South Australian Tourism Commission) · tourism.sa.gov.au ↑
- Regional Profile – Eyre Peninsula, year end December 2024 (South Australian Tourism Commission) · tourism.sa.gov.au ↑
- Regional statistics and regional tourism profiles (South Australian Tourism Commission) · tourism.sa.gov.au ↑
- Cruise in South Australia (South Australian Tourism Commission) · tourism.sa.gov.au ↑
- TRA — International tourism results, Australia, March 2024 · Tourism Research Australia