

Updated
At a Glance
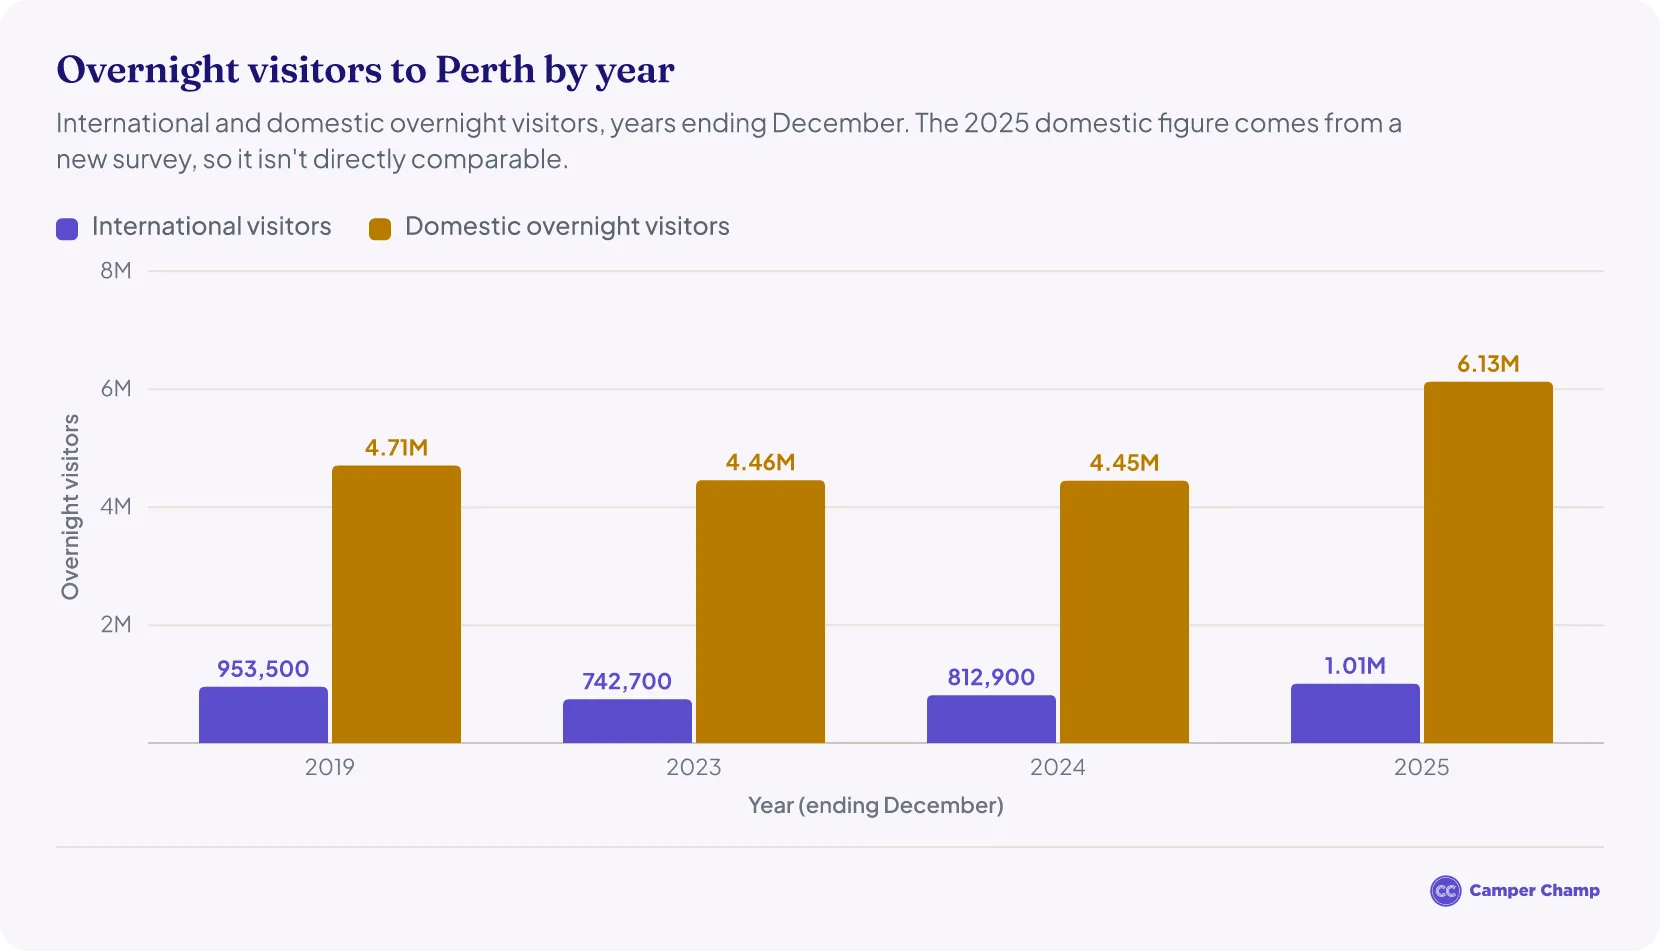
- 7.13 million overnight visitors travelled to Perth in 2025: 6.13 million domestic1 and 1.01 million international.
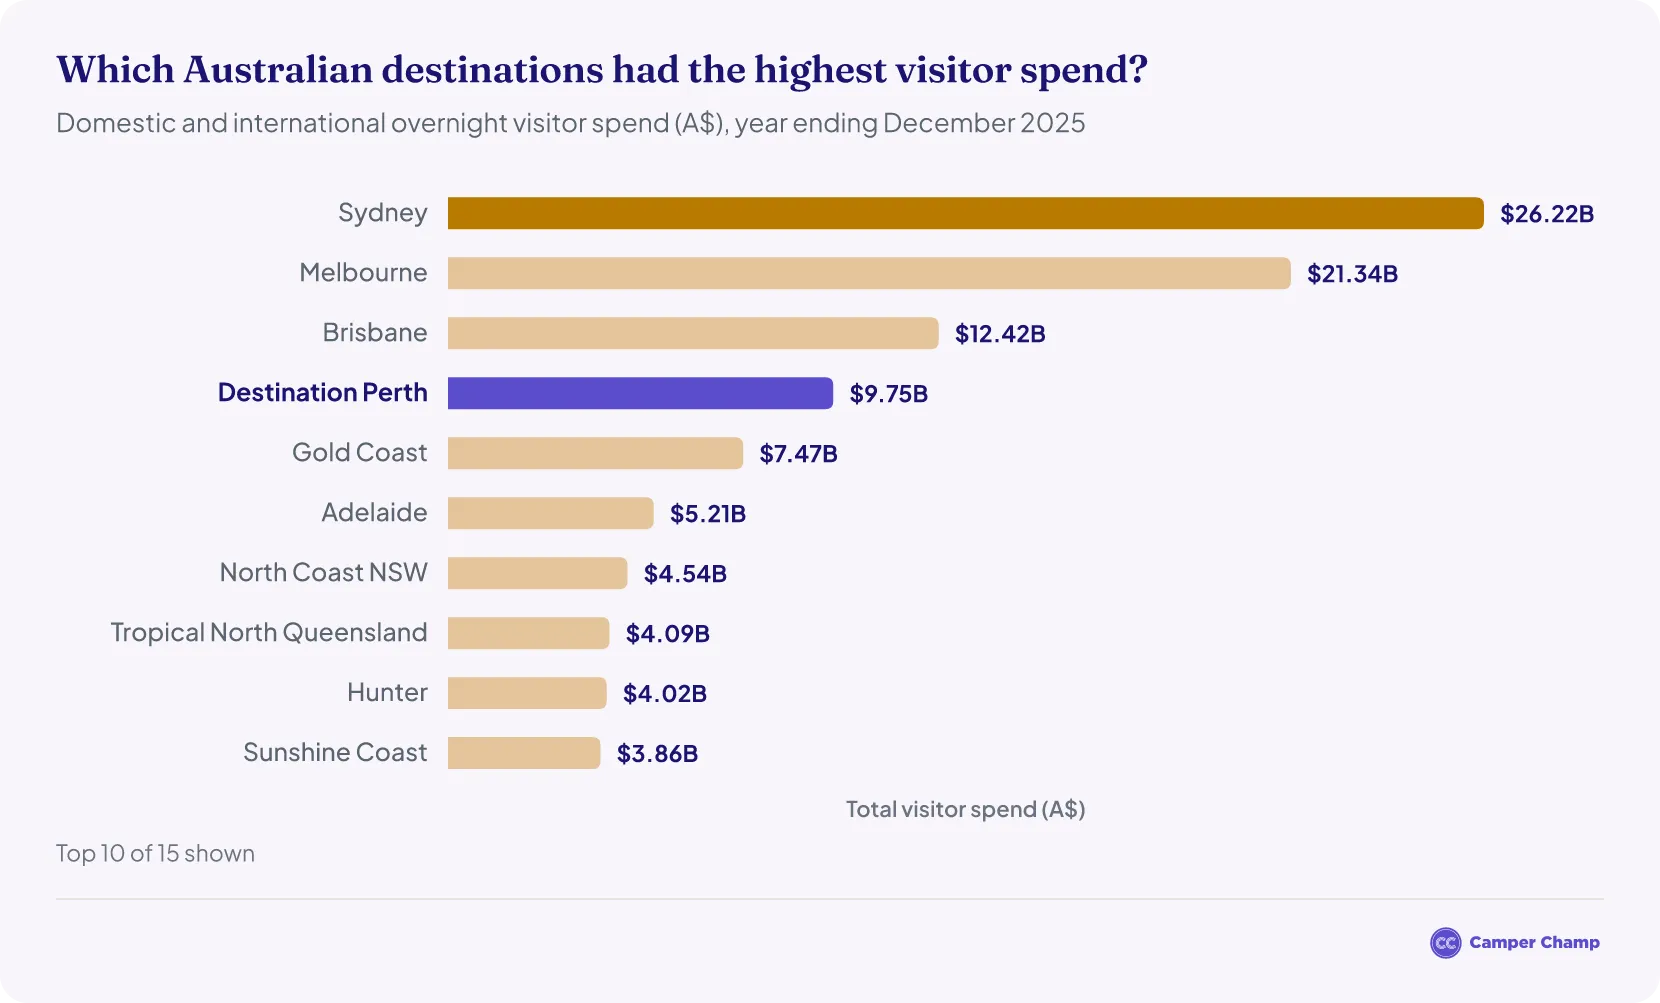
- Overnight visitors spent about A$9.75 billion in 2025: A$6.77 billion by domestic visitors1 and A$2.98 billion by international visitors.
- International visitors rose about 24% on 2024, from 813,000 to 1.01 million.1
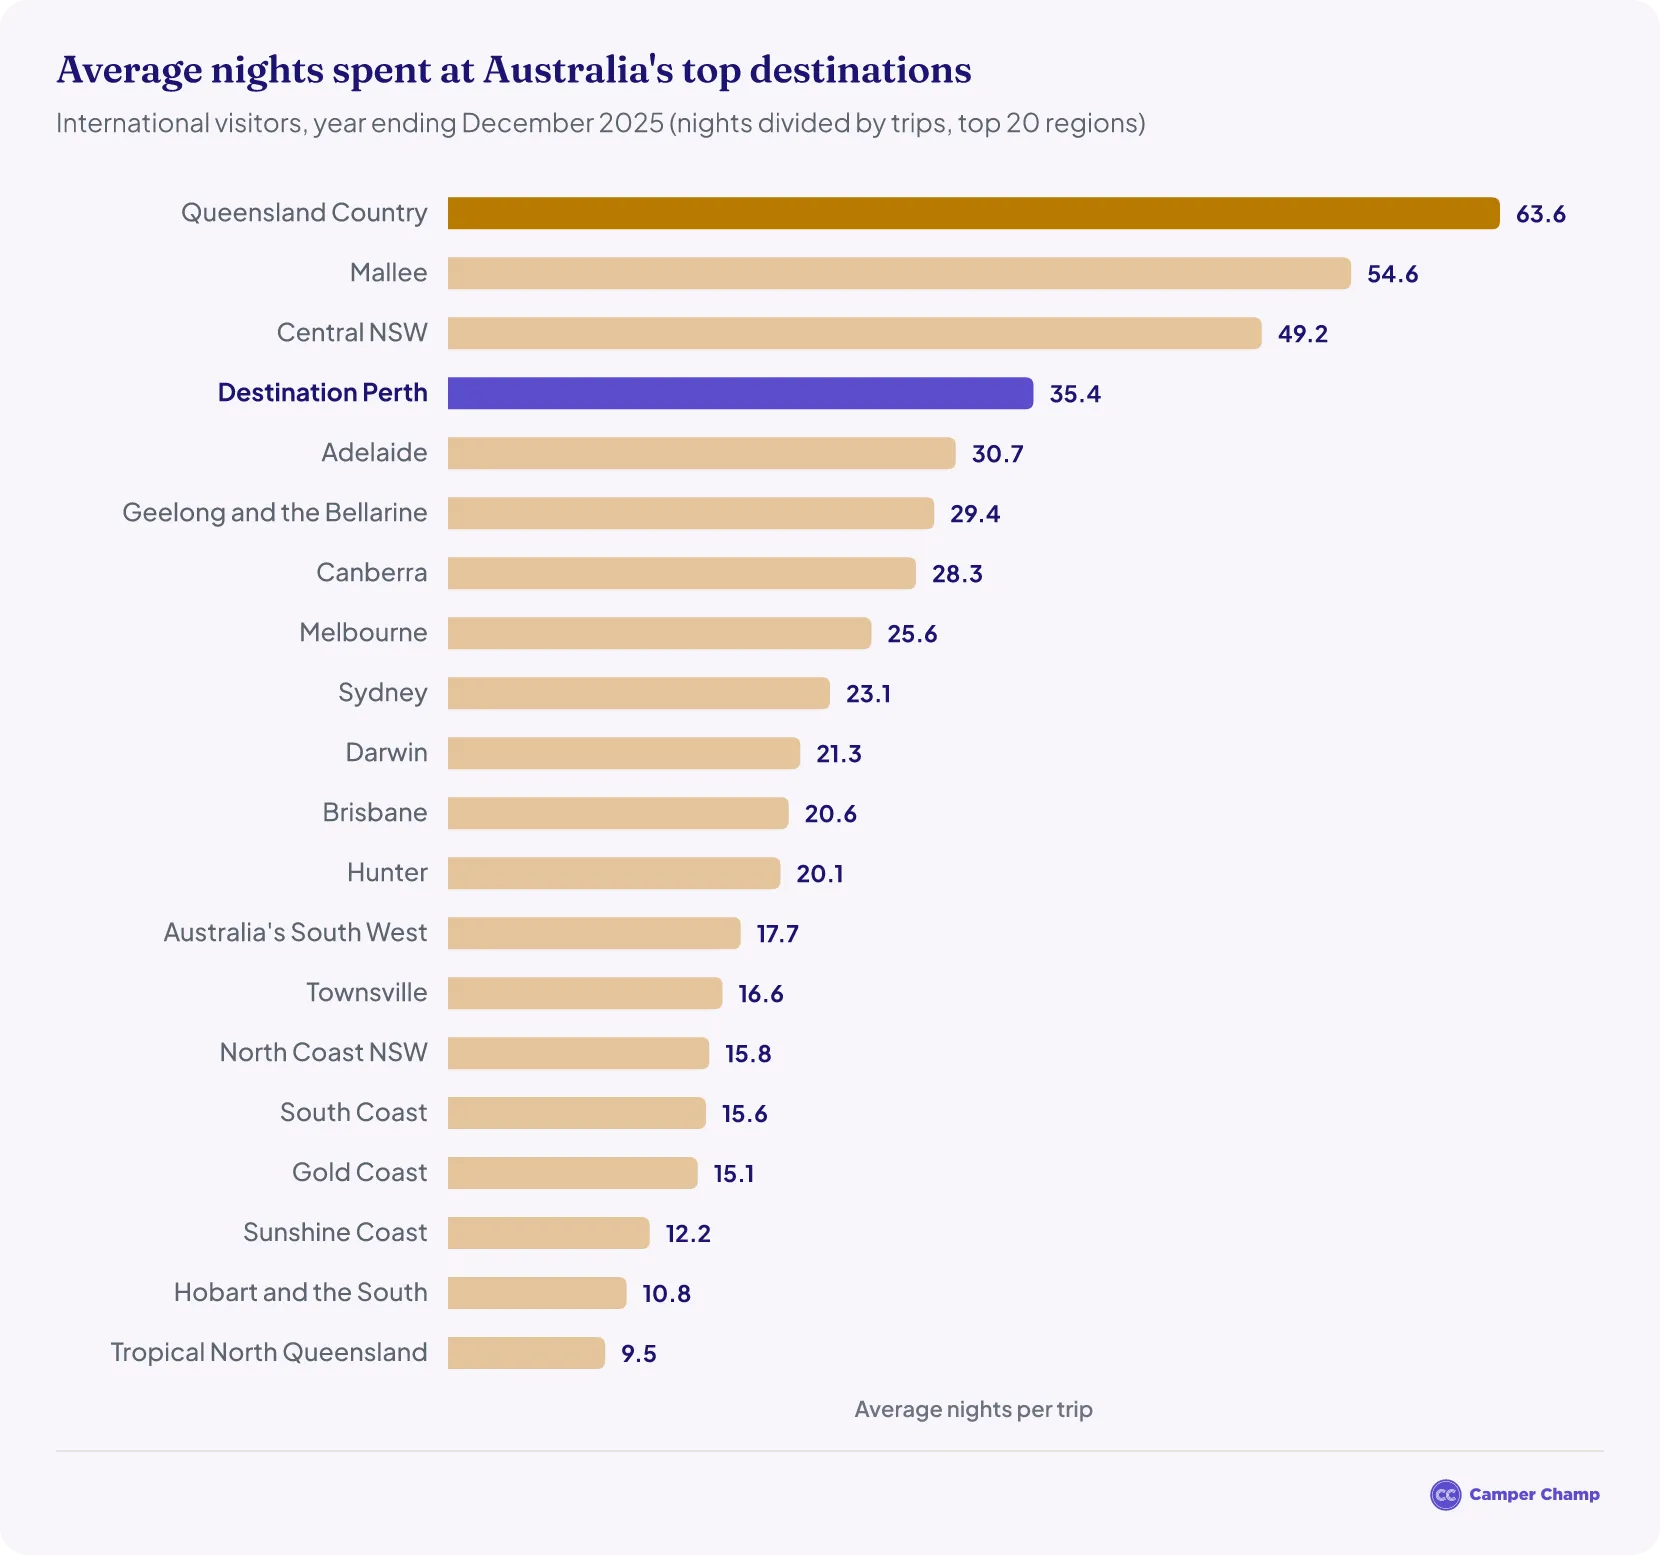
- International visitors stayed 35.4 nights on average, the longest of any Australian capital city.2
- The United Kingdom was the largest international market, with 14% of Perth's international visitors.1
- New South Wales sent the most interstate visitors (34%), ahead of Victoria (31%).1
- Kings Park and Botanic Garden, Perth's most visited attraction, drew about 5.1 million visitors in 2025–26.3
How many tourists visit Perth each year?
Around 7.13 million overnight visitors travelled to Perth in 2025 (year ending December).1
- Roughly 6.13 million were domestic visitors4 and about 1.01 million came from overseas.2
- International visitors were about 6% above their 2019 level of 954,000.1
- The 2025 domestic count comes from Tourism Research Australia's new Domestic Tourism Statistics survey, so it can't be compared directly with earlier years.
| Perth visitor numbers by year | ||||
|---|---|---|---|---|
| Year | Period | Total visitors | International visitors | Domestic overnight visitors |
| 2025 | Year ending December 2025 | 7.13 million | 1.01 million1 | 6.13 million1 |
| 2023 | Year ending December 2023 | 5.20 million | 743,0001 | 4.46 million5 |
| 2019 | Year ending December 2019 | 5.66 million | 954,0001 | 4.71 million5 |
Source · Data source: Tourism Research Australia via Tourism WA (International Visitor Survey, National Visitor Survey and Domestic Tourism Statistics).
How many visitors has Perth had in 2026?
Perth Airport handled 9.0 million passengers from January to June 2026, about 4% more than in the same months of 2025. International passengers rose about 6% to 2.73 million.6
- About 1.00 million international visitors stayed overnight in Perth in the year ending June 2026, up about 13% on the year before.7
- March 2026 had the biggest rise, with about 11% more passengers than March 2025.6
- Perth's domestic visitor numbers for 2026 haven't been published yet, so the latest domestic figure is for 2025. Airport figures also include Perth residents flying out, not just visitors arriving.
| Perth Airport passengers by month, 2026 | ||||
|---|---|---|---|---|
| Month | Total passengers | Same month 2025 | Change | International passengers |
| January 2026 | 1,611,647 | 1,564,320 | +3.0% | 556,509 |
| February 2026 | 1,383,014 | 1,295,572 | +6.7% | 437,399 |
| March 2026 | 1,548,604 | 1,395,859 | +10.9% | 450,996 |
| April 2026 | 1,555,974 | 1,526,850 | +1.9% | 455,300 |
| May 2026 | 1,445,028 | 1,442,847 | +0.2% | 406,451 |
| June 2026 | 1,457,829 | 1,424,109 | +2.4% | 427,140 |
| January–June 2026 | 9,002,096 | 8,649,557 | +4.1% | 2,733,795 |
Source · Data source: Perth Airport, airport statistics.
How much did tourists spend in Perth in 2025?
Overnight visitors spent approximately A$9.75 billion1 in Perth during the year ending December 2025.
| Overnight visitor spending in Perth | ||
|---|---|---|
| Year | International | Domestic |
| 2019 | A$1.96 B8 | A$3.91 B5 |
| 2023 | A$1.95 B8 | A$5.42 B5 |
| 2024 | A$2.27 B8 | A$5.33 B8 |
| 2025 | A$2.98 B1 | A$6.77 B1 |
Source · Data source: Tourism Research Australia via Tourism WA (International Visitor Survey, National Visitor Survey and Domestic Tourism Statistics).
How long do tourists stay in Perth?
- Domestic overnight visitors spent about 19.4 million nights in Perth in 20251, an average of about 3.2 nights per trip. Interstate visitors stayed about 5.3 nights on average, and Western Australians travelling within the state about 2.7 nights.
- International tourists stayed in Perth for an average of 35.4 nights per trip in 2025.2
- That was the longest average stay of any Australian capital city and the 4th longest of Australia's top 20 regions, well ahead of Sydney at 23.1 nights.2
Why do people visit Perth?
Most trips to Perth are holidays or visits to friends and relatives. Of the 5.11 million overnight trips Western Australians made to Perth in 2025, 42% were holidays and 39% were to visit friends and relatives.1
- Interstate visitors were far more likely to come for work: 32% of the 1.02 million interstate trips were for business, 39% to visit friends and relatives and 24% for a holiday.1
- Among international visitors, 44% came on holiday and 40% to visit friends and relatives (average of 2024 and 2025).1
- Some visitors travel for more than one reason, so the shares can add up to more than 100%.
Where do Perth's visitors come from?
The United Kingdom is Perth's largest international market, making up 14% of international visitors (average of 2024 and 2025), followed by Singapore (13%), New Zealand (8%), China (7%) and Malaysia (7%).1
| Perth's top international markets | ||
|---|---|---|
| Market | Share of Perth's international visitors | Share of WA's international visitors |
| United Kingdom | 14% | 15% |
| Singapore | 13% | 12% |
| New Zealand | 8% | 8% |
| China | 7% | 7% |
| Malaysia | 7% | 6% |
Source · Data source: Tourism WA, Destination Perth Overnight Visitor Factsheet 2025 (Tourism Research Australia International Visitor Survey).
When is the busiest time to visit Perth?
October and January are usually Perth's busiest months for travel, and February is the quietest. Perth Airport handled 18.4 million passengers in 2025–26 (July 2025 to June 2026), peaking at 1.66 million in October 2025 and dipping to 1.38 million in February 2026.6
- International travel peaks in summer: 556,509 international passengers used Perth Airport in January 2026, the busiest month of the year for international flights.6
- The July school holidays are also busy, with 1.61 million passengers in July 2025.6
- Airport figures include Perth residents flying out as well as visitors arriving, so they show when people travel rather than exact tourist numbers.
| Perth Airport passengers by month, 2025–26 | ||
|---|---|---|
| Month | Total passengers | International passengers |
| July 2025 | 1,609,713 | 481,433 |
| August 2025 | 1,458,664 | 437,022 |
| September 2025 | 1,540,086 | 462,462 |
| October 2025 | 1,659,101 | 485,777 |
| November 2025 | 1,514,082 | 443,628 |
| December 2025 | 1,604,142 | 509,004 |
| January 2026 | 1,611,647 | 556,509 |
| February 2026 | 1,383,014 | 437,399 |
| March 2026 | 1,548,604 | 450,996 |
| April 2026 | 1,555,974 | 455,300 |
| May 2026 | 1,445,028 | 406,451 |
| June 2026 | 1,457,829 | 427,140 |
Source · Data source: Perth Airport, airport statistics.
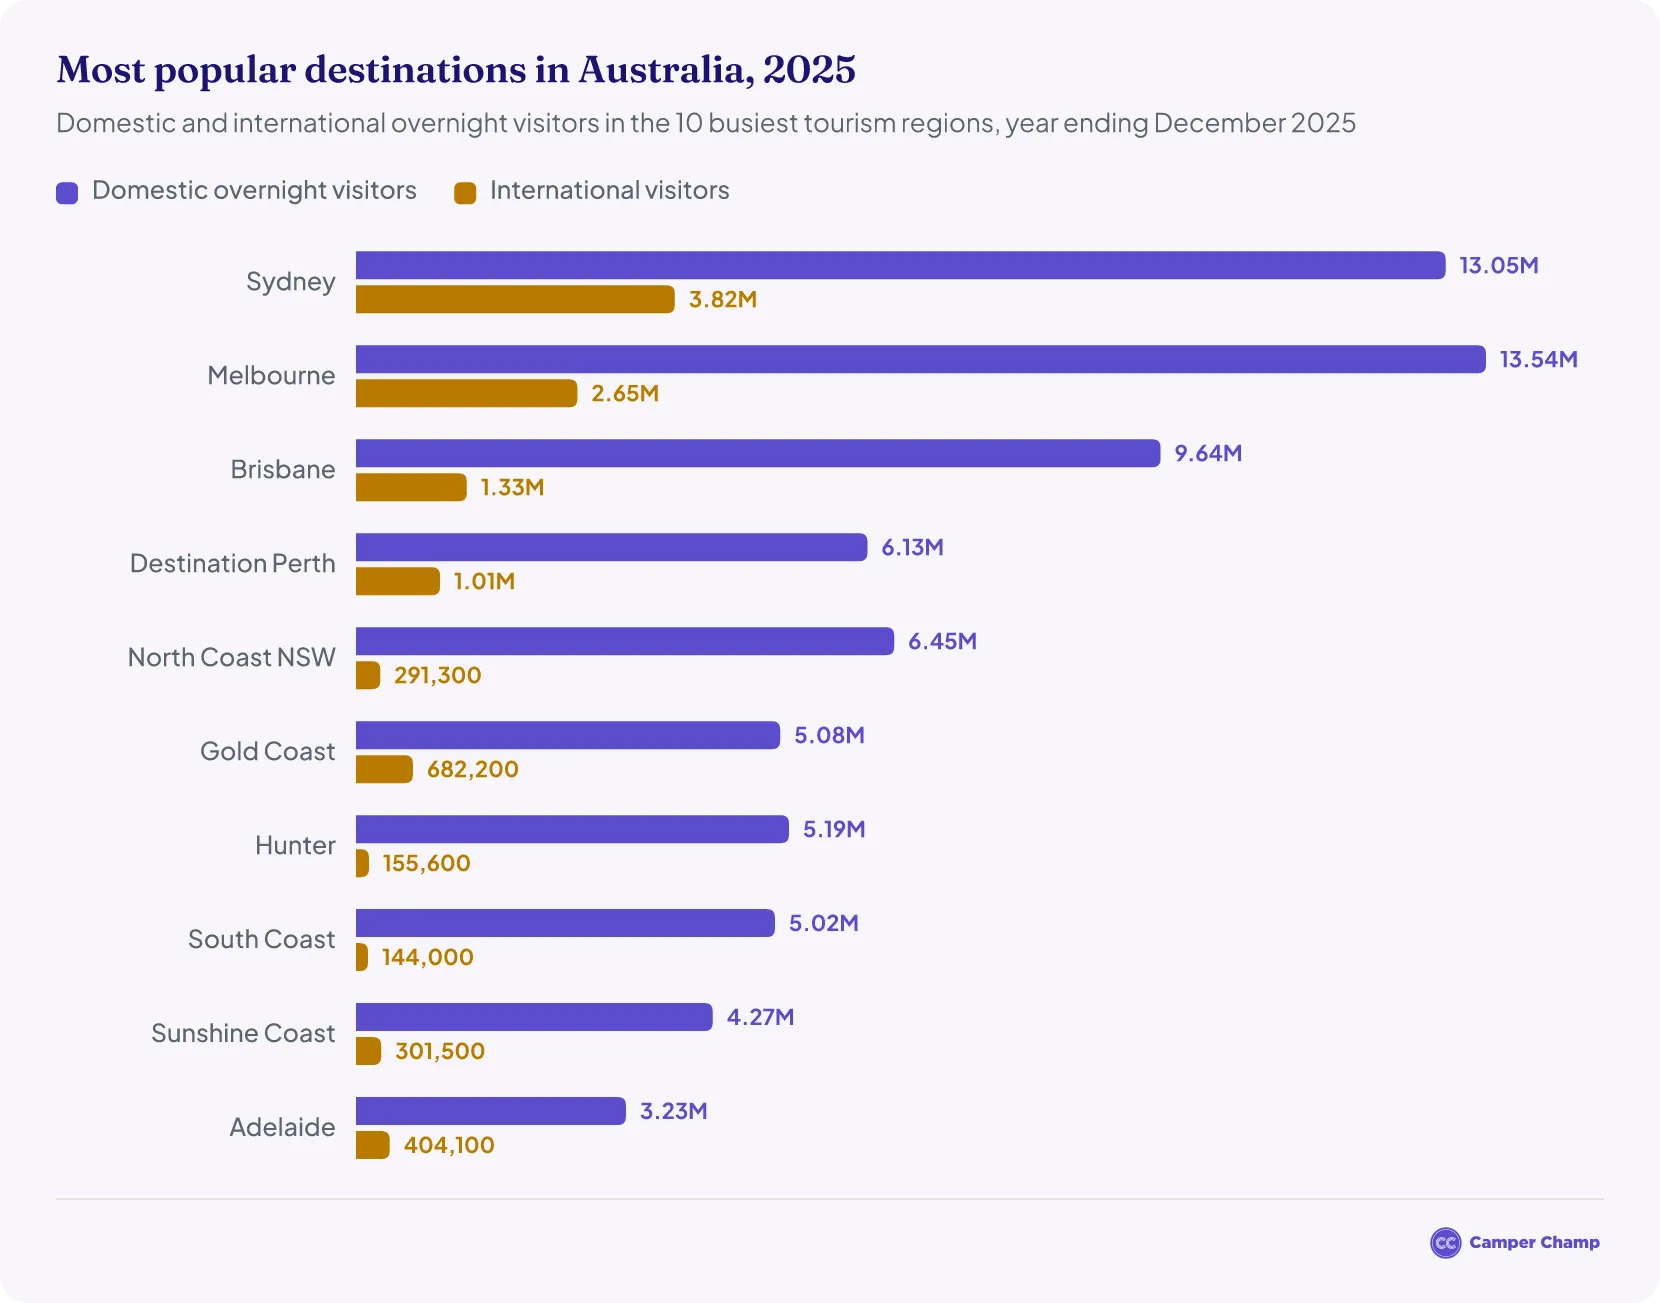
How popular is Perth as a tourist destination?
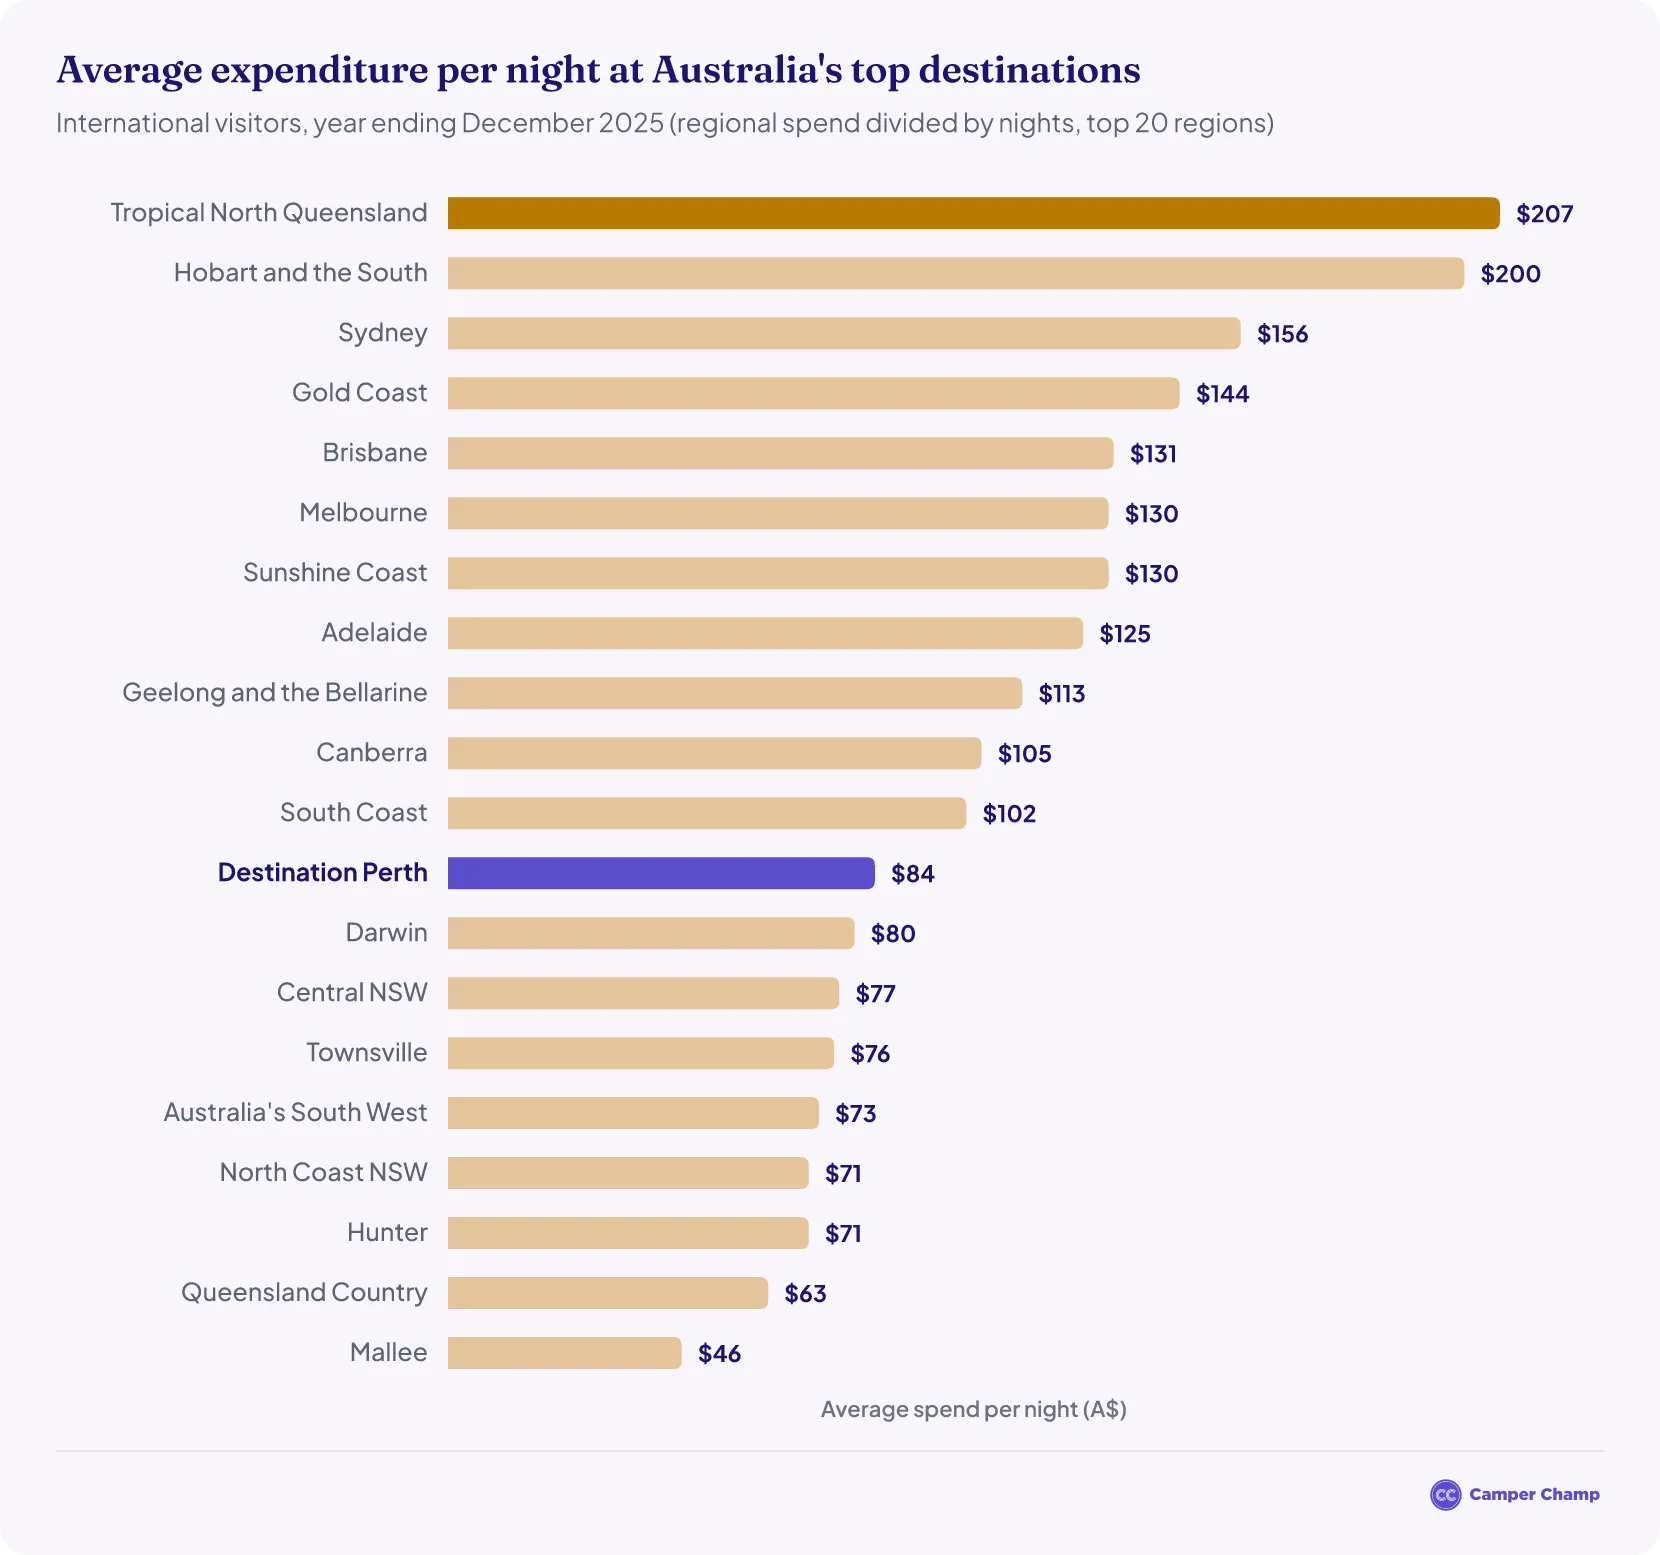
How much do international tourists spend per day in Perth?
- International tourists spent an average of about A$84 for each night of their stay in Perth in 20252, less than in most other popular destinations in Australia.
- That ranked Perth 12th of Australia's top 20 regions for international visitors, well below Sydney (A$156) and Brisbane (A$131).2
What are the most visited attractions in Perth?
Kings Park and Botanic Garden is by far Perth's most visited attraction. Here are the latest annual visitor numbers for the city's biggest attractions:
- Kings Park and Botanic Garden: about 5.1 million visitors in 2025–26 (the financial year ending June 2026)3, down from 5.3 million in 2024–25.9
- Perth Zoo: almost 730,000 visitors in 2025–26, after a record 937,880 visits in 2024–25.10
- Rottnest Island: 890,061 visitors arrived by ferry in 2025–26, about 1% more than the year before.11
- Fremantle Prison: 210,672 visitors in 2024–2512, the latest year published.
How many tourists visit Western Australia each year?
About 11 million overnight visitors travelled to Western Australia in 2025: 9.95 million domestic overnight visitors4 and 1.07 million international visitors.2
For day trips, spending and regional figures, see our Western Australia tourism statistics.
How many people camp in Perth and Western Australia?
Australians took about 1.79 million caravan and camping trips in Western Australia in 2024 and spent about 7.02 million nights there.13
- In Perth: commercial caravan parks and campgrounds accounted for 5% of the nights Western Australians spent in Perth in 2025, and non-commercial camping another 4%.1 Across all of Western Australia, the shares were 13% and 7%.
- Caravans and campervans: Western Australia had 123,390 registered recreational vehicles, according to the Caravan Industry Association's 2025 State of Industry report.13
- Across Australia: Australians took 17.3 million overnight caravan and camping trips in 2025.14 State figures for 2025 are only in a members-only industry report, so 2024 is the latest year publicly available for Western Australia.
- Read more: Australia camping statistics
Where can you camp in national parks near Perth?
Perth's national parks and Rottnest Island have a few small campgrounds, all of which need booking:
- Yanchep National Park: Henry White Oval has 21 unpowered sites, nine of them for campervans and camper trailers.15
- Beelu National Park: the Perth Hills Discovery Centre campground has 12 tent sites and is open on Friday to Sunday nights and during school holidays.16
- Walyunga National Park: five sites; the campground closes from December to March because of the fire risk.17
- Rottnest Island: the Stay Rottnest Campground has 43 tent sites close to the main settlement.18
Campervan hire in Australia
- Cairns motorhome hire
- Campervan hire in Adelaide
- Campervan hire in Alice Springs
- Campervan hire in Brisbane
- Campervan hire in Broome
- Campervan hire in Darwin
- Campervan hire in Devonport
- Campervan hire in Gold Coast
- Campervan hire in Launceston
- Campervan hire in Sydney
- Campervan hire in Tasmania
- Hobart campervan rental
- Melbourne motorhome hire
- Perth motorhome hire
FAQs
Where do visitors stay in Perth?
Most stay with friends or relatives. In 2025, a friend's or relative's home accounted for 45% of the nights Western Australians spent in Perth and 40% of interstate visitors' nights, while hotels, resorts and motels took 24% and 38%.1 International visitors split their nights mainly between friends' and relatives' homes (38%) and rented houses or apartments (34%).
What do international visitors do in Perth?
Almost all of them eat out: 95% of international visitors went to a restaurant or cafe, 86% went sightseeing, 84% went shopping, 75% went to the beach and 69% visited a national or state park (average of 2024 and 2025).1
Which parts of Perth do international visitors stay in?
Most stay in the City of Perth, which accounted for 54% of international visitors, followed by Fremantle (7%) and Stirling (6%).1
What is the busiest month to visit Perth?
October and January are usually the busiest. Perth Airport's busiest month in 2025–26 was October 2025, with 1.66 million passengers, and international passengers peaked in January 2026.6 February is the quietest month.
More tourism statistics
- Adelaide Tourism Statistics
- Brisbane Tourism Statistics
- Broome Tourism Statistics
- Byron Bay Tourism Statistics
- Esperance Tourism Statistics
- Fraser Island Tourism Statistics
- Noosa Tourism Statistics
- Rottnest Island Tourism Statistics
- Sydney Opera House Tourism Statistics
- Tasmania Tourism Statistics
- Warner Bros. Movie World Tourism Statistics
- Western Australia Tourism Statistics
References
- Destination Perth Overnight Visitor Factsheet 2025 (revised) (Tourism WA) · tourism.wa.gov.au ↑ b c d e f g h i j k l m n o p q r s t u v w x y z a2 b2 c2
- International tourism results — year ending December 2025 (International Visitor Survey) · Tourism Research Australia ↑ b c d e f g h i j k l
- Botanic Gardens and Parks Authority Annual Report 2025–2026 · library.dbca.wa.gov.au ↑ b
- Domestic Tourism Statistics Snapshot, year ending December 2025 (Tourism and Events Queensland) · teq.queensland.com ↑ b c d e f
- NVS results data tables for the year ending December 2023 compared to December 2019 (Tourism Research Australia) · Tourism Research Australia ↑ b c d
- Perth Airport statistics — monthly passengers · perthairport.com.au ↑ b c d e f g h
- International tourism results — year ending June 2026 (International Visitor Survey) · Tourism Research Australia ↑
- Destination Perth Overnight Visitor Factsheet 2024 (Tourism WA) · assets-us-01.kc-usercontent.com ↑ b c d e
- Annual Report 2024–2025 (Botanic Gardens and Parks Authority) · library.dbca.wa.gov.au ↑
- Zoological Parks Authority 2026 Annual Report (Perth Zoo) · library.dbca.wa.gov.au ↑
- Rottnest Island Authority Annual Report 2025–26 · ria.wa.gov.au ↑
- Department of Planning, Lands and Heritage Annual Report 2024–25 · wa.gov.au ↑
- Caravan and Camping State of Industry 2025 (Caravan Industry Association of Australia) · assets.pc.gov.au ↑ b
- Australian caravan and camping industry statistics (Caravan Industry Association of Australia, updated 8 September 2026) · caravanindustry.com.au ↑
- Henry White Oval Campground, Yanchep National Park (Explore Parks WA) · exploreparks.dbca.wa.gov.au ↑
- Perth Hills Discovery Centre Campground, Beelu National Park (Explore Parks WA) · exploreparks.dbca.wa.gov.au ↑
- Walyunga Campground, Walyunga National Park (Explore Parks WA) · exploreparks.dbca.wa.gov.au ↑
- Stay Rottnest Campground (Rottnest Island Authority) · rottnestisland.com ↑
- TRA — International tourism results, Australia, March 2024 · Tourism Research Australia