

Updated
At a Glance
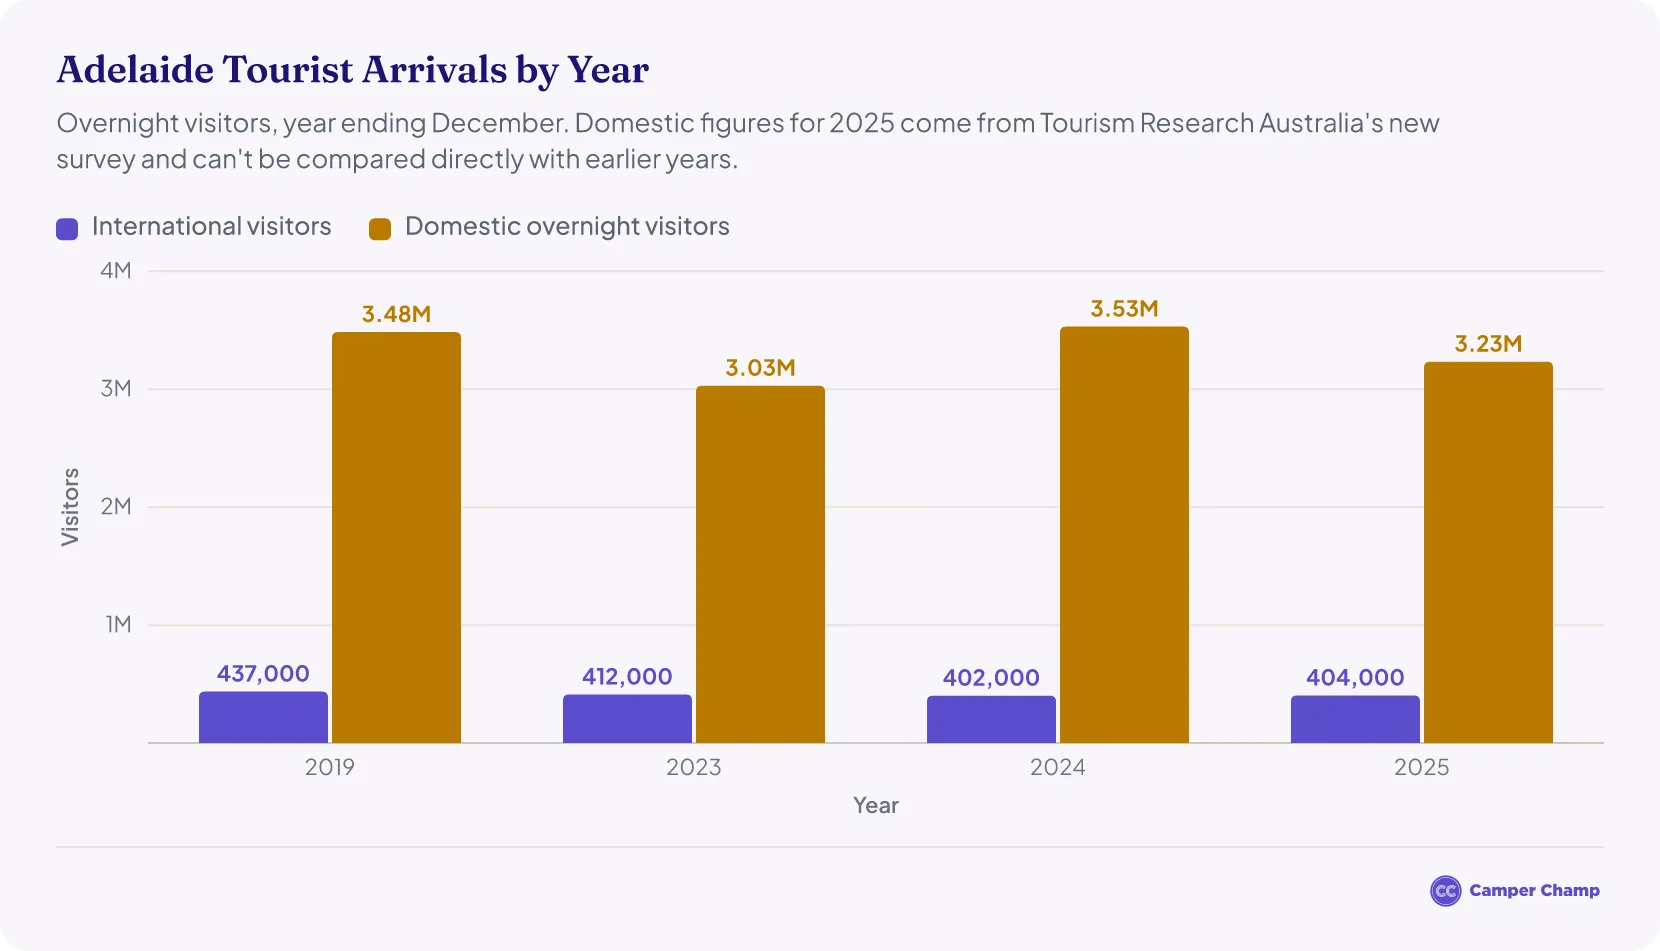
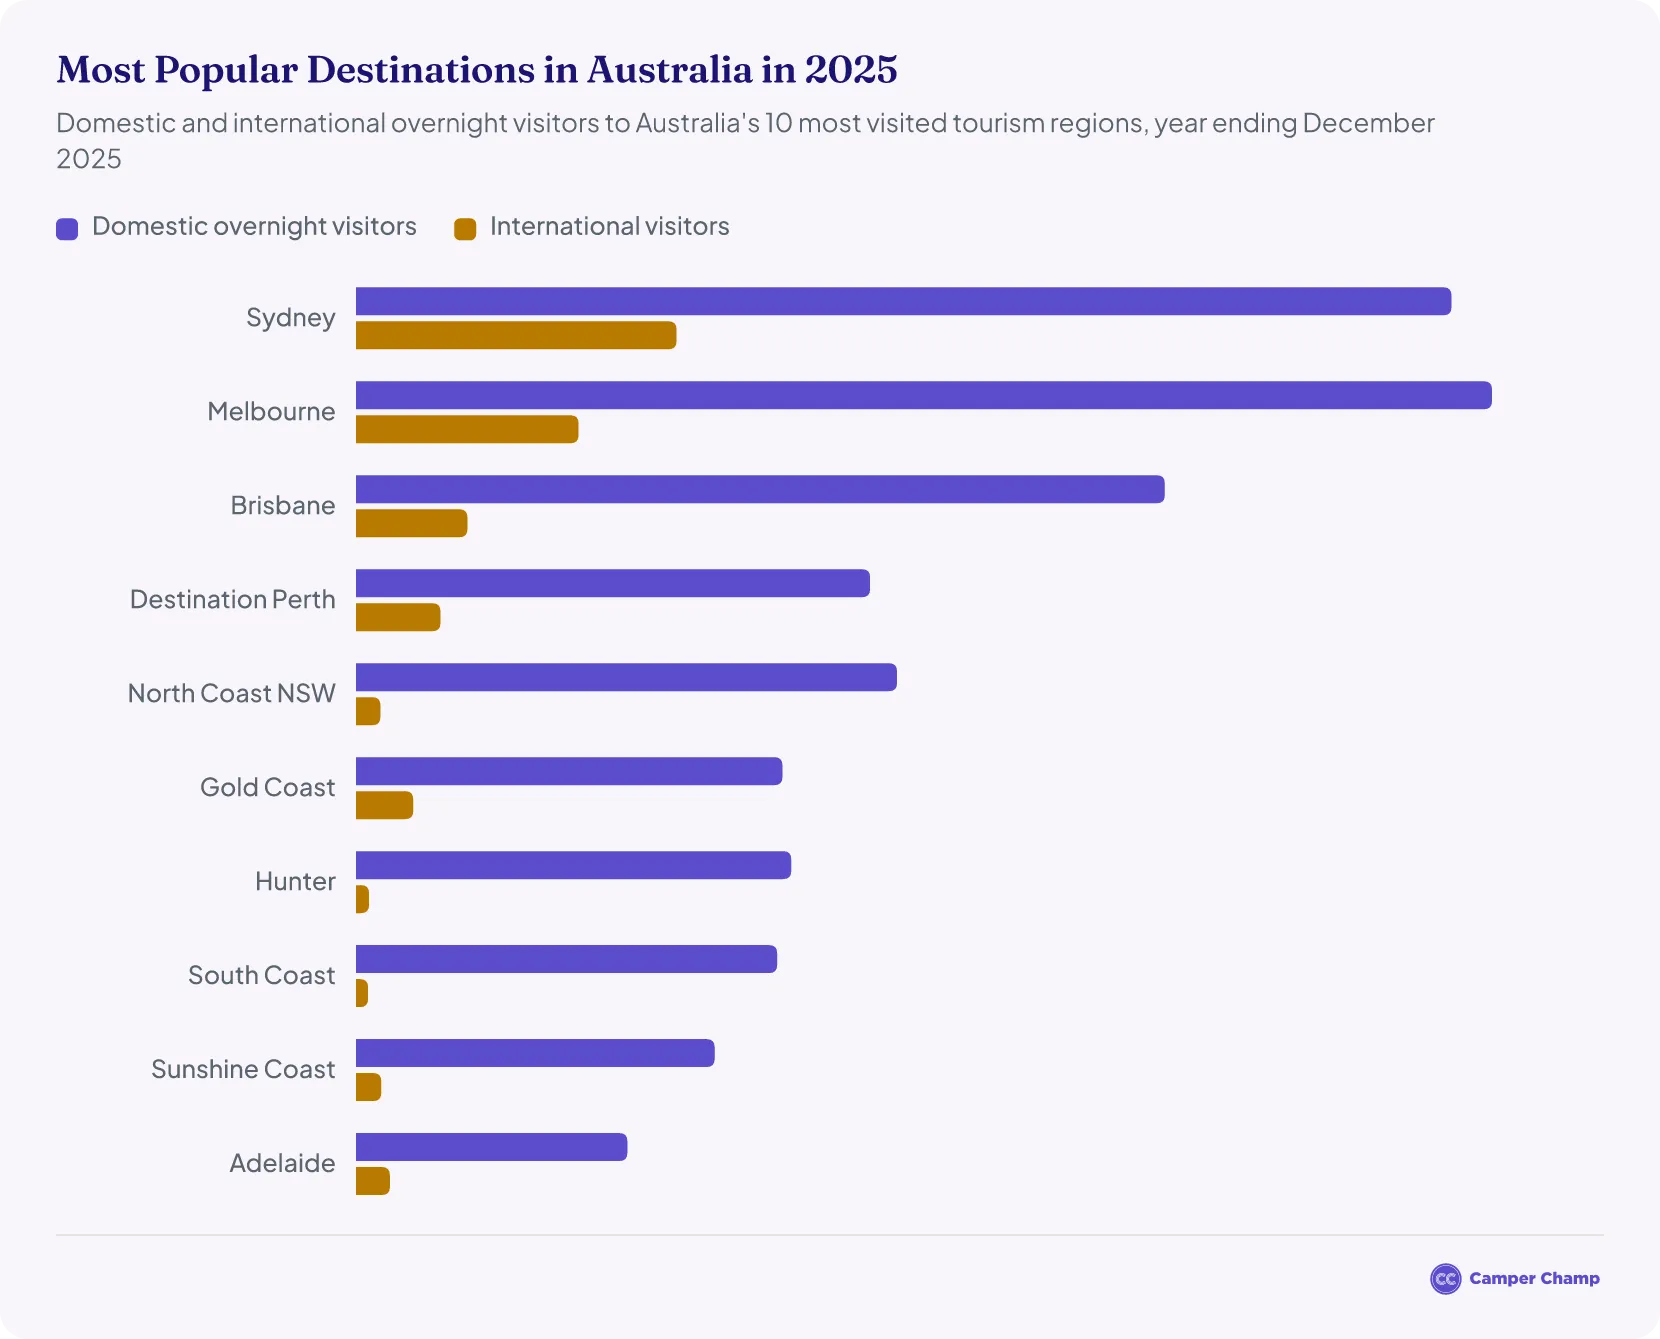
- 3.64 million overnight visitors travelled to Adelaide in 2025: 3.23 million domestic1 and 404,000 international visitors2.
- In the 12 months to June 2026, Adelaide had about 3.61 million overnight visits and 9.40 million day trips3.
- In the first half of 2026, Australians made about 3.91 million overnight trips in South Australia4, down 3% on a year earlier5, and spent about A$3.80 billion, up 15%4.
- Overnight visitors spent about A$5.21 billion in Adelaide in 2025: A$3.66 billion by domestic visitors1 and A$1.55 billion by international visitors2.
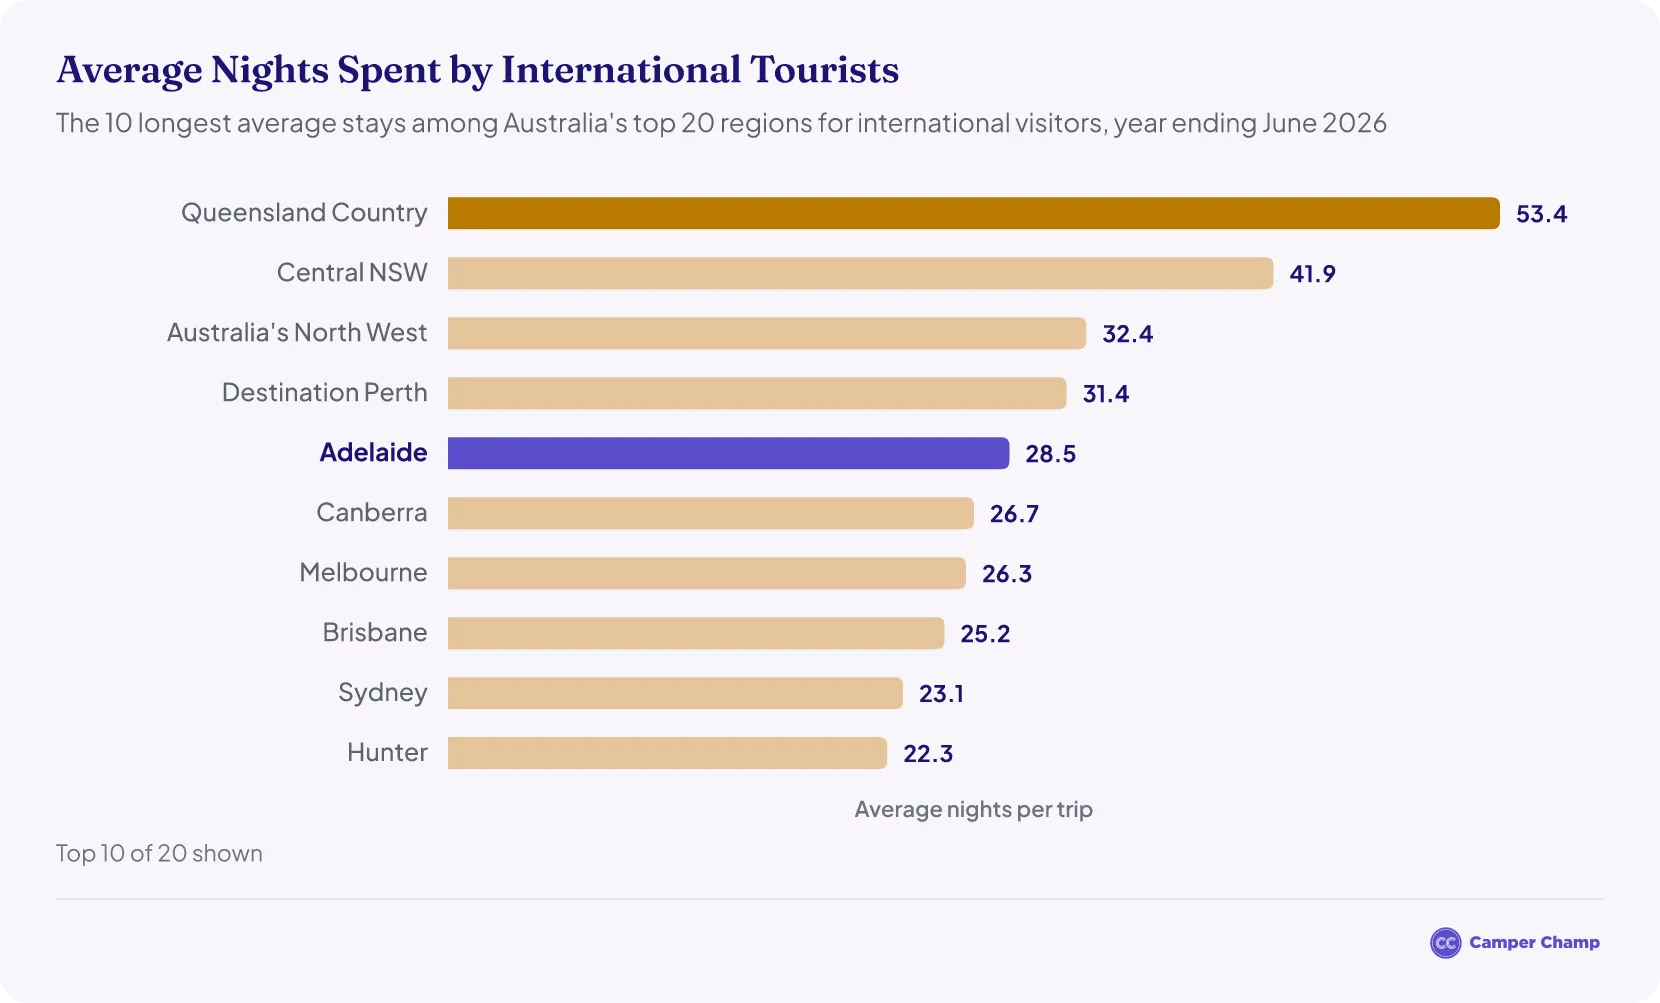
- International visitors stay about 29 nights on average, compared with 3.8 nights for interstate visitors and 2.6 nights for South Australians3.
- South Australians made 1.78 million overnight visits to Adelaide in the year to June 2026, ahead of 1.43 million from interstate3.
- The United Kingdom is South Australia's largest international market, with 68,000 visitors in the year to June 2026, ahead of the United States (49,000) and New Zealand (39,000)6.
- Adelaide Central Market draws about 8 million visitors a year7.
How many tourists visit Adelaide each year?
Over 3.6 million overnight visitors1 travelled to Adelaide in 20252, and Australians made about 9.40 million day trips there in the year to June 20263.
- About 3.23 million of them were domestic visitors1.
- The other 404,000 or so came from overseas2.
- The 2025 domestic figure comes from Tourism Research Australia's new Domestic Tourism Statistics survey, so it can't be compared directly with earlier years. On the old survey, Adelaide's 3.93 million domestic and international overnight visitors in 202489 matched its pre-pandemic 2019 level of 3.92 million1011.
How many tourists have visited Adelaide in 2026?
Adelaide had about 3.61 million overnight visits in the 12 months to June 20263. Visitors also made 9.40 million day trips to Adelaide and spent about A$7.56 billion in total.
- In the first half of 2026, Australians made about 3.91 million overnight trips in South Australia4, down 3% on 4.01 million a year earlier5, and spent about A$3.80 billion, up 15%4.
- Australians also made about 8.43 million day trips in South Australia4, up 6%5.
- International visitors made about 211,000 trips to South Australia12, down 1% on 212,00013, and spent about A$790 million, down 9%12.
- Tourism Research Australia publishes quarterly results only for South Australia as a whole, not for Adelaide. These are the latest figures available: the South Australian Tourism Commission's regional report for the year to June 2026 and Tourism Research Australia's June quarter 2026 releases. The 2026 state totals combine the March and June quarters.
| South Australia: overseas visitors by month | |||
|---|---|---|---|
| Month | 2026 | 2025 | Change |
| January | 21,970 | 21,200 | +4% |
| February | 30,340 | 25,380 | +20% |
| March | 25,340 | 24,250 | +4% |
| April | 20,360 | 19,860 | +3% |
| May | 16,730 | 18,610 | −10% |
| June | 14,180 | 15,680 | −10% |
| July | 19,280 | 21,170 | −9% |
| August | 18,660 | 17,960 | +4% |
| January–August | 166,860 | 164,110 | +2% |
Source · Data source: Australian Bureau of Statistics, Overseas Arrivals and Departures, Australia, August 2026 (Table 11).
How much do tourists spend in Adelaide?
| Overnight visitor spending in Adelaide, year ending December | ||
|---|---|---|
| Year | International | Domestic |
| 2019 | A$1.06 billion10 | A$2.81 billion11 |
| 2023 | A$1.12 billion8 | A$3.54 billion15 |
| 2024 | A$1.13 billion2 | A$3.99 billion9 |
| 2025 | A$1.55 billion2 | A$3.66 billion1 |
Source · Data source: Tourism Research Australia. Domestic spending for 2025 comes from its new Domestic Tourism Statistics survey and can't be compared directly with earlier years.
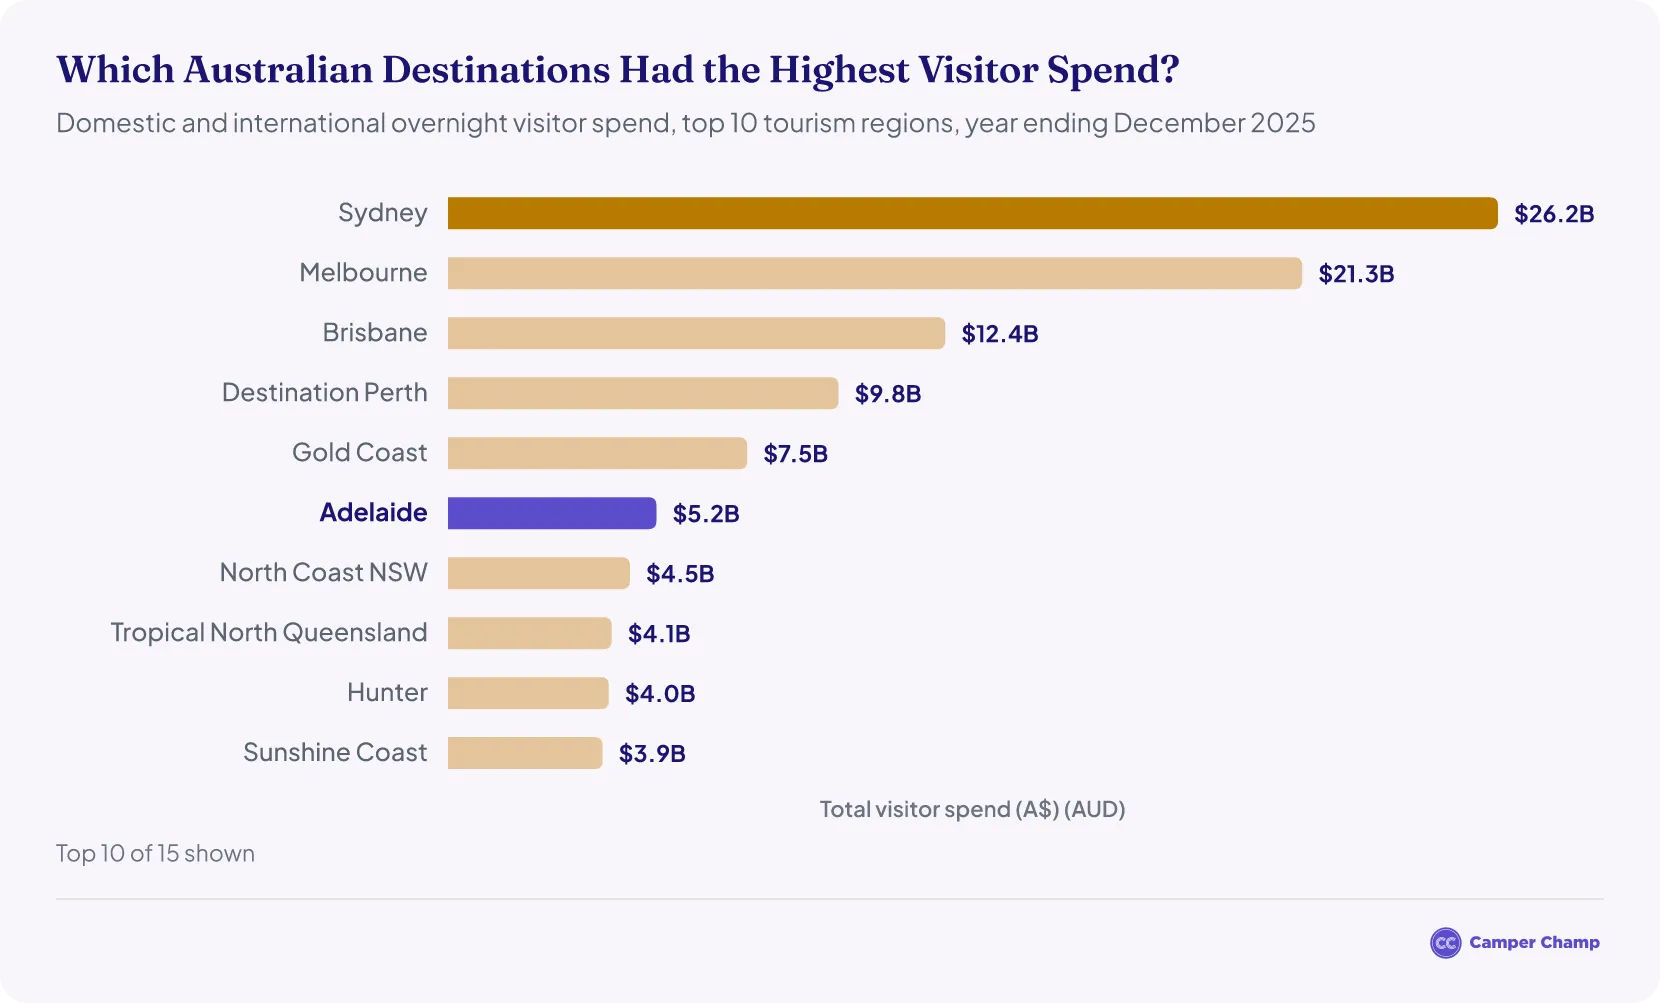
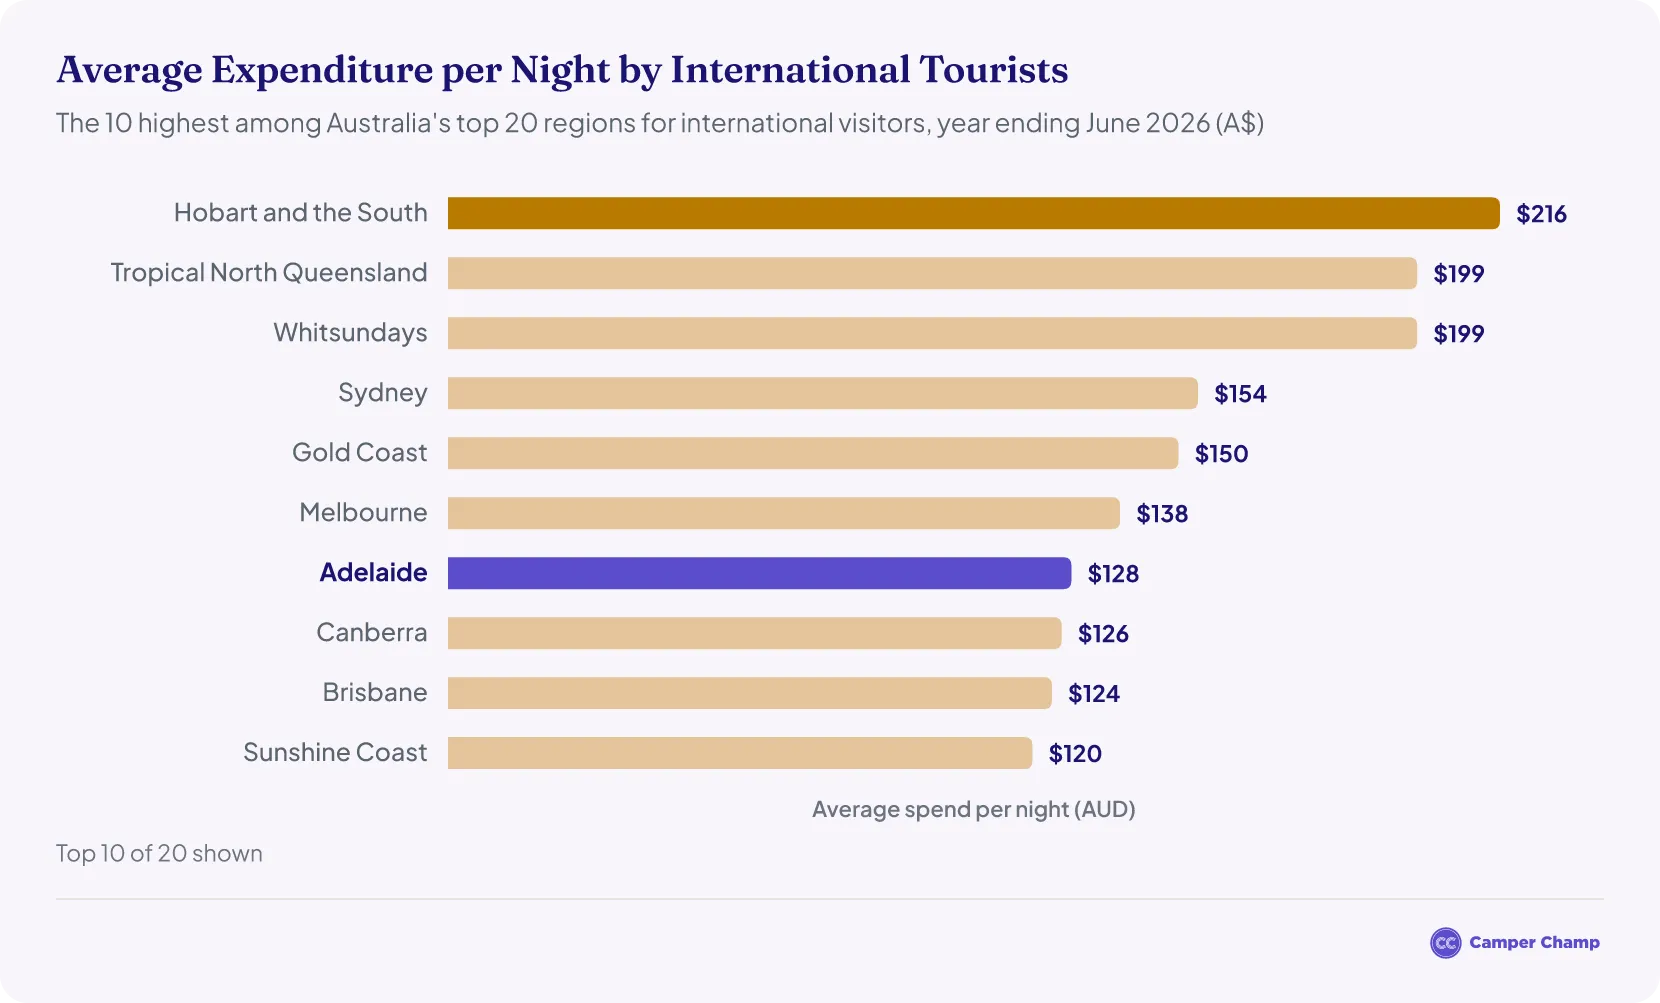
- International tourists spent an average of A$128 per night in Adelaide in the year ending June 202612.
How important is tourism to South Australia's economy?
Tourism directly contributed about A$4.5 billion to South Australia's economy in 2024–25, or 2.9% of gross state product, up 2.2% on 2023–2416.
- The industry directly employed about 39,200 people in South Australia, or 3.7% of the state's workforce16. Including indirect jobs, tourism supported 69,800 jobs.
- Visitors spent about A$12.0 billion in South Australia in the year to June 2026, and A$7.56 billion of it in Adelaide3.
- These figures come from the South Australian Tourism Commission's latest state tourism satellite account, which covers South Australia as a whole.
How many day trips are made in Adelaide?
Australians made about 9.40 million day trips to Adelaide in the year to June 2026 and spent about A$2.22 billion on them, or about A$236 per trip3. That is more than half of the 16.9 million day trips made across South Australia.
- Across South Australia, Australians made about 16.4 million day trips in 2025, up 6.1% on 20241.
- Regional figures come from Tourism Research Australia's new Domestic Tourism Statistics, so there is no like-for-like earlier figure for day trips to Adelaide.
How long do tourists stay in Adelaide?
Visitors spent about 21.7 million nights in Adelaide in the year to June 2026, more than half of them (11.5 million) by international visitors3.
Where do Adelaide's visitors come from?
South Australians made 1.78 million overnight visits to Adelaide in the year to June 20263, about half of all overnight visits. Interstate visitors made 1.43 million visits and spent about A$1.93 billion, or A$1,350 per trip, more than South Australians (A$1,090).
- International visitors made about 404,000 trips to Adelaide and spent about A$1.47 billion, an average of A$3,642 per trip3. That is about nine in ten of the 443,000 international visitors to South Australia.
- The United Kingdom is South Australia's largest international market, with 68,000 visitors in the year to June 20266, ahead of the United States (49,000), New Zealand (39,000) and China (32,000).
- Visitor numbers by country are published for South Australia as a whole, not for Adelaide alone.
When is the best time to visit Adelaide?
The summer months are South Australia's busiest time for overnight stays. Australians made about 2.10 million overnight trips in the state in the March quarter of 2025 and spent 7.49 million nights there17, more than in any other quarter. The September quarter was the quietest, with 1.75 million trips.
- Day trips peaked later in the year, at about 4.25 million in the September quarter17.
- Overseas arrivals also peak in summer: February was the busiest month of 2026 so far, with 30,340 overseas visitors planning to stay mainly in South Australia14.
- These quarterly figures cover all of South Australia; they are not published for Adelaide alone.
| South Australia: domestic travel by quarter | |||
|---|---|---|---|
| Quarter (2025) | Overnight trips | Visitor nights | Day trips |
| March quarter | 2.10 million | 7.49 million | 3.91 million |
| June quarter | 1.91 million | 6.22 million | 4.02 million |
| September quarter | 1.75 million | 5.43 million | 4.25 million |
| December quarter | 2.05 million | 6.43 million | 4.20 million |
Source · Data source: Tourism Research Australia, Domestic Tourism Statistics (December quarter 2025 release).
Adelaide visitor numbers by year
| Year | Period | Total overnight visitors | International visitors | Domestic overnight visitors | Visitor spending |
|---|---|---|---|---|---|
| 2026 (latest) | Year ending June 20263 | 3.61 million | 404,000 | 3.21 million | A$5.34 billion |
| 2025 | Year ending December 202512 | 3.64 million | 404,000 | 3.23 million | A$5.21 billion |
| 2024 | Year ending December 202498 | 3.93 million | 402,000 | 3.53 million | A$5.12 billion |
| 2023 | Year ending December 202398 | 3.44 million | 412,000 | 3.03 million | A$4.66 billion |
| 2022 | Year ending December 202218 | Not published | Not published | 2.93 million | A$3.21 billion (domestic only) |
| 2021 | Year ending December 202118 | Not published | Not published | 1.98 million | A$1.90 billion (domestic only) |
| 2020 | Year ending June 20201920 | 2.96 million | 319,000 | 2.64 million | A$2.98 billion |
| 2019 | Year ending December 20191110 | 3.92 million | 437,000 | 3.48 million | A$3.87 billion |
Source · Data source: Tourism Research Australia (International Visitor Survey, National Visitor Survey and Domestic Tourism Statistics) and South Australian Tourism Commission.
What are the most visited places in Adelaide and South Australia?
Adelaide Central Market draws about 8 million visitors a year, according to the City of Adelaide7. Beyond the city, the Fleurieu Peninsula is South Australia's most visited region, with about 1.14 million overnight visits in the year to June 2026, followed by Yorke Peninsula (765,000) and the Limestone Coast (717,000)3.
- In the city itself, Adelaide Botanic Garden recorded 1,925,631 visits in 2024–25, boosted by the Chihuly exhibition21, while the South Australian Museum welcomed 693,241 onsite visitors22 and the Art Gallery of South Australia 504,37323.
- More than 1.18 million fans went through the gates of Adelaide Oval during the 2026 AFL season24.
- The Adelaide Hills and the Barossa draw more day-trippers than overnight visitors, with about 1.28 million and 1.00 million day trips a year3.
- Kangaroo Island had the fewest overnight visits of any region (107,000), but about a quarter of them (26,000) were by international visitors3.
- Regional figures come from Tourism Research Australia's new Domestic Tourism Statistics and can't be compared with earlier regional reports.
| South Australian tourism regions | |||||
|---|---|---|---|---|---|
| Rank | Region | Overnight visits | International visits | Day trips | Visitor spending |
| 1 | Adelaide | 3,614,000 | 404,000 | 9,401,000 | A$7.56 billion |
| 2 | Fleurieu Peninsula | 1,135,000 | 20,000 | 1,592,000 | A$740 million |
| 3 | Yorke Peninsula | 765,000 | 8,000 | 795,000 | A$444 million |
| 4 | Limestone Coast | 717,000 | 24,000 | 677,000 | A$563 million |
| 5 | Flinders Ranges and Outback | 670,000 | 17,000 | 413,000 | A$467 million |
| 6 | Murray River, Lakes and Coorong | 608,000 | 7,000 | 776,000 | A$391 million |
| 7 | Eyre Peninsula | 493,000 | 11,000 | 346,000 | A$421 million |
| 8 | Riverland | 474,000 | 7,000 | 346,000 | A$332 million |
| 9 | Barossa | 376,000 | 10,000 | 1,003,000 | A$391 million |
| 10 | Adelaide Hills | 277,000 | 17,000 | 1,283,000 | A$305 million |
| 11 | Clare Valley | 184,000 | 7,000 | 198,000 | A$162 million |
| 12 | Kangaroo Island | 107,000 | 26,000 | 48,000 | A$115 million |
Source · Data source: South Australian Tourism Commission, Visit to SA Regions, year ending June 2026 (Tourism Research Australia Domestic Tourism Statistics and International Visitor Survey).
What are the biggest events in Adelaide?
Adelaide Fringe is the city's biggest event, with more than 6 million attendances across ticketed and free events in 2026 and 1,083,014 tickets sold25.
- The Santos Tour Down Under cycling race drew 749,953 spectators in 202626.
- More than 115,000 fans attended LIV Golf Adelaide over four days in February 202627, and 43% of attendees travelled from outside South Australia28.
- An estimated 285,700 people attended the bp Adelaide Grand Final Supercars race (formerly the Adelaide 500) in 2025, including 66,462 visitors from interstate and overseas29.
- Attendance figures count visits, so a person who goes to several shows or days is counted more than once.
More Australian tourism statistics
- Australia Tourism Statistics
- Bondi Beach Tourism Statistics
- Byron Bay Tourism Statistics
- Cairns Tourism Statistics
- Darwin Tourism Statistics
- Fraser Island Tourism Statistics
- Great Barrier Reef Tourism Statistics
- Melbourne Tourism Statistics
- Rottnest Island Tourism Statistics
- Sydney Opera House Tourism Statistics
- Tasmania Tourism Statistics
- Whitsundays Tourism Statistics
How many tourists visit South Australia each year?
Over 8.2 million overnight travellers visited South Australia in 2025, made up of 7.8 million domestic overnight trips1 and about 445,000 international visitors2.
- For more, see our South Australia tourism statistics.
How many people camp in South Australia?
Australians took about 1.24 million caravan and camping trips in South Australia in 2024, down 1% on 2023, and spent about 4.37 million nights there, down 9%30.
- Caravan and camping travellers chose shorter trips closer to home in 2024, which cut interstate travel to South Australia30.
- These figures cover all of South Australia and are the latest available: the Caravan Industry Association's 2026 report, which covers 2025, publishes only national figures, with a state breakdown available on request.
Where do people camp in South Australia?
- Commercial caravan parks and camping grounds take the biggest share of domestic visitor nights in the Flinders Ranges and Outback (27% in 2024)31, the Riverland (24%)32, the Barossa (23%)33, the Clare Valley (23%)34 and the Fleurieu Peninsula (20%)35.
- They take a smaller share on Yorke Peninsula (18%)36, along the Murray River, Lakes and Coorong (16%)37, in the Adelaide Hills (13%)38, on the Eyre Peninsula (12%)39, on the Limestone Coast (12%)40 and on Kangaroo Island (11%)41.
- Free and other non-commercial camping is most common along the Murray River, Lakes and Coorong (16% of domestic nights)37, on the Limestone Coast (11%)40 and on Yorke Peninsula (10%)36.
- In Adelaide itself, commercial caravan parks and camping grounds account for only about 3% of domestic visitor nights and 0% of international visitor nights15.
- These regional shares come from the South Australian Tourism Commission's 2024 regional profiles; its latest Adelaide profile is for 2023. The caravan-park shares count commercial parks and camping grounds only; the profiles' summary text adds free camping, so it quotes higher shares (28% for the Barossa, for example). See also our Australia camping statistics.
FAQs
Is tourism in Adelaide growing?
International visitors spent A$1.55 billion in Adelaide in 2025, up 37% on 20242. Domestic figures for 2025 come from a new survey, so they can't be compared with earlier years.
How much do visitors spend per trip in Adelaide?
In the year to June 2026, interstate visitors spent about A$1,350 per trip and South Australians about A$1,090, while international visitors spent about A$3,6423. Day-trippers spent about A$236 each.
When do most overseas visitors arrive in South Australia?
February was the busiest month in 2026, with 30,340 short-term overseas visitors planning to stay mainly in South Australia, followed by March with 25,34014.
What is the busiest time of year in Adelaide?
Summer is the busiest season. Australians made about 2.10 million overnight trips in South Australia in the March quarter of 202517, more than in any other quarter, and the Tour Down Under, LIV Golf Adelaide and the Adelaide Fringe all run between January and March.
How many people go to the Adelaide Fringe?
The 2026 Adelaide Fringe recorded more than 6 million attendances across ticketed and free events and sold 1,083,014 tickets25.
Campervan hire in Australia
- Adelaide campervan rental
- Brisbane
- Broome motorhome hire
- Cairns motorhome hire
- Campervan hire in Alice Springs
- Campervan hire in Launceston
- Darwin campervan rental
- Devonport
- Gold Coast motorhome hire
- Hobart campervan rental
- Melbourne
- Perth
- Sydney motorhome hire
- Tasmania campervan rental
References
- Domestic Tourism Statistics Snapshot, year ending December 2025 (Tourism and Events Queensland) · teq.queensland.com ↑ b c d e f g h i j k
- International tourism results — year ending December 2025 (International Visitor Survey) · Tourism Research Australia ↑ b c d e f g h i j k l m
- Visit to SA Regions — year ending June 2026 (South Australian Tourism Commission) · tourism.sa.gov.au ↑ b c d e f g h i j k l m n o p q r
- Domestic Tourism Statistics results — June quarter 2026 compared to June quarter 2025 (Tourism Research Australia) · Tourism Research Australia ↑ b c d e
- Domestic Tourism Statistics results — March quarter 2026 compared to March quarter 2025 (Tourism Research Australia) · Tourism Research Australia ↑ b c
- International Performance to June 2026 — South Australia (South Australian Tourism Commission) · tourism.sa.gov.au ↑ b
- Market Square and Central Market expansion (City of Adelaide) · cityofadelaide.com.au ↑ b c
- IVS results for the year ending December 2024 compared to December 2023 · Tourism Research Australia ↑ b c d
- NVS results data tables for the year ending December 2024 compared to December 2023 (Tourism Research Australia) · Tourism Research Australia ↑ b c d
- IVS results for the year ending December 2024 compared to December 2019 · Tourism Research Australia ↑ b c d
- NVS results data tables for the year ending December 2023 compared to December 2019 (Tourism Research Australia) · Tourism Research Australia ↑ b c
- International tourism results — year ending June 2026 (International Visitor Survey) · Tourism Research Australia ↑ b c d
- International tourism results — March quarter 2026 (International Visitor Survey) · Tourism Research Australia ↑
- Overseas Arrivals and Departures, Australia, August 2026 — Table 11: Short-term visitors arriving, state of intended stay (ABS) · Australian Bureau of Statistics ↑ b c
- Regional Profile – Adelaide, year end December 2023 (South Australian Tourism Commission) · tourism.sa.gov.au ↑ b
- State Tourism Satellite Account 2024–25 snapshot — South Australia (South Australian Tourism Commission) · tourism.sa.gov.au ↑ b
- Domestic Tourism Statistics results — December quarter 2025 (Tourism Research Australia) · Tourism Research Australia ↑ b c d
- National Visitor Survey results tables, year ending December 2022 (Tourism Research Australia) · Tourism Research Australia ↑ b
- National Visitor Survey results, year ending June 2020 (Tourism Research Australia) · Tourism Research Australia ↑
- International Visitor Survey results, year ending June 2020 (Tourism Research Australia) · Tourism Research Australia ↑
- 2024/25 Annual Report – Board of the Botanic Gardens and State Herbarium · data.sa.gov.au ↑ b
- South Australian Museum 2024-25 Annual Report · samuseum.sa.gov.au ↑
- Art Gallery of South Australia 2024-25 Annual Report · agsa-prod.s3.amazonaws.com ↑
- More Than a Million Fans Make 2026 an AFL Season to Remember · adelaideoval.com.au ↑
- Adelaide Fringe delivers major benefits for South Australia · weare.sa.gov.au ↑ b
- FAQs | Santos Tour Down Under · tourdownunder.com.au ↑
- LIV Golf Adelaide sets a new benchmark for golf events worldwide · tourism.sa.gov.au ↑
- LIV Golf Adelaide 2026 Delivers $69.8 million USD ($97.1 million AUD) Economic Impact for South Australia · livgolf.com ↑
- bp Adelaide Grand Final economic benefit tops $100 million for the first time · adelaidegrandfinal.com.au ↑
- Caravan and Camping State of Industry 2025 (Caravan Industry Association of Australia) · assets.pc.gov.au ↑ b
- Regional Profile – Flinders Ranges and Outback, year end December 2024 (South Australian Tourism Commission) · tourism.sa.gov.au ↑
- Regional Profile – Riverland, year end December 2024 (South Australian Tourism Commission) · tourism.sa.gov.au ↑
- Regional Profile – Barossa, year end December 2024 (South Australian Tourism Commission) · tourism.sa.gov.au ↑
- Regional Profile – Clare Valley, year end December 2024 (South Australian Tourism Commission) · tourism.sa.gov.au ↑
- Regional Profile – Fleurieu Peninsula, year end December 2024 (South Australian Tourism Commission) · tourism.sa.gov.au ↑
- Regional Profile – Yorke Peninsula, year end December 2024 (South Australian Tourism Commission) · tourism.sa.gov.au ↑ b
- Regional Profile – Murray River, Lakes and Coorong, year end December 2024 (South Australian Tourism Commission) · tourism.sa.gov.au ↑ b
- Regional Profile – Adelaide Hills, year end December 2024 (South Australian Tourism Commission) · tourism.sa.gov.au ↑
- Regional Profile – Eyre Peninsula, year end December 2024 (South Australian Tourism Commission) · tourism.sa.gov.au ↑
- Regional Profile – Limestone Coast, year end December 2024 (South Australian Tourism Commission) · tourism.sa.gov.au ↑ b
- Regional Profile – Kangaroo Island, year end December 2024 (South Australian Tourism Commission) · tourism.sa.gov.au ↑