

Updated
At a glance
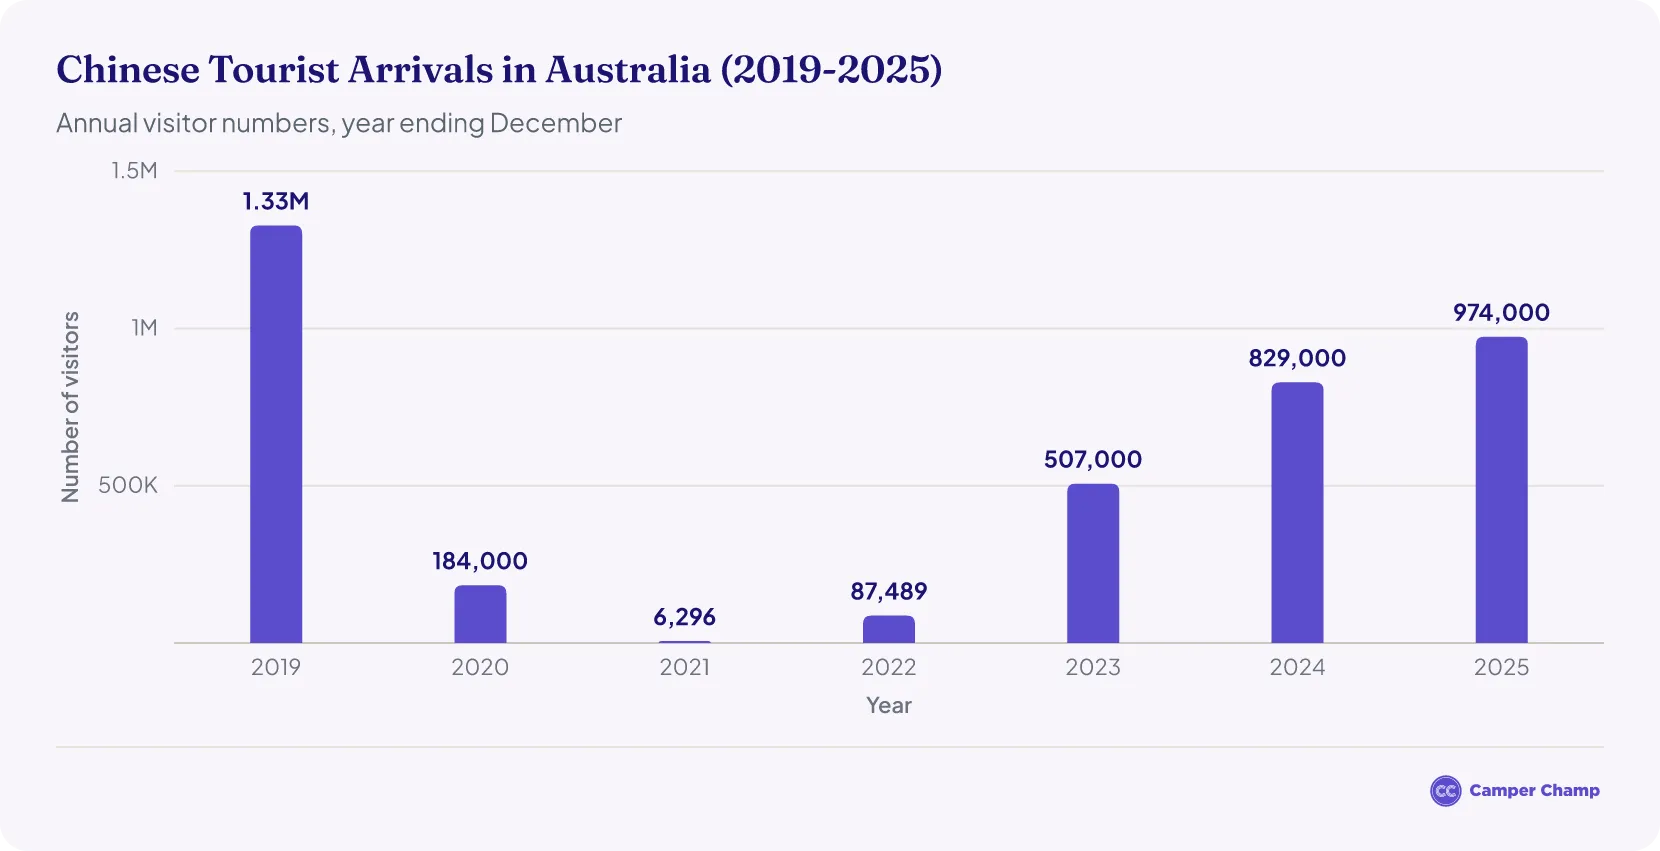
- 974,000 Chinese visitors came to Australia in 2025, up 17.5% on 2024 but still 26.6% below 2019.1
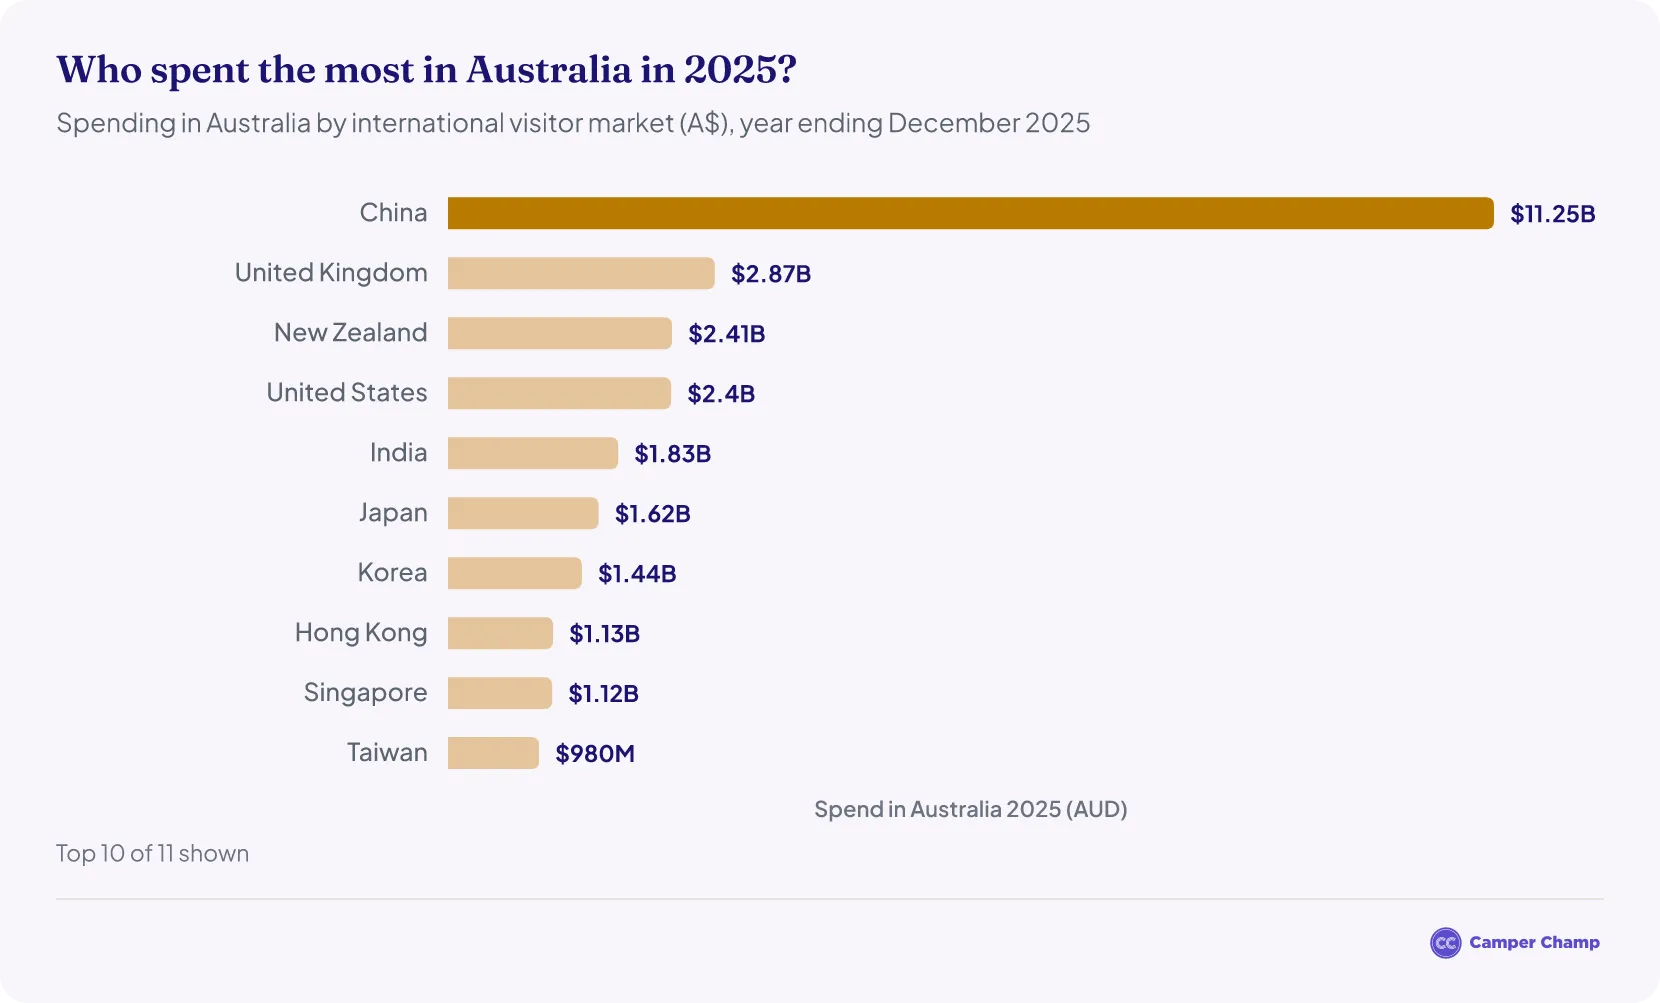
- China was Australia's second-largest source of visitors in 2025, behind New Zealand.2
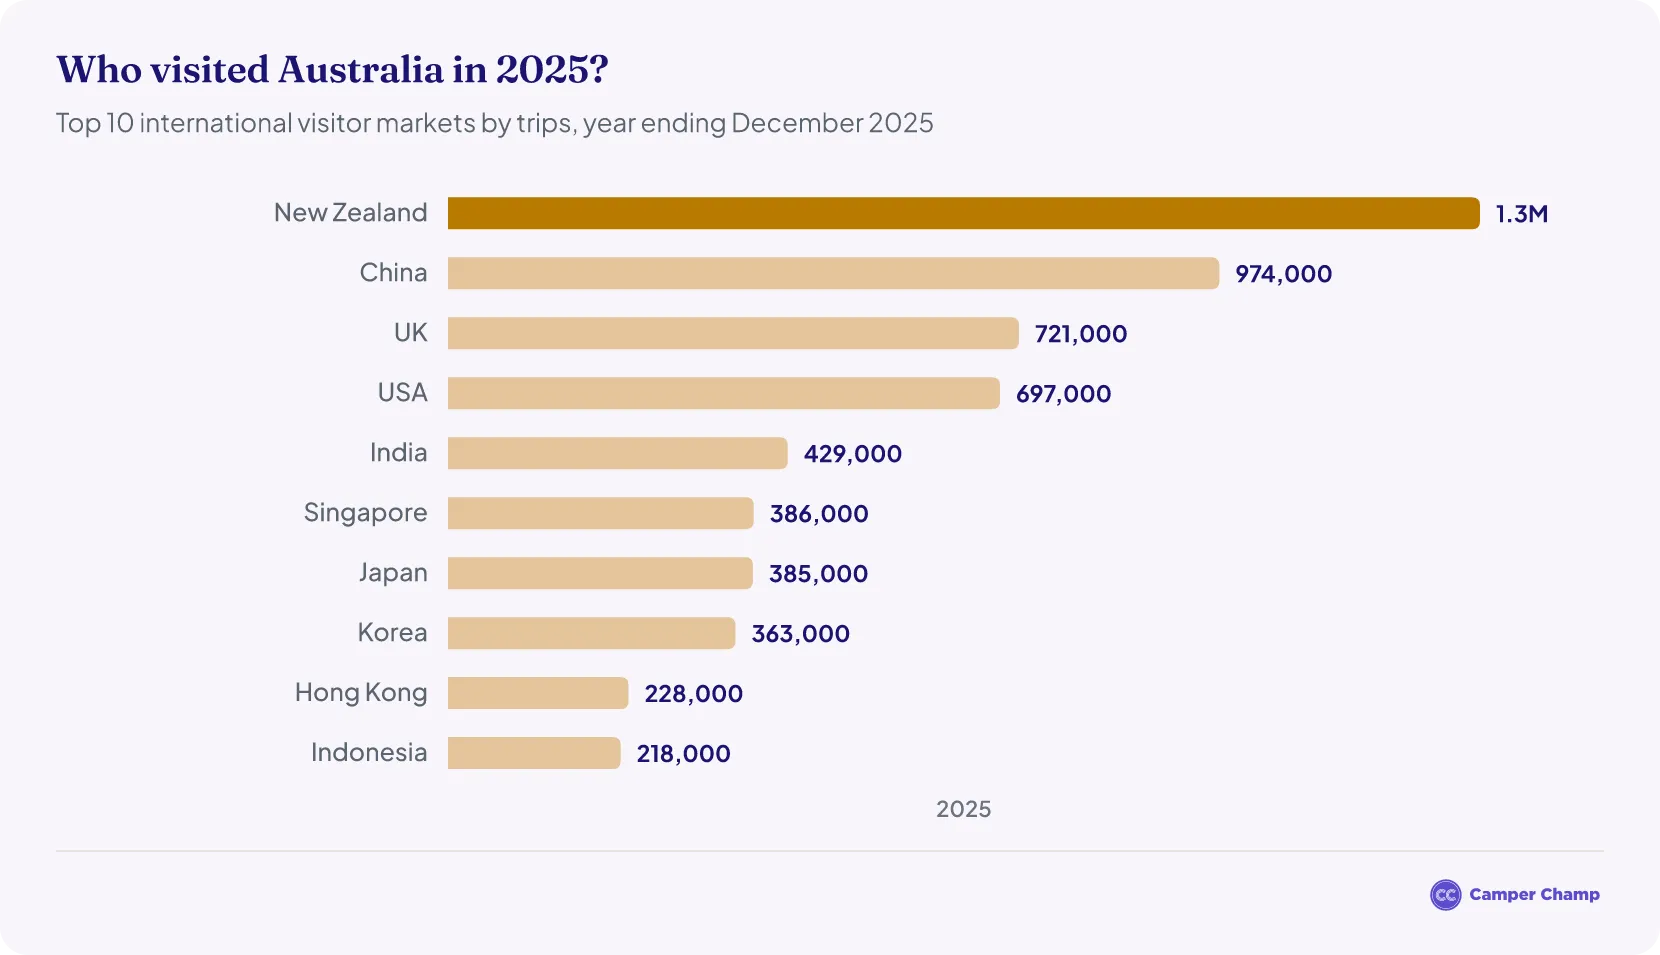
- Chinese visitors were the biggest spenders: $11.25 billion in Australia in 2025, or 28.7% of all international visitor spending.2
- In the year ending June 2026, over 1.05 million Chinese visitors came to Australia, up 18.3%.3
- China is the largest source of international students in Australia (23% of students in the year to June 2026)4, and education was Chinese visitors' biggest spending item in 2025.
- Only 16% of Chinese visitors travelled beyond the capital cities and the Gold Coast in 2025.5
How many Chinese tourists visit Australia each year?
About 974,000 Chinese visitors travelled to Australia in 2025.2
- That is up 17.5% on 2024, when 829,000 Chinese visitors came.2
- It is still 26.6% below 2019, when 1.33 million Chinese visitors made China Australia's largest source of visitors.1
- In 2025, China was Australia's second-largest source of visitors, behind New Zealand.2
| Chinese visitors to Australia by year (2019–2025) | ||
|---|---|---|
| Year | Chinese visitors | Change on previous year |
| 2019 | 1,328,0001 | – |
| 2020 | 184,000 | −86.1% |
| 2021 | 6,296 | −96.6% |
| 2022 | 87,489 | +1,289.6% |
| 2023 | 507,0006 | +479.5% |
| 2024 | 829,0002 | +63.5% |
| 2025 | 974,0002 | +17.5% |
Source · Tourism Research Australia, International Visitor Survey (trips by visitors aged 15 and over, year ending December).
How many Chinese tourists have visited Australia in 2026?
Over 1.05 million Chinese visitors travelled to Australia in the year ending June 2026, an 18.3% increase on the year ending June 2025.3
- Chinese visitors spent $11.75 billion in Australia over the same 12 months, up 22.7%.3
- In the June quarter of 2026, around 205,000 Chinese visitors came to Australia, 5.1% more than in the June quarter of 2025.3
- In August 2026, 106,990 short-term visitors arrived from China, up 8.4% on August 2025 and second only to New Zealand (110,210). That is still about 17% below the 128,280 Chinese arrivals in August 2019.7
- Adding up the monthly figures, 821,050 short-term visitors arrived from China between January and August 2026, 13.8% more than in the same months of 2025 and about 80% of the 2019 level. February was the busiest month, as Chinese New Year fell in mid-February in 2026 (it was in late January in 2025).
Full-year 2026 figures are not out yet. The latest annual figures cover the year to June 2026, and the August 2026 arrivals are provisional.
| Chinese arrivals in Australia by month (2026 vs 2025 and 2019) | ||||
|---|---|---|---|---|
| Month | 2019 | 2025 | 2026 | 2026 vs 2025 |
| January | 142,850 | 114,660 | 78,4008 | −31.6% |
| February | 206,280 | 122,680 | 220,1709 | +79.5% |
| March | 124,370 | 70,990 | 87,56010 | +23.3% |
| April | 96,240 | 73,770 | 81,58011 | +10.6% |
| May | 94,690 | 67,350 | 69,94012 | +3.8% |
| June | 80,680 | 60,200 | 58,97013 | −2.0% |
| July | 150,390 | 112,900 | 117,44014 | +4.0% |
| August | 128,280 | 98,720 | 106,9907 | +8.4% |
Source · Australian Bureau of Statistics, Overseas Arrivals and Departures, Australia (short-term visitor arrivals from China, excluding SARs and Taiwan; each month as first published, the latest month provisional).
China’s share in the Australian tourism industry
How much did Chinese tourists spend in Australia in 2025?
Chinese visitors spent $11.25 billion in Australia in 2025, up 39.4% from $8.07 billion in 2024.2 Including airfares and other trip costs, their spending rose 34.6%, from $9.77 billion to $13.16 billion.
- Spending in Australia is now 8.8% above its 2019 level of $10.34 billion.1 Total trip spending is 6.1% higher too, up from $12.40 billion to $13.16 billion.2
- Even though China ranks second for visitor numbers, Chinese visitors are still the biggest spenders in Australia, as they have been for years.2
| Tourism Spending by Chinese Visitors in Australia — Year Ending December (A$) | ||
|---|---|---|
| Year | Spend in Australia | Total Trip Spend |
| 2019 | 10.34 B1 | 12.40 B1 |
| 2020 | – | 2.68 B |
| 2021 | 0.11 B | 0.16 B |
| 2022 | 1.62 B | 1.93 B |
| 2023 | 5.82 B | 6.94 B6 |
| 2024 | 8.07 B2 | 9.77 B2 |
| 2025 | 11.25 B2 | 13.16 B2 |
Source · Note: “Spend in Australia” is spending within Australia, while “Total Trip Spend” includes all trip expenses, including those outside Australia such as international flights and pre-trip costs.
China’s contribution to tourism expenditure in Australia
What do Chinese tourists spend on in Australia?
In 2025, Chinese visitors spent $13.16 billion on their trips to Australia, and more than two-thirds of it went on education and on food, drink and accommodation.2
- Education: $4.73 billion (36%)
- Food, drink and accommodation: $4.27 billion (32%)
- Airfares: $1.36 billion (10%)
- Shopping: $1.14 billion (9%)
- Other spending: $0.63 billion (5%)
- Tours: $0.44 billion (3%)
- Transport: $0.39 billion (3%)
- Entertainment: $0.19 billion (1%)2
Chinese visitors accounted for more than half (56%) of all the money international visitors spent on education in Australia in 2025, and 26% of everything international visitors spent on shopping.2
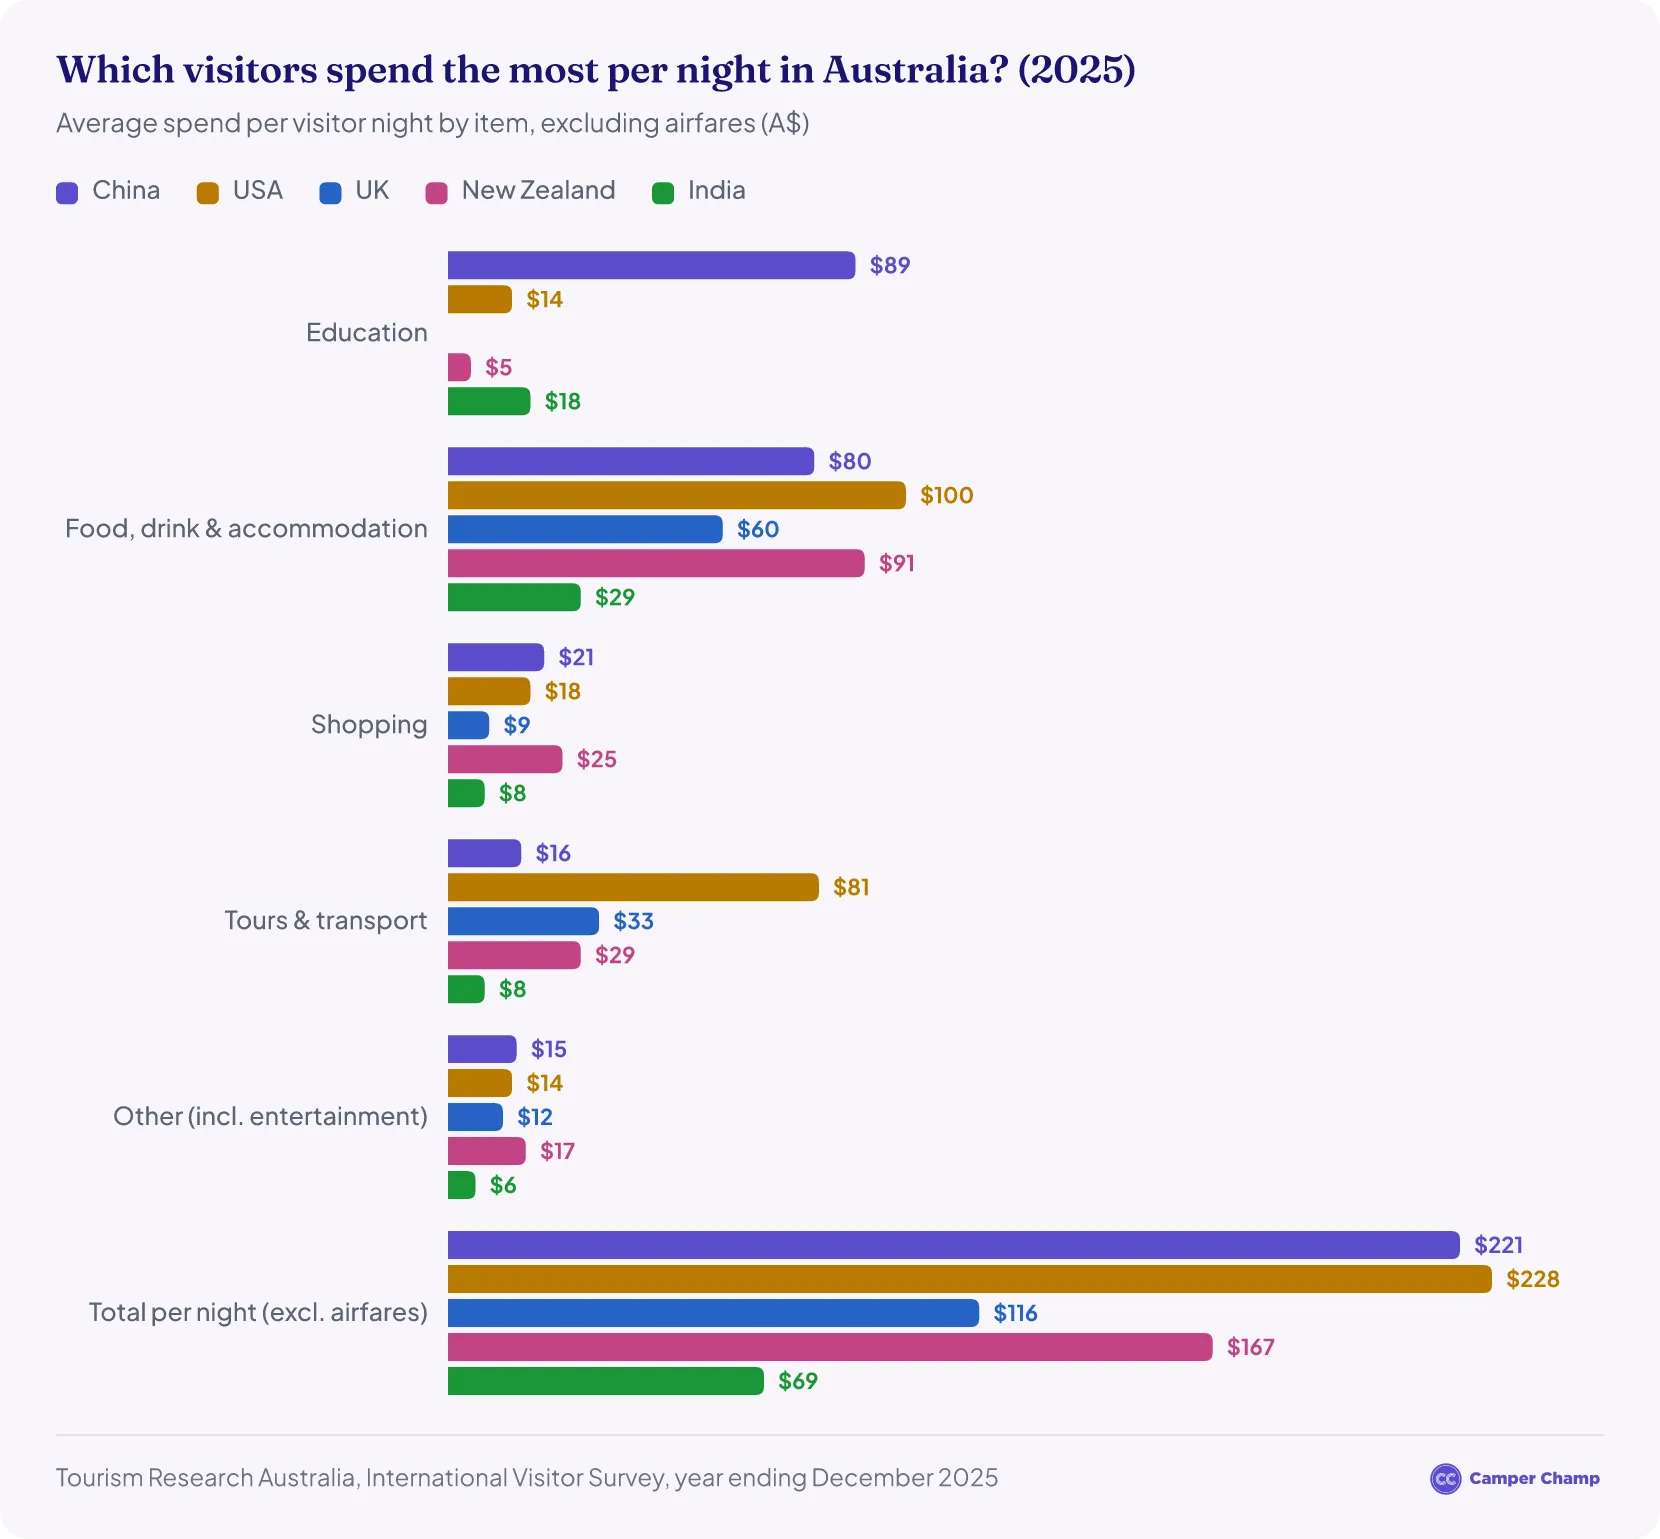
Per night, Chinese visitors spent about $221 in 2025, excluding airfares. Among the top five markets, only Americans spent more ($228), and Chinese visitors were well ahead of New Zealanders ($167), Britons ($116) and Indians ($69).2 Education alone came to $89 a night, far more than for any other market, as the chart below shows.
How many Chinese students are in Australia?
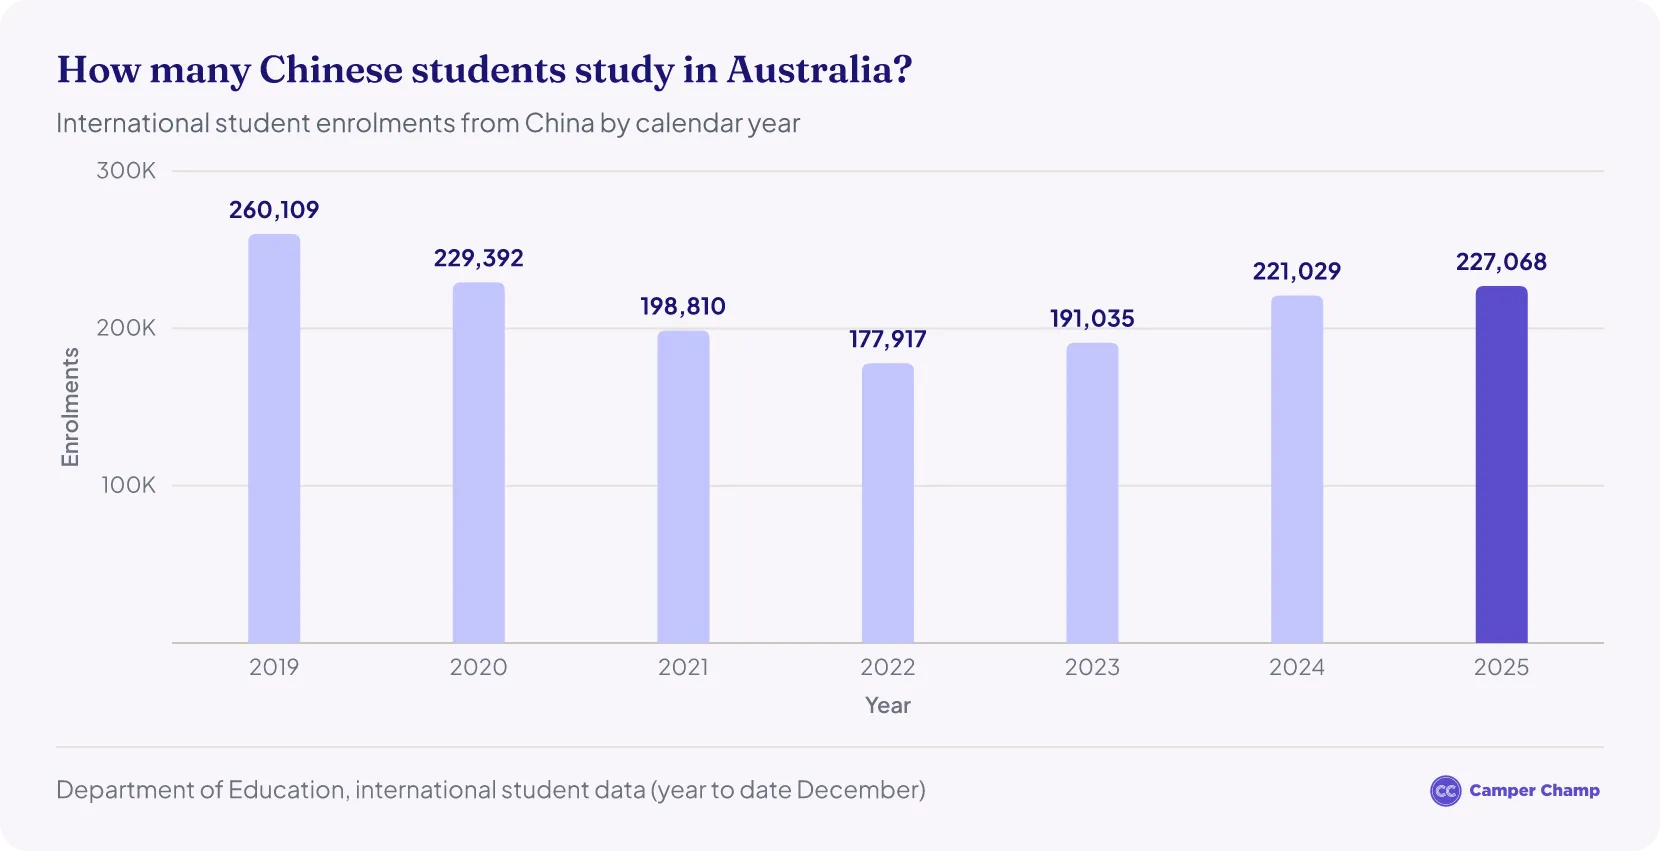
China is Australia's largest source of international students. In the year to June 2026, 23% of the 687,810 international students in Australia were from China, ahead of India (16%) and Nepal (9%).4
- On 30 June 2025, 102,990 Chinese citizens held a student visa in Australia, just behind India (107,038).15
- The chart below tracks enrolments from China by year since 2019.
- China was also the top country for student visa grants in the 2024–25 program year, with 88,014 grants, ahead of India (48,536).15
- Students help explain why Chinese visitors stay so long and spend so much: education was the biggest item in Chinese visitors' spending in 2025, at $4.73 billion.2
China’s Capability to Travel
- China's sheer size makes it one of the biggest sources of international tourists for many countries, Australia included.
- Chinese travellers made more than 1 billion international trips between 2009 and 2018, according to COTRI, including 160 million in 2018 alone.16
- Around 13% of mainland residents, or about 180 million people, hold a passport, which makes China the biggest potential source of international travellers.16
- That share is still low, and as more Chinese residents get passports in the coming years, the number of Chinese travellers is expected to keep growing.
Chinese Travellers’ Top Destinations
- According to COTRI, the 10 most popular international destinations for Chinese travellers are Hong Kong, Macau, Thailand, Japan, South Korea, Vietnam, Singapore, the US, Italy and Malaysia.
- Australia is not in that top 10, yet China is its most valuable tourism market.
- Many Chinese travellers still head to Hong Kong, Macau and Taiwan, but more choose destinations further afield each year.
Do Chinese tourists go camping in Australia?
There is no current national count of Chinese visitors who hire campervans or stay in caravan parks: the caravan industry's latest national report includes no international visitor figures.17 What data there is shows most Chinese visitors stick to the cities, though those who venture further tend to stay a while.
- Only 16% of Chinese visitors travelled beyond the capital cities and the Gold Coast in 2025, compared with 29% of all international visitors.5
- Most travel independently. Outside Western Australia, 86% of Chinese leisure visitors travel on their own rather than with a tour group (2024–25 average).18
- In 2017, the latest national figure, 14,175 Chinese visitors spent more than 124,000 nights in Australian caravan parks, a 180% increase in nights on 2016.19
- In a Caravan Industry Association survey of Chinese visitors in Victoria in 2018, 80% had never stayed in a caravan park before.20
- China was not among the top three international markets for caravan and camping in New South Wales in 2025: those were the UK, Germany and New Zealand.21
- Tasmania welcomed 31,800 Chinese visitors in the year ending March 2026 (up 58.9%), who stayed 410,000 nights, an average of 12.9 nights each.22
Where do Chinese tourists go in Australia?
Most Chinese visitors head to New South Wales and Victoria. Of the 106,990 short-term visitors who arrived from China in August 2026, by state of intended stay:
- New South Wales: 48,470 (45%)
- Victoria: 35,480 (33%)
- Queensland: 12,960 (12%)
- Western Australia: 5,360 (5%)
- South Australia: 2,760 (3%)
- ACT: 1,130 (1%)
- Tasmania: 560 (0.5%)
- Northern Territory: 270 (0.3%)7
China was the top source of visitors to New South Wales, Victoria, South Australia and the ACT in August 2026.7
Campervan hire in Australia
Growth in Chinese visits to Australia
- Students are a big part of Chinese travel to Australia: in the 12 months to November 2019, almost 275,000 of the 1.44 million Chinese visits (about 20%) were for study, compared with less than 1% of visits by New Zealanders. Chinese students accounted for almost 58% of all the money spent by Chinese visitors.23
- In the year ending February 2018, China became the top source of international visitors to Australia for the first time, overtaking New Zealand: 1.39 million Chinese visitors against 1.36 million from New Zealand.24
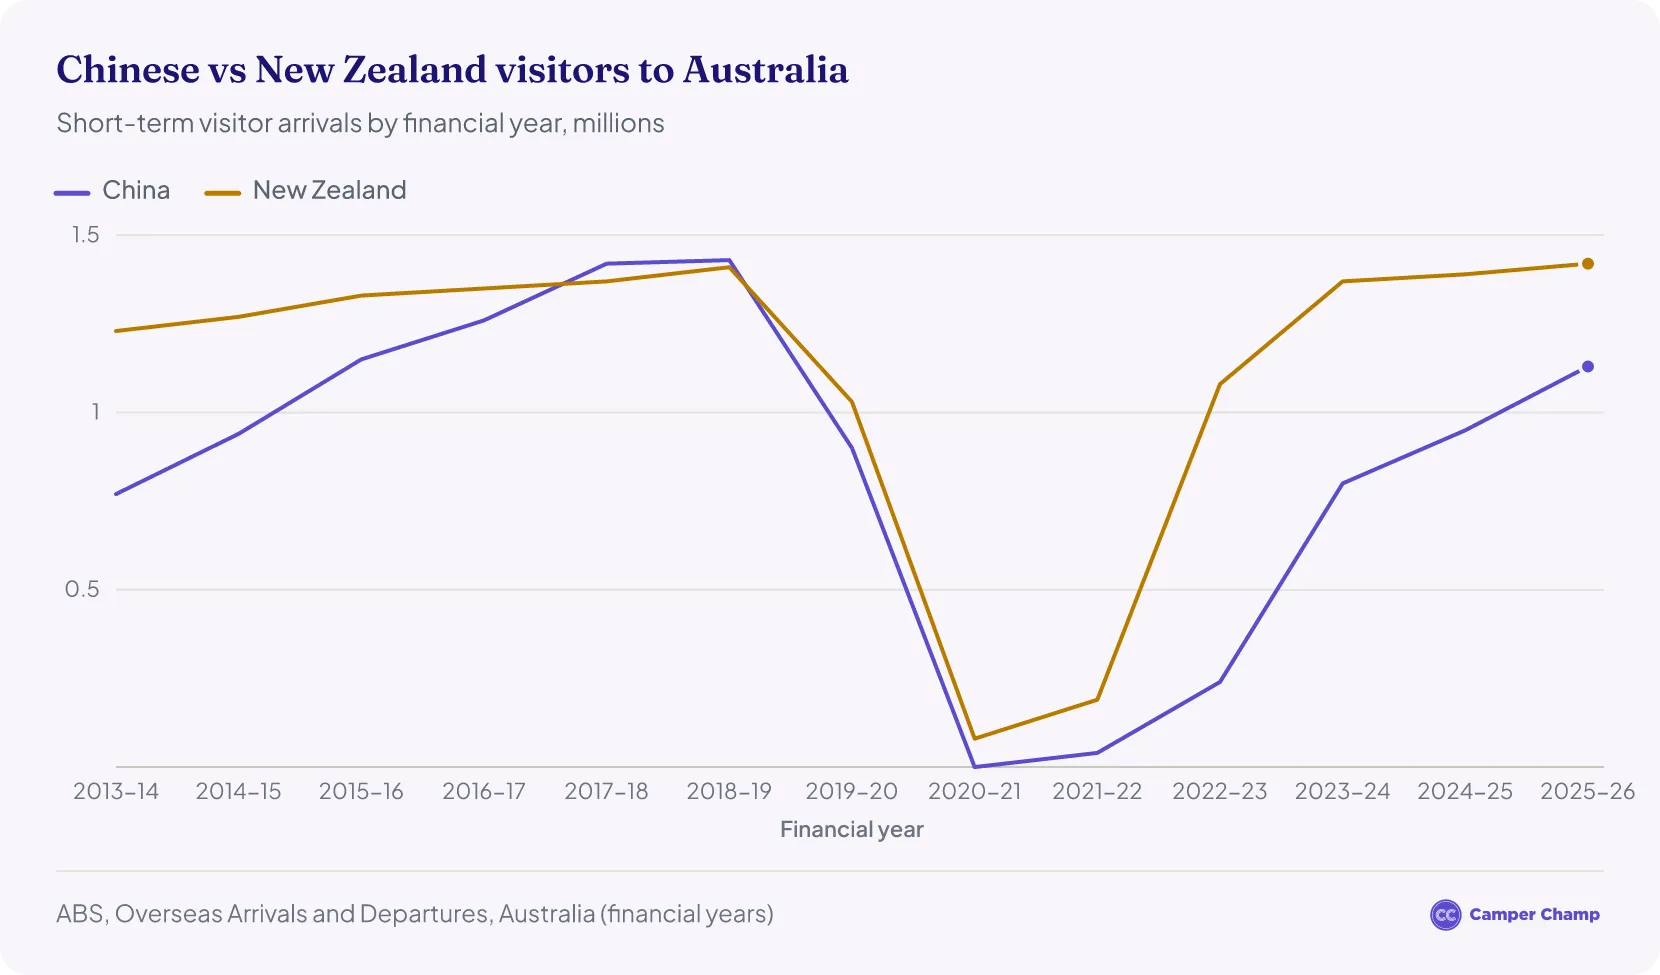
- The potential for further growth is still significant: in 2019, only around 13% of mainland Chinese residents held a valid passport,16 compared with about 75% of New Zealand citizens (2015 figure).25
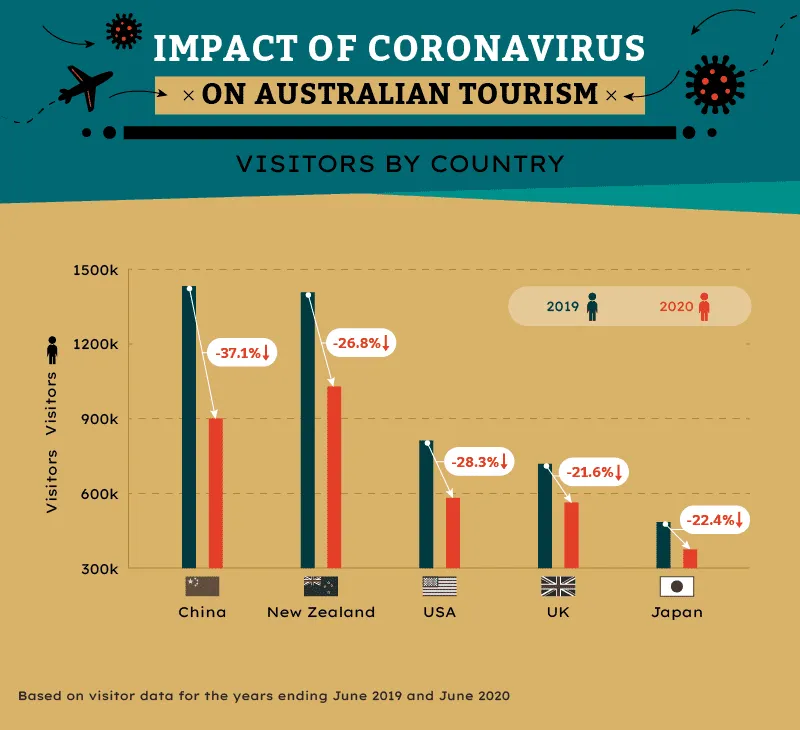
- Chinese visitor growth slowed sharply in 2019: the number of visitors from China grew just over 1% in the 12 months to July 2019, matching the weakest rate in nine years.26
Why did Chinese visitor growth to Australia slow down in 2019?
Growth in both Chinese visitors and Chinese students slowed sharply in 2019.
This slowdown has been attributed to:
- a slowing of the Chinese economy
- the ongoing US-China trade dispute26
- a growing number of attractive alternative educational options for Chinese students, including New Zealand, the UK and Canada.
Impact of the coronavirus on Chinese visitors and spending
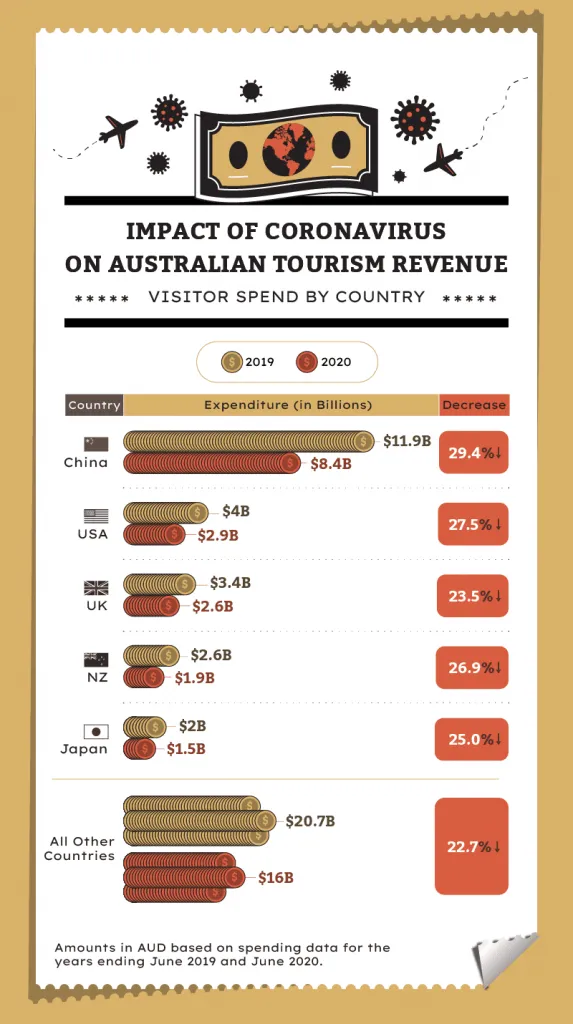
Chinese visitors spent $8.4 billion on trips to Australia in the year ending June 2020.
- That was 29.4% less than the $11.9 billion spent the year before.
- Chinese visitors have long been the biggest spenders in Australia, largely because of what they spend on education.
Chinese tourism in Australia: quick answers
Is China Australia's biggest source of tourists?
No. China was Australia's second-largest source of international visitors in 2025, with 974,000 trips (11.8% of all international visitor trips), behind New Zealand's 1.30 million.2 Before the pandemic, in 2019, China was the largest.
How much does a Chinese tourist spend in Australia?
On average, Chinese visitors spent about $11,500 per trip within Australia in 2025 ($11.25 billion across 974,000 trips).2 Including airfares and other costs outside Australia, the average trip cost about $13,500.
How long do Chinese tourists stay in Australia?
Chinese visitors spent 53.4 million nights in Australia in 2025, an average of about 55 nights per trip, compared with about 12 nights for visitors from New Zealand.2 The long average reflects the many Chinese students in Australia: education was the biggest item in Chinese visitors' spending.
Other Resources
- Australia Tourism Statistics
- Hong Kong Tourism in Australia Statistics
- Indian Tourism in Australia Statistics
- Japanese Tourism in Australia Statistics
- Malaysia Tourism in Australia Statistics
- New Zealand Tourism in Australia Statistics
- Singapore Tourism in Australia Statistics
- South Korea Tourism in Australia Statistics
- UK Tourism in Australia Statistics
- USA Tourism in Australia Statistics
References
- IVS results for the year ending December 2024 compared to December 2019 · Tourism Research Australia ↑ b c d e f g
- International tourism results — year ending December 2025 (International Visitor Survey) · Tourism Research Australia ↑ b c d e f g h i j k l m n o p q r s t u v w x y
- International tourism results — year ending June 2026 (International Visitor Survey) · Tourism Research Australia ↑ b c d
- International student monthly summary — year to date June 2026 (Department of Education) · education.gov.au ↑ b
- TRA market profile: China 2025 (Tourism Research Australia) · Tourism Research Australia ↑ b
- IVS results for the year ending December 2024 compared to December 2023 · Tourism Research Australia ↑ b
- Overseas Arrivals and Departures, Australia, August 2026 · Australian Bureau of Statistics ↑ b c d
- Overseas Arrivals and Departures, Australia, January 2026 · Australian Bureau of Statistics ↑
- Overseas Arrivals and Departures, Australia, February 2026 · Australian Bureau of Statistics ↑
- Overseas Arrivals and Departures, Australia, March 2026 · Australian Bureau of Statistics ↑
- Overseas Arrivals and Departures, Australia, April 2026 · Australian Bureau of Statistics ↑
- Overseas Arrivals and Departures, Australia, May 2026 · Australian Bureau of Statistics ↑
- Overseas Arrivals and Departures, Australia, June 2026 · Australian Bureau of Statistics ↑
- Overseas Arrivals and Departures, Australia, July 2026 (time series tables 1, 7 and 8) · Australian Bureau of Statistics ↑
- Student visa and Temporary Graduate visa program report, June 2025 · homeaffairs.gov.au ↑ b
- COTRI — One billion trips in a decade · china-outbound.com ↑ b c
- Caravan and Camping State of Industry 2025 (Caravan Industry Association of Australia) · assets.pc.gov.au ↑
- Tourism Western Australia, 2025 China market profile · assets-us-01.kc-usercontent.com ↑
- China Daily (Xinhua): Chinese tourists embrace caravan parks in Australia (February 2019) · chinadaily.com.cn ↑
- Caravan Industry Association of Australia: Embracing the booming Chinese tourism market · caravanindustry.com.au ↑
- NSW Government media release: NSW number one for caravan and camping trips · nsw.gov.au ↑
- Tourism Tasmania, international visitor profile, year ending March 2026 · tourismtasmania.com.au ↑
- The Conversation — We depend so much more on Chinese travellers now. That makes the impact of this coronavirus novel (11 February 2020) · theconversation.com ↑
- Minister for Trade, Tourism and Investment — More Chinese tourists to Australia (media release, 18 April 2018) · trademinister.gov.au ↑
- Department of Internal Affairs (NZ) — High demand for 10-year passports (media release, 11 December 2015) · dia.govt.nz ↑
- Bloomberg — China’s love affair with Australia fizzles as tourism boom ends · bloomberg.com ↑ b
- Overseas Arrivals and Departures, Australia, August 2019 · Australian Bureau of Statistics
- International Visitor Survey, 2019 · Tourism Research Australia
- Telegraph — Rise of the Chinese Tourist · telegraph.co.uk
- TRA — Regional Dispersal Report, October 2019 · Tourism Research Australia
- Al Jazeera — ‘Overreaction’: China students stuck as Australia closes border · aljazeera.com
- CEO Statement on Coronavirus impact · tourism.tropicalnorthqueensland.org.au
- Department of Health — Press conference at Parliament House about novel coronavirus · health.gov.au
- TRA — International tourism results, Australia, March 2024 · Tourism Research Australia