

Updated
At a glance
- About 363,000 South Korean visitors came to Australia in 2025, up 5.9% on 2024 and 42.6% above 2019.1
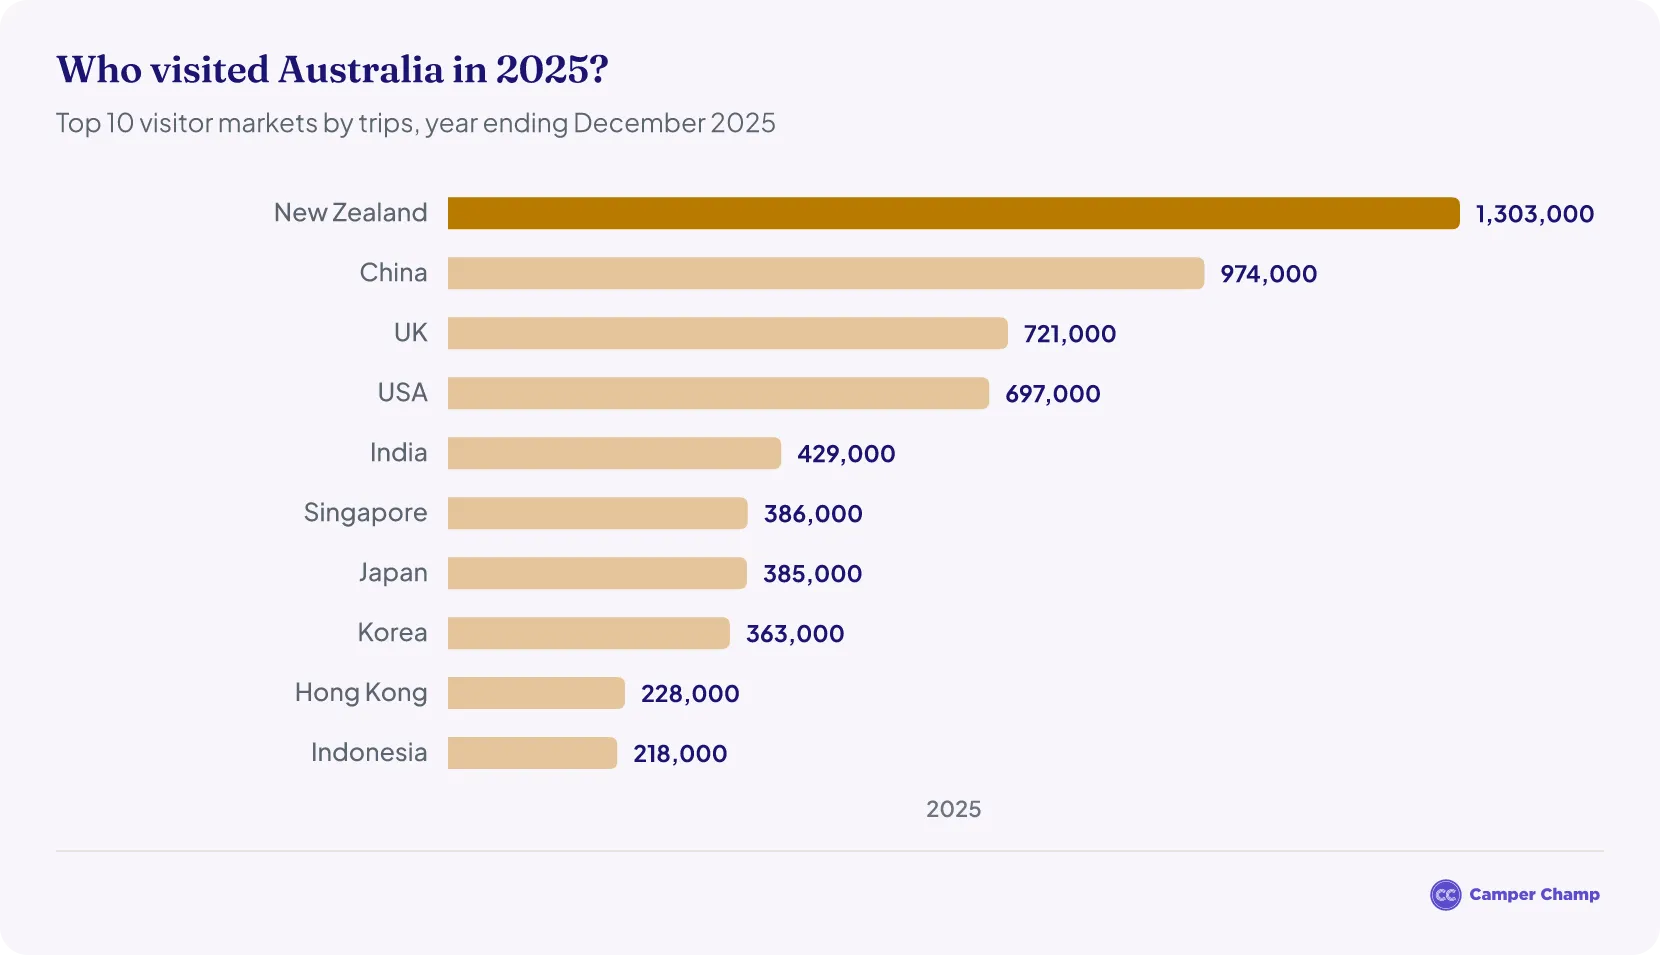
- South Korea was Australia's 8th-largest source of visitors in 2025, with 4.4% of all international visitor trips.1
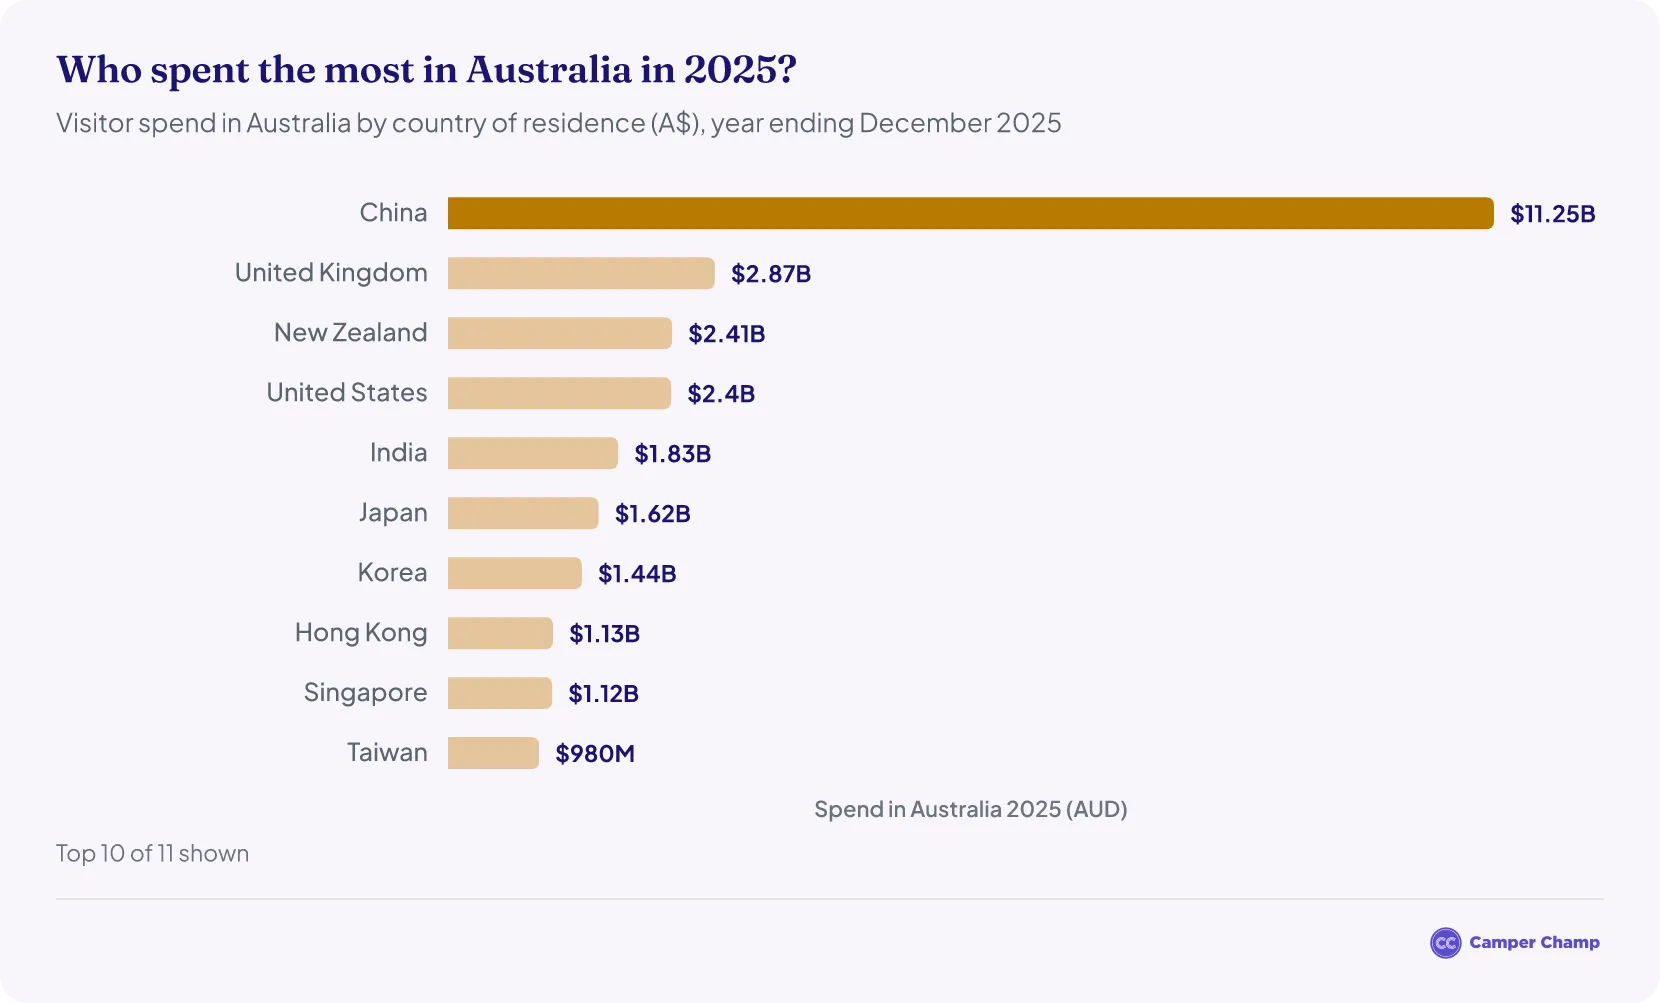
- South Korean visitors spent $1.44 billion in Australia in 2025, down 8.1% on 2024, and $2.08 billion including airfares and other trip costs.1
- In the year ending June 2026, about 371,000 South Korean visitors came to Australia, up 8.6%.2
- In August 2026, 30,990 short-term visitors arrived from South Korea, 16.2% fewer than in August 2025 but 47.9% more than in August 2019.3
- South Korean visitors stayed about 26 nights per trip on average in 2025, shorter than the 38-night average for all international visitors.1
- Travel goes both ways: 137,140 Australians visited South Korea in 2025, up 6% on the year before.4
How many South Korean tourists visit Australia each year?
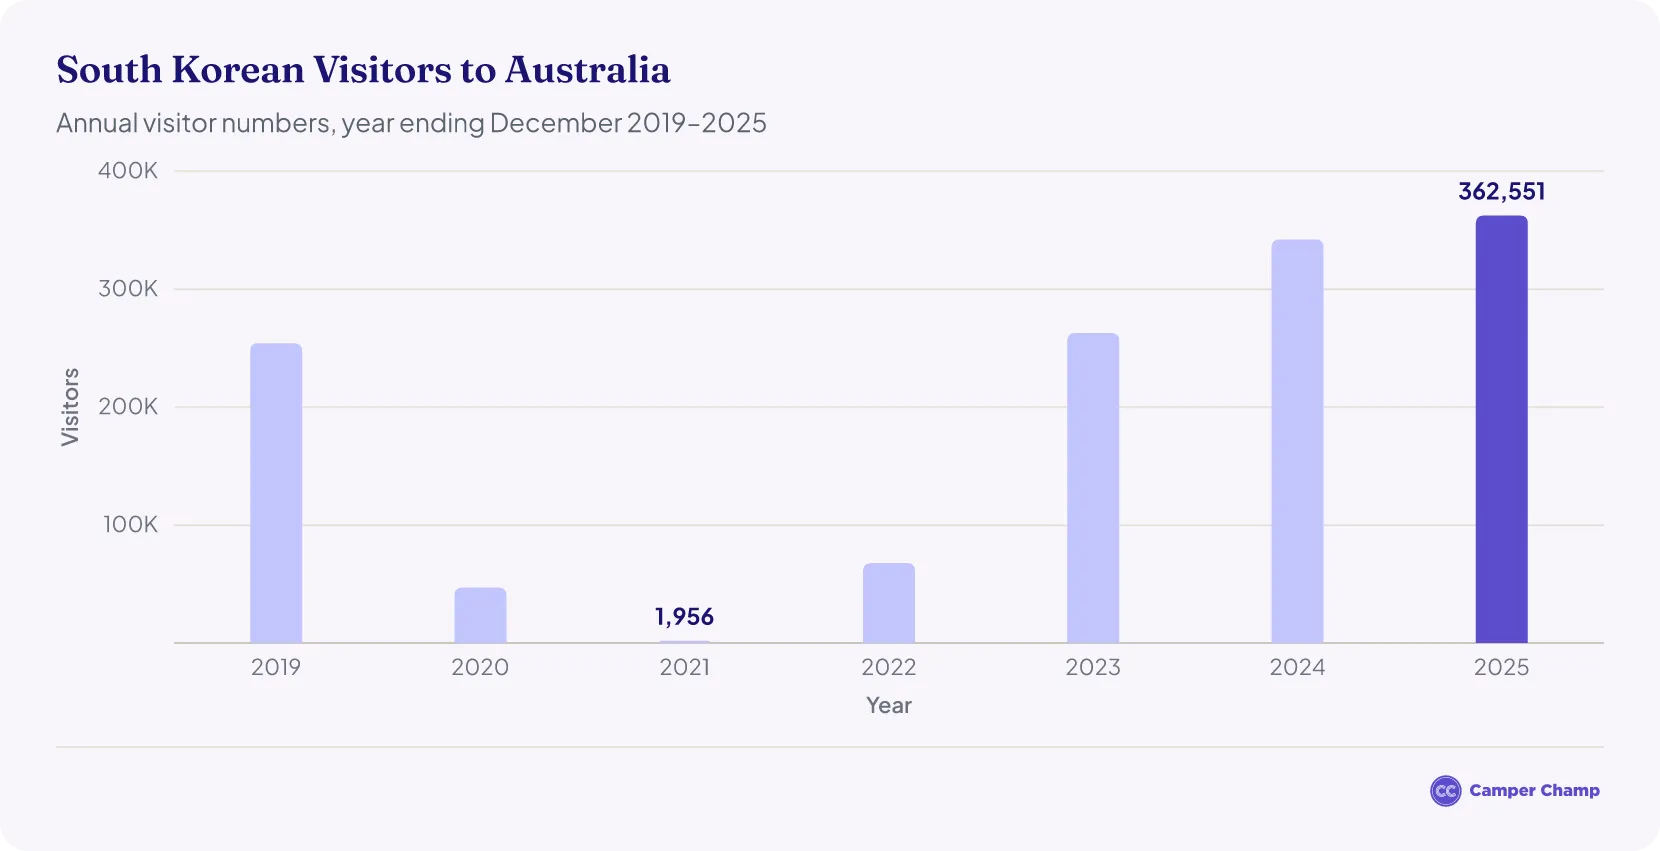
| South Korean visitors to Australia by year (2019–2025) | ||
|---|---|---|
| Year | South Korean visitors | Change on previous year |
| 2019 | 254,0005 | – |
| 2023 | 263,0006 | – |
| 2024 | 342,0001 | +30.2% |
| 2025 | 363,0001 | +5.9% |
Source · Tourism Research Australia, International Visitor Survey (trips by visitors aged 15 and over, year ending December). 2020 to 2022 are not shown because of the border closures.
How many South Korean tourists have visited Australia in 2026?
About 371,000 South Korean visitors travelled to Australia in the year ending June 2026, an 8.6% increase on the year ending June 2025.2
- South Korean visitors spent $1.52 billion in Australia over the same 12 months, up 5.7%.2
- In the June quarter of 2026, around 63,500 South Korean visitors came to Australia, 1.1% more than in the June quarter of 2025.2
- In August 2026, 30,990 short-term visitors arrived from South Korea, down 16.2% on August 2025 (37,000) but 47.9% above the 20,960 arrivals in August 2019. South Korea was the 8th-largest source of arrivals that month.3
- Adding up the monthly figures, 244,520 short-term visitors arrived from South Korea between January and August 2026, 0.5% fewer than in the same months of 2025 and about a third more than in 2019. February was the busiest month, with 45,130 arrivals.
Full-year 2026 figures are not out yet: the latest annual count covers the year to June 2026, and the August 2026 arrivals are still provisional.
| Short-term visitor arrivals from South Korea by month (2019, 2025 and 2026) | ||||
|---|---|---|---|---|
| Month | 2019 | 2025 | 2026 | 2026 vs 2025 |
| January | 29,770 | 41,210 | 39,8407 | −3.3% |
| February | 30,930 | 41,680 | 45,1308 | +8.3% |
| March | 26,130 | 29,160 | 34,9909 | +20.0% |
| April | 16,700 | 19,540 | 22,53010 | +15.3% |
| May | 18,830 | 24,140 | 25,30011 | +4.8% |
| June | 19,160 | 23,300 | 20,41012 | −12.4% |
| July | 20,930 | 29,720 | 25,33013 | −14.8% |
| August | 20,960 | 37,000 | 30,9903 | −16.2% |
Source · Australian Bureau of Statistics, Overseas Arrivals and Departures, Australia (short-term visitor arrivals from South Korea; each month as first published, the latest month provisional).
Where does South Korea rank among Australia's visitor markets?
- In 2025, South Korea accounted for 4.4% of all international visitor trips to Australia, the 8th-largest share, behind New Zealand, China, the United Kingdom, the United States, India, Singapore and Japan.1
Australia's top visitor markets in 2025
How much did South Korean tourists spend in Australia in 2025?
South Korean visitors spent about $2.08 billion on their trips to Australia in 2025, including airfares.1
- Spending within Australia fell 8.1%, from $1.57 billion in 2024 to $1.44 billion in 2025. Total trip spending fell 5.4%, from $2.20 billion to $2.08 billion.1
- Both are still well above pre-pandemic levels: spending in Australia was 35.1% higher than in 2019 ($1.07 billion), and total trip spending was 38.5% higher ($1.50 billion).5
- South Korea ranked 7th for both total trip spending and spending within Australia in 2025.1
| Tourism Spending by South Korean Visitors in Australia | ||
|---|---|---|
| Year | Spend in Australia | Total trip spend |
| 2019 | 1.07 B5 | 1.50 B |
| 2020 | – | 0.32 B14 |
| 2021 | 0.02 B | 0.02 B |
| 2022 | 0.34 B15 | 0.47 B |
| 2023 | 1.10 B6 | 1.58 B |
| 2024 | 1.57 B | 2.20 B |
| 2025 | 1.44 B1 | 2.08 B |
Source · Tourism Research Australia, International Visitor Survey (spending by South Korean visitors, year ending December). “Spend in Australia” counts spending within Australia only. “Total trip spend” also includes costs outside Australia, such as international flights and pre-trip costs. 2020 spending within Australia was not published.
South Korea's share of visitor spending in Australia
- South Korean visitors' $1.44 billion made up about 3.7% of all international visitor spending within Australia in 2025, the 7th-largest share, after China, the United Kingdom, New Zealand, the United States, India and Japan.1
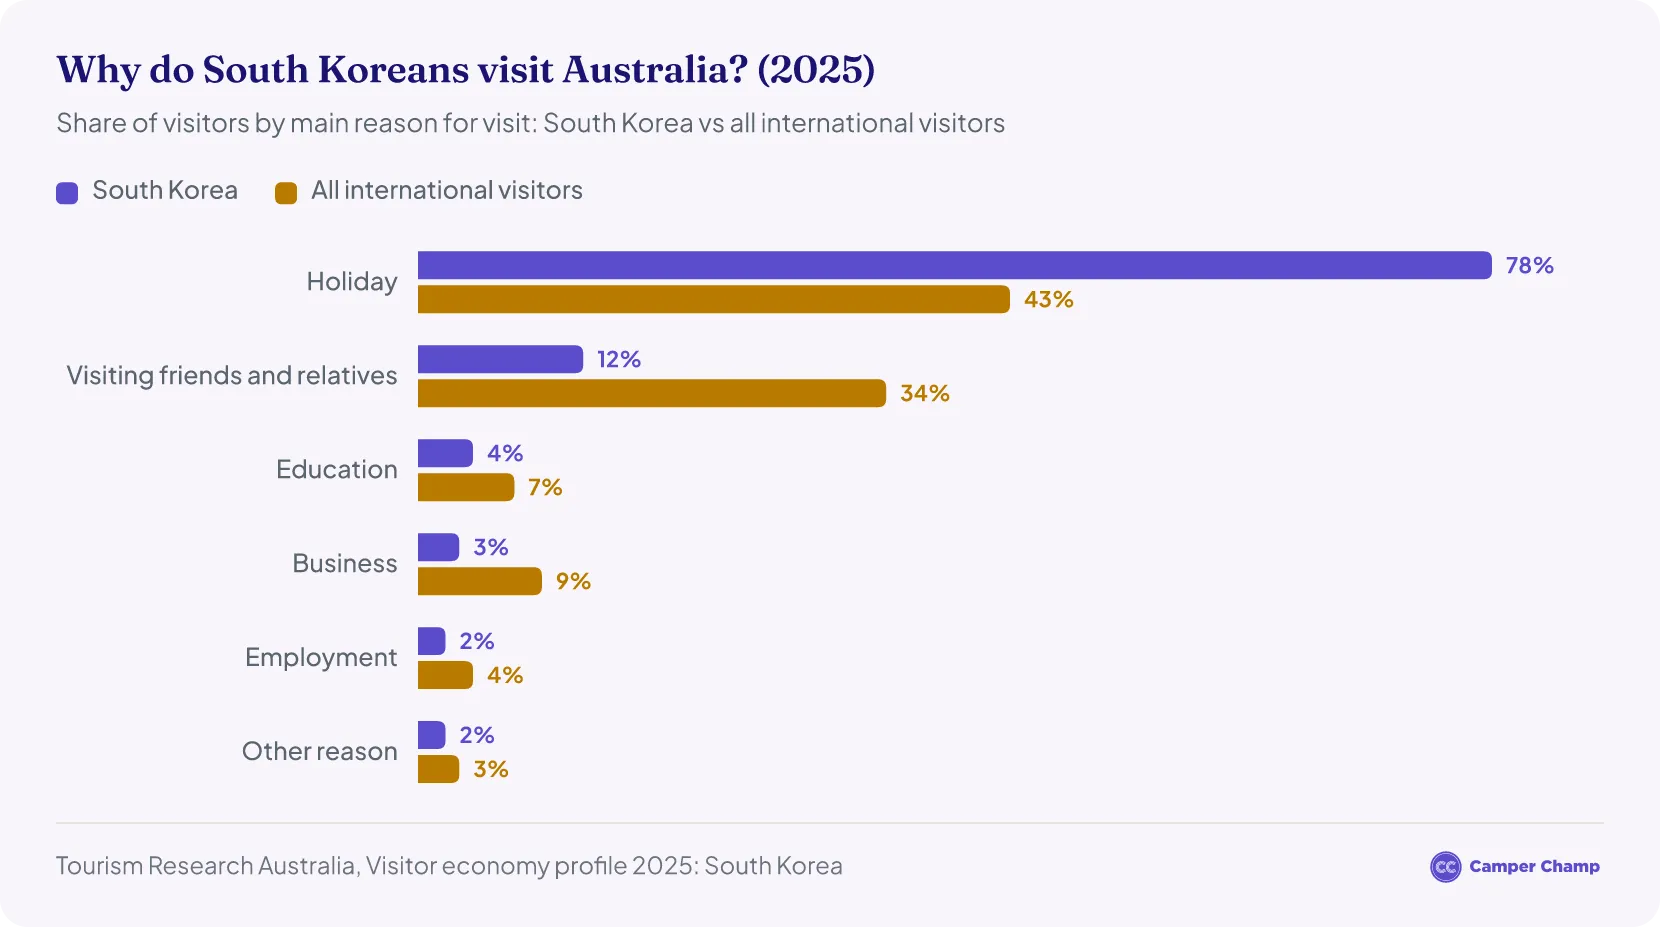
Why do South Koreans visit Australia?
Holidays are the main reason. In 2025, 78% of South Korean visitors came for a holiday, compared with 43% of all international visitors. Another 12% came to see friends or family (34% of all visitors), 4% to study and 3% on business.4
- Most are first-timers: 69% of South Korean visitors in 2025 were on their first trip to Australia, against 41% of all international visitors.4
- They often travel together: 39% came in a family or friends group, compared with 23% of all international visitors, while 40% travelled alone, against 54% of all international visitors.4
- Nature is a big draw: 83% went to the beach (63% of all visitors), 66% visited a national or state park (45%) and 60% went to a wildlife park, zoo or aquarium (34%).4
How many South Koreans live in Australia?
How long do South Koreans stay in Australia?
- South Korean visitors spent 9.38 million nights in Australia in 2025, an average of about 26 nights per trip. The average for all international visitors was 38 nights.1
- Nights fell 15.0% on 2024 even though trips rose 5.9%, so the average stay got shorter.1
- Most trips are short: 59% of South Korean visitors stayed 1 to 7 nights in 2025, compared with 34% of all international visitors. At the other end, 12% stayed 31 nights or more, against 25% of all international visitors.4
Where do Korean tourists go in Australia?
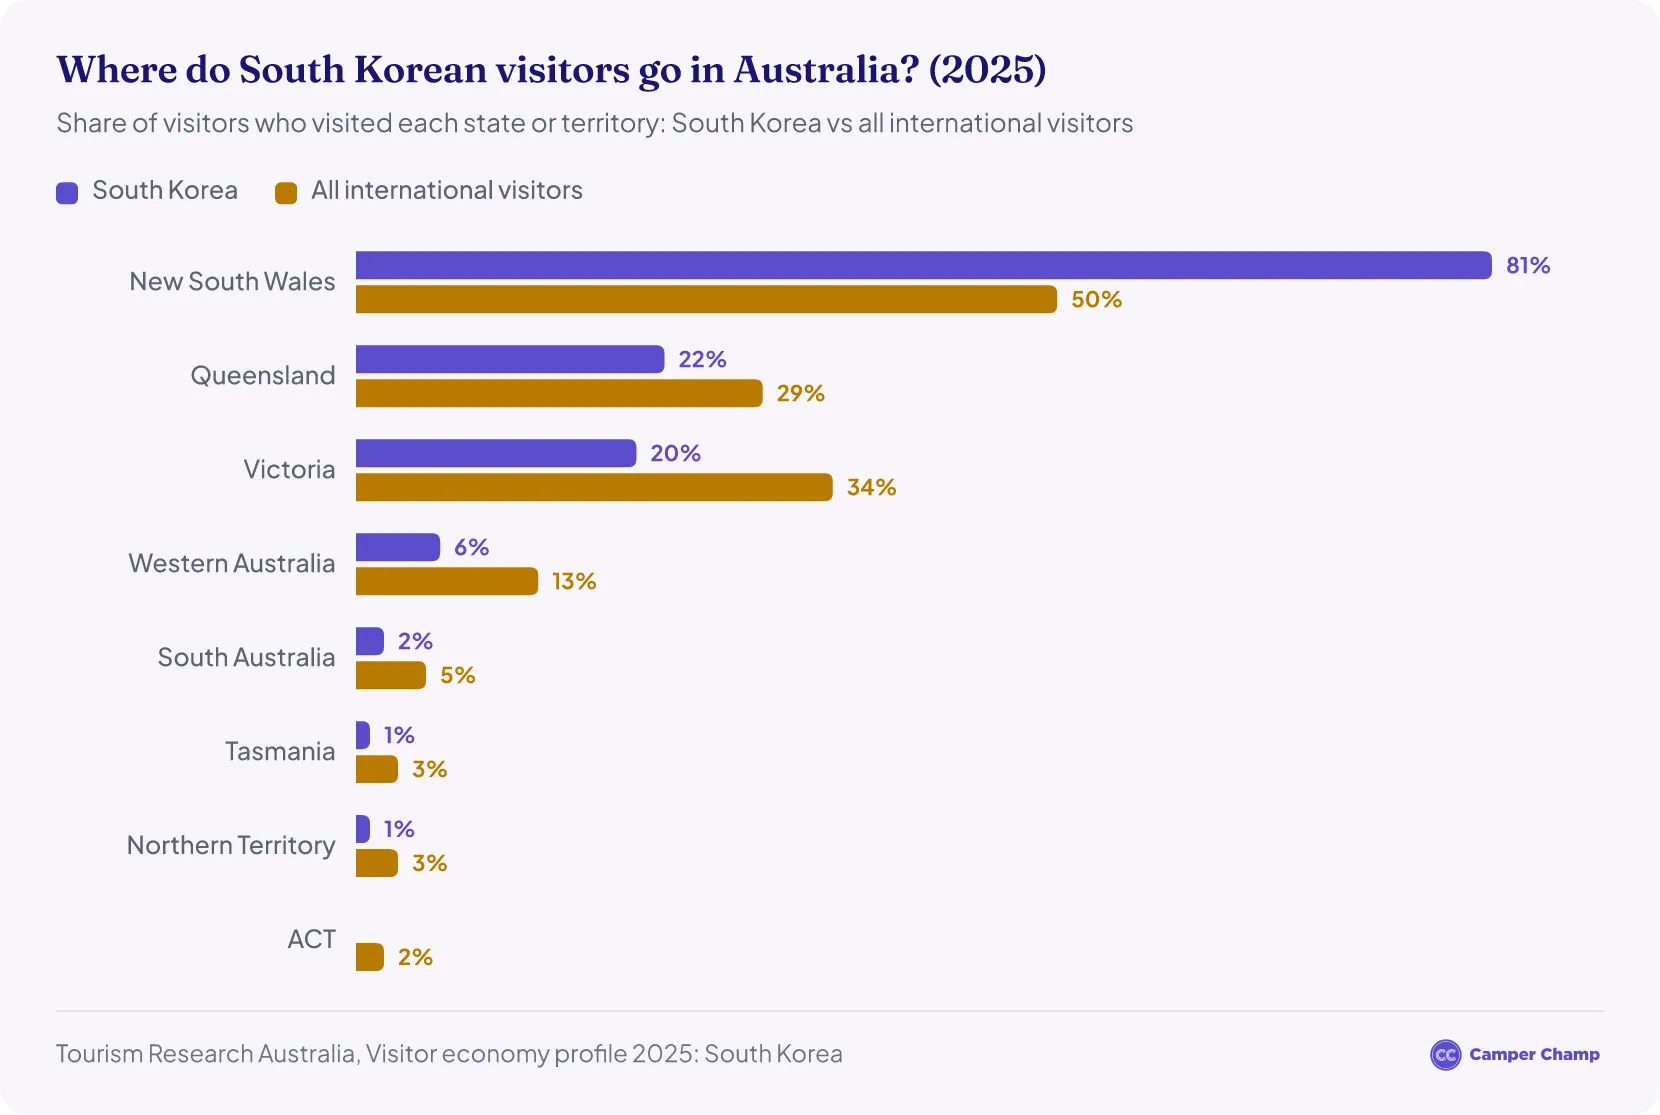
New South Wales is the clear favourite. In 2025, 81% of South Korean visitors went to New South Wales, compared with 50% of all international visitors. Fewer went to Queensland (22%, against 29%) or Victoria (20%, against 34%).4 For a road trip, Sydney is the natural starting point.
- Western Australia: 6% (all international visitors: 13%)
- South Australia: 2% (5%)
- Tasmania: 1% (3%)
- Northern Territory: 1% (3%)
- ACT: 0% (2%)4
Most stay close to the big centres: 98% of South Korean visitors went to a capital city or the Gold Coast, and only 12% travelled further afield, against 29% of all international visitors.4 Visitors can go to more than one place, so the shares add up to more than 100%.
The monthly arrivals tell the same story. Of the 30,990 short-term visitors who arrived from South Korea in August 2026, 21,060 (68%) were heading mainly for New South Wales and 5,550 (18%) for Queensland.3
South Korea was the joint 4th-largest source of visitors to New South Wales in August 2026, level with Japan.3
Do South Korean tourists go camping in Australia?
There is no current national count of South Korean visitors who hire campervans or stay in caravan parks, because the caravan industry's latest national report includes no international visitor figures.17 What data there is shows South Koreans enjoy the outdoors, but most stay near the cities.
- 66% of South Korean visitors went to a national or state park in 2025, compared with 45% of all international visitors.4
- Across all international visitors, nights in caravan parks and commercial camping grounds rose 39.2% to 3.39 million in 2025. Another 1.50 million nights were spent caravanning or camping outside commercial parks.1
- Only 12% of South Korean visitors travelled beyond the capital cities and the Gold Coast in 2025, compared with 29% of all international visitors.4
Campgrounds worth seeing
South Korean visitors favour New South Wales, Queensland and Victoria, and all three have standout national park campgrounds. Book your site before you go.
- Illaroo campground, Yuraygir National Park, New South Wales: 70 beachfront sites near Grafton and Wooli for tents, camper trailers and caravans.18 The North Coast was one of the most popular regions for international caravan and camping visitors to New South Wales in 2025.19
- K'gari (Fraser Island), Queensland: Central Station, inland from Eurong, is a large fenced camping area in the rainforest, with walks close by. You need a camping permit and a vehicle access permit before you arrive.20
- Whitehaven Beach, Whitsunday Islands, Queensland: Pitch a tent right by the beach's white silica sand, at one of 25 camping spots in the Whitsunday Islands. Bring your own fresh water.21
- Tidal River, Wilsons Promontory National Park, Victoria: The Prom's most popular and best-equipped campground, with 484 camping and caravan sites a short walk from Norman Beach.22
Campervan hire in Australia
- Adelaide motorhome hire
- Alice Springs
- Brisbane motorhome hire
- Broome campervan rental
- Cairns motorhome hire
- Campervan hire in Melbourne
- Campervan hire in Sydney
- Darwin
- Devonport campervan rental
- Gold Coast campervan rental
- Hobart motorhome hire
- Launceston motorhome hire
- Perth
- Tasmania
How have South Korean visitor numbers changed over time?
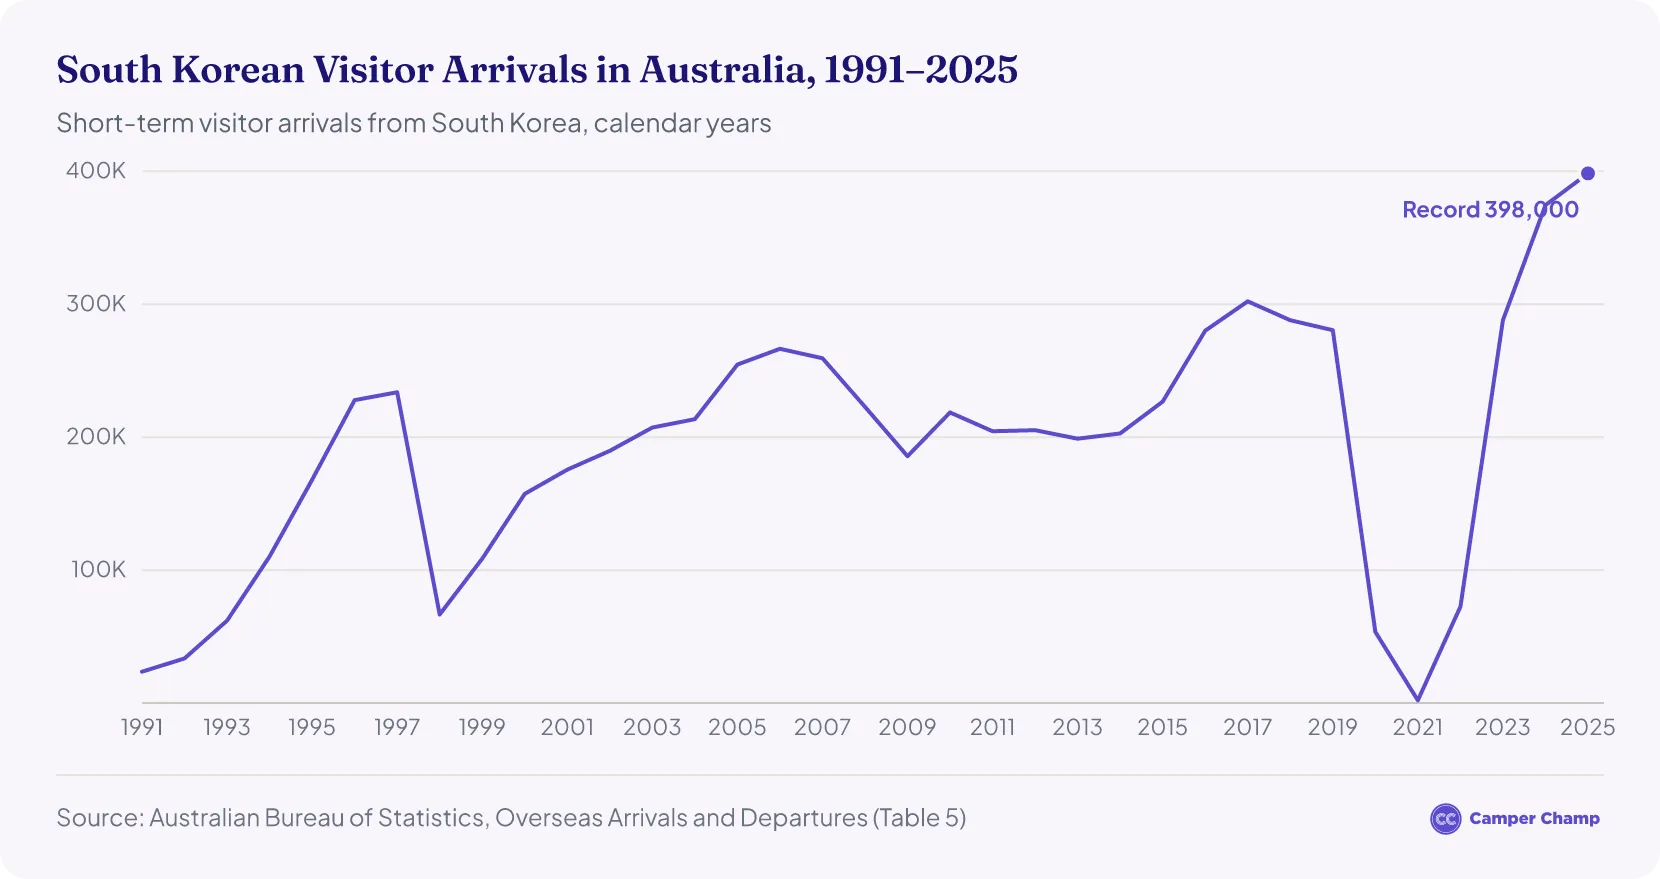
South Korean visitor numbers collapsed when Australia closed its borders in 2020, then passed their pre-pandemic level again in 2023.
- About 254,000 South Korean visitors came to Australia in 2019.14
- In 2020, the number fell 81% to about 47,200.14
- In 2021, with the borders closed for almost the whole year, only about 2,000 South Korean visitors came.15
- Numbers began to recover in 2022, with about 67,800 visitors.15
- By 2023 the number had climbed back to 263,000, just above the 2019 level, before rising to 342,000 in 20246 and 363,000 in 2025.1
South Korean tourism in Australia: quick answers
Is South Korea a big source of tourists for Australia?
Yes. South Korea was Australia's 8th-largest source of international visitors in 2025, with about 363,000 trips, or 4.4% of all international visitor trips.1
How much do Korean tourists spend in Australia?
On average, South Korean visitors spent about $3,985 per trip within Australia in 2025 ($1.44 billion across about 363,000 trips).1 Including airfares and other costs outside Australia, the average trip cost about $5,740.
How long do South Korean tourists stay in Australia?
South Korean visitors spent 9.38 million nights in Australia in 2025, an average of about 26 nights per trip, compared with about 38 nights for all international visitors.1 Most trips are much shorter than that: 59% stayed a week or less.
What is the busiest month for Korean tourists in Australia?
So far in 2026, February has been the busiest month, with 45,130 short-term visitors arriving from South Korea.8 January (39,840) and March (34,990) were next. Full-year figures for 2026 are not out yet.
Why do South Koreans visit Australia?
Mostly for a holiday. In 2025, 78% of South Korean visitors came for a holiday, compared with 43% of all international visitors, and 69% were visiting Australia for the first time.4
How many Australians visit South Korea?
In 2025, 137,140 Australians visited South Korea, up 6% on the year before.4 That is far fewer than the South Korean visitors coming the other way.
More tourism statistics
- Australia Tourism Statistics
- Chinese Tourism in Australia Statistics
- Hong Kong Tourism in Australia Statistics
- Indian Tourism in Australia Statistics
- Japanese Tourism in Australia Statistics
- Malaysia Tourism in Australia Statistics
- New Zealand Tourism in Australia Statistics
- Singapore Tourism in Australia Statistics
- UK Tourism in Australia Statistics
- USA Tourism in Australia Statistics
References
- International tourism results — year ending December 2025 (International Visitor Survey) · Tourism Research Australia ↑ b c d e f g h i j k l m n o p q r s t u
- International tourism results — year ending June 2026 (International Visitor Survey) · Tourism Research Australia ↑ b c d
- Overseas Arrivals and Departures, Australia, August 2026 · Australian Bureau of Statistics ↑ b c d e
- TRA market profile: South Korea 2025 (Tourism Research Australia) · Tourism Research Australia ↑ b c d e f g h i j k l m
- IVS results for the year ending December 2024 compared to December 2019 · Tourism Research Australia ↑ b c d
- IVS results for the year ending December 2024 compared to December 2023 · Tourism Research Australia ↑ b c
- Overseas Arrivals and Departures, Australia, January 2026 · Australian Bureau of Statistics ↑
- Overseas Arrivals and Departures, Australia, February 2026 · Australian Bureau of Statistics ↑ b
- Overseas Arrivals and Departures, Australia, March 2026 · Australian Bureau of Statistics ↑
- Overseas Arrivals and Departures, Australia, April 2026 · Australian Bureau of Statistics ↑
- Overseas Arrivals and Departures, Australia, May 2026 · Australian Bureau of Statistics ↑
- Overseas Arrivals and Departures, Australia, June 2026 · Australian Bureau of Statistics ↑
- Overseas Arrivals and Departures, Australia, July 2026 (time series tables 1, 7 and 8) · Australian Bureau of Statistics ↑
- International Visitor Survey tourism results — year ending December 2020 compared with 2019 (Tourism Research Australia) · Tourism Research Australia ↑ b c
- International Visitor Survey tourism results — year ending December 2022 compared with 2021 (Tourism Research Australia) · Tourism Research Australia ↑ b c
- Estimated resident population by country of birth, 30 June 1996 to 2025 (ABS, Australia's population by country of birth 2025, data cube 1) · Australian Bureau of Statistics ↑ b
- Caravan and Camping State of Industry 2025 (Caravan Industry Association of Australia) · assets.pc.gov.au ↑
- Illaroo campground, Yuraygir National Park — NSW National Parks and Wildlife Service · nationalparks.nsw.gov.au ↑
- NSW Government media release: NSW number one for caravan and camping trips · nsw.gov.au ↑
- K'gari (Fraser Island) camping areas — Queensland Parks and Wildlife Service · parks.qld.gov.au ↑
- Whitsunday Islands National Park camping — Queensland Parks and Wildlife Service · parks.qld.gov.au ↑
- Tidal River Campground — Wilsons Promontory National Park, Parks Victoria · parks.vic.gov.au ↑
- TRA — International tourism results, Australia, March 2024 · Tourism Research Australia