

Updated
At a glance
- 385,000 Japanese visitors came to Australia in 2025, up 6.5% on 20241 but still 15.9% below 20192.
- Japan was Australia's 7th-largest source of visitors in 2025, with 4.7% of all international visitor trips1.
- Japanese visitors spent $1.62 billion in Australia in 2025, up 12.7%, and $2.33 billion including airfares and other trip costs1.
- In the year ending June 2026, almost 408,000 Japanese visitors came to Australia, up 12.9%3.
- In August 2026, 62,600 short-term visitors arrived from Japan, the third-largest number of any country and almost back to the August 2019 level4.
- Japanese visitors are keener than most to leave the big cities: 35% travelled beyond the capital cities and the Gold Coast in 2025, against 29% of all international visitors5.
How many Japanese tourists visit Australia each year?
Over 385,000 Japanese tourists visited Australia in 20251.
- This represented a 6.46% increase compared to the 362,000 Japanese visitors recorded in 20241.
- The number of Japanese visitors in 2025 was 15.87% lower than the 2019 level of 458,000 visitors (pre-pandemic)2.
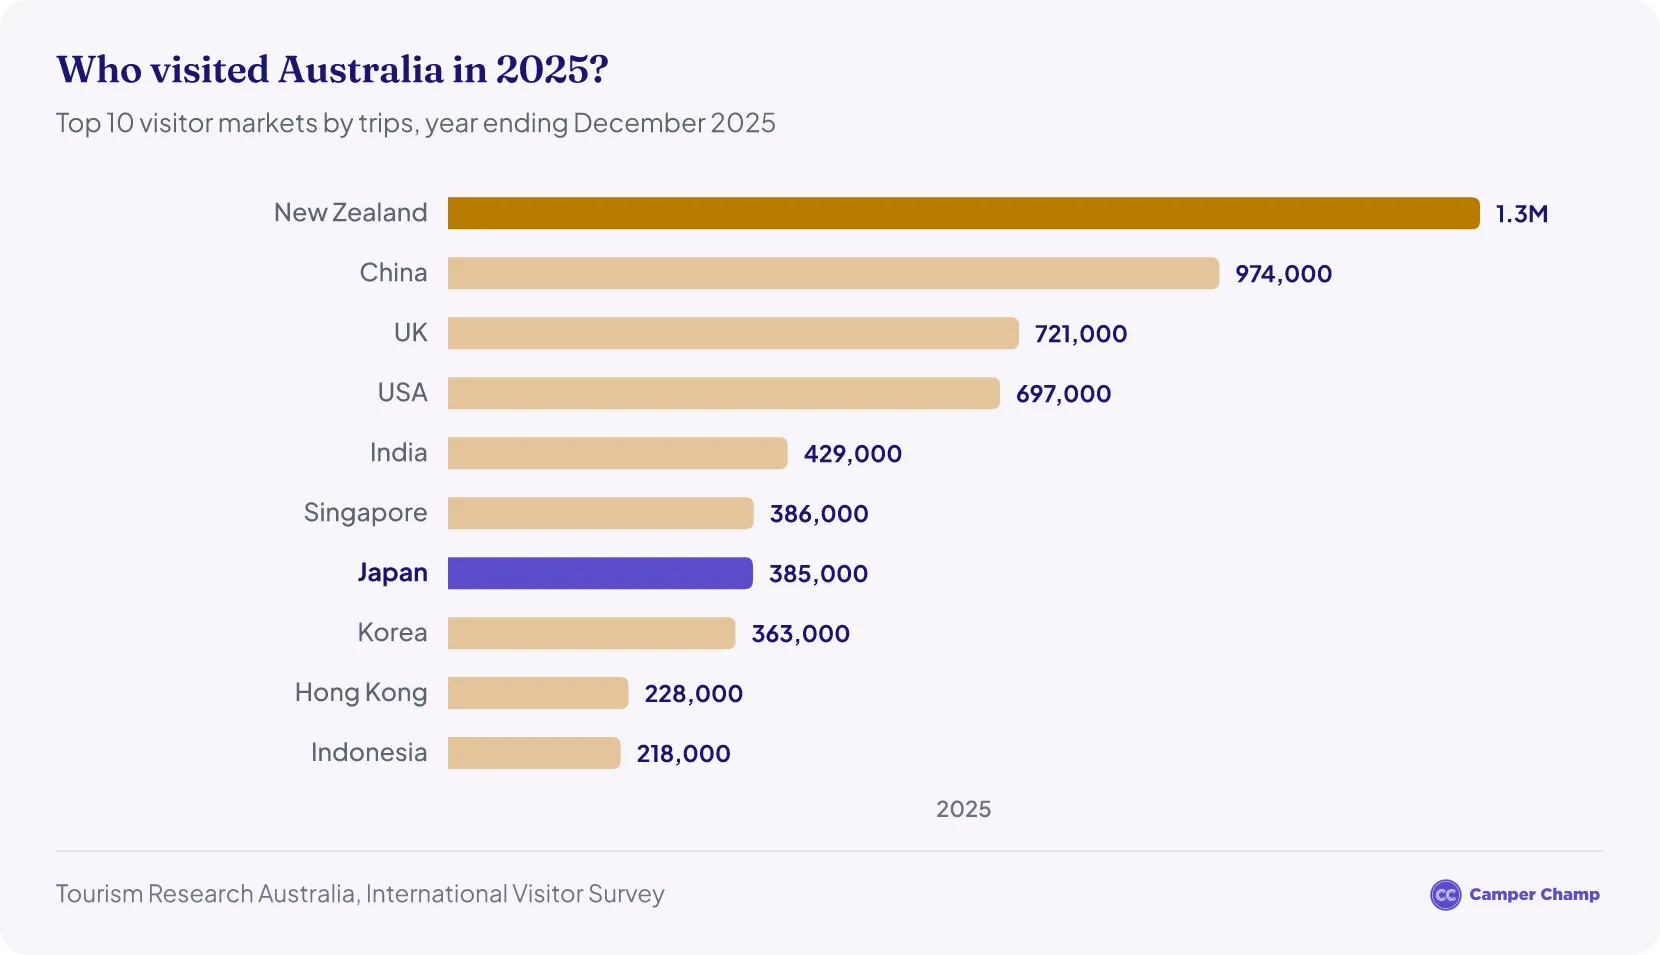
- Japan ranked 7th among all international visitor markets to Australia in 2025, just behind Singapore1.
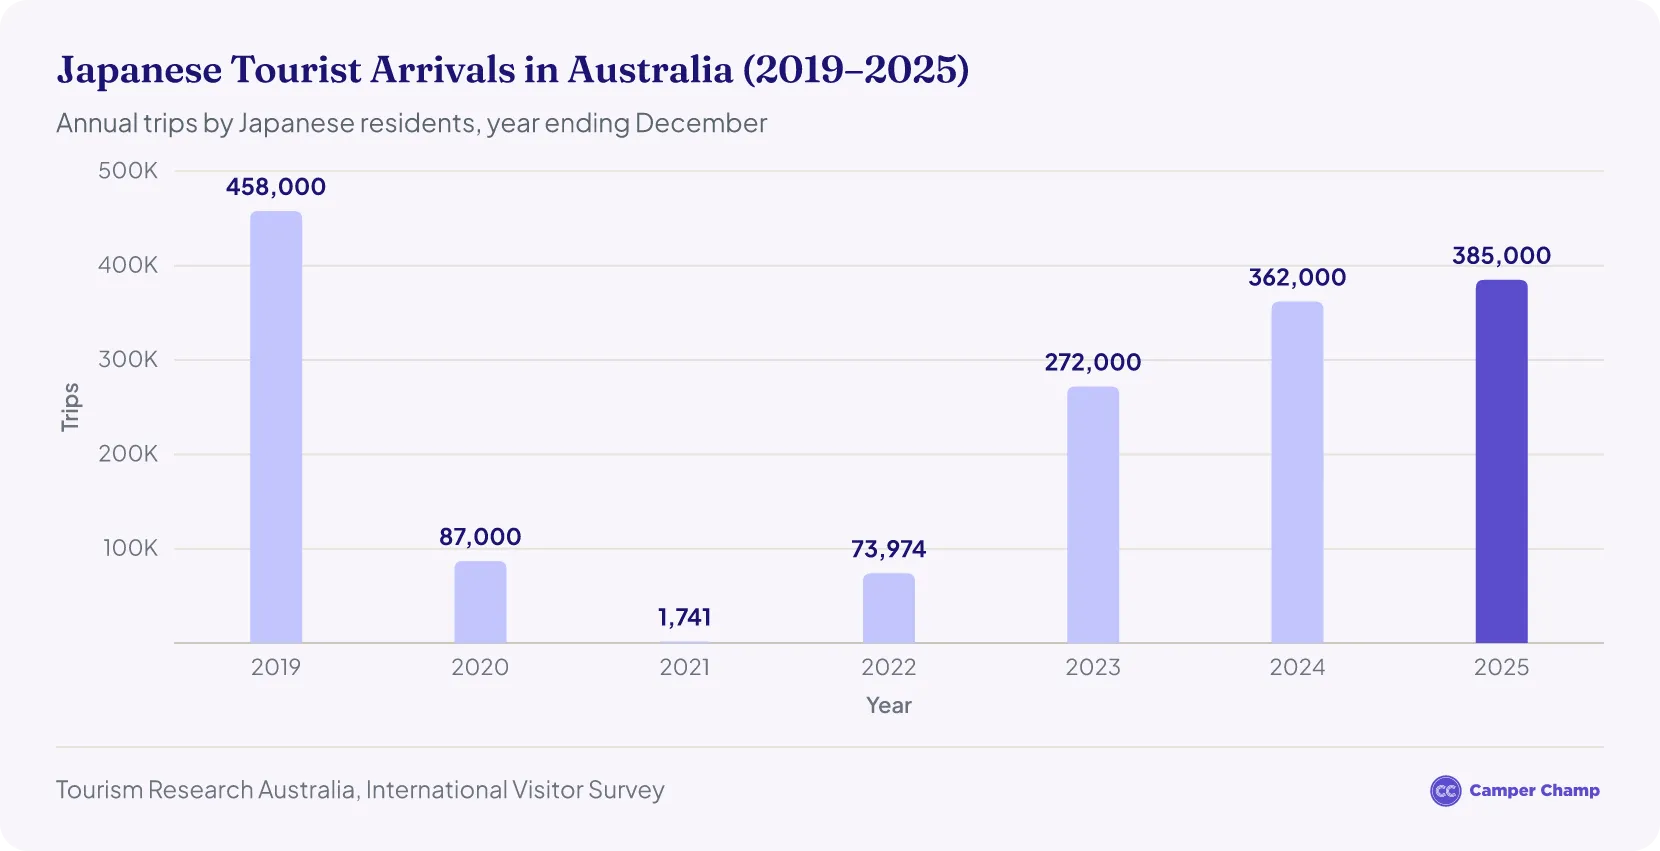
| Japanese visitors to Australia by year (2019–2025) | ||
|---|---|---|
| Year | Japanese visitors | Change on previous year |
| 2019 | 458,0002 | – |
| 2020 | 87,0006 | −80.9% |
| 2021 | 1,7416 | −98.0% |
| 2022 | 73,9747 | +4,148.4% |
| 2023 | 272,0008 | +267.5% |
| 2024 | 362,0001 | +33.1% |
| 2025 | 385,0001 | +6.5% |
Source · Tourism Research Australia, International Visitor Survey (trips by visitors aged 15 and over, year ending December).
How many Japanese tourists have visited Australia in 2026?
Almost 408,000 Japanese visitors travelled to Australia in the year ending June 2026, a 12.9% increase on the year ending June 20253.
- Japanese visitors spent $1.57 billion in Australia over the same 12 months, up 10.0%3.
- In the June quarter of 2026, around 69,000 Japanese visitors came to Australia, 17.2% more than in the June quarter of 20253.
- In August 2026, 62,600 short-term visitors arrived from Japan, up 3.3% on August 2025 and third behind New Zealand (110,210) and China (106,990). That is less than 1% below the 63,070 Japanese arrivals in August 20194.
- Adding up the monthly figures, 295,970 short-term visitors arrived from Japan between January and August 2026, 10.7% more than in the same months of 2025 and about 92% of the 2019 level. March and August were the busiest months.
Full-year 2026 figures are not out yet. The latest annual figures cover the year to June 2026, and the August 2026 arrivals are provisional.
| Japanese arrivals in Australia by month (2026 vs 2025 and 2019) | ||||
|---|---|---|---|---|
| Month | 2019 | 2025 | 2026 | 2026 vs 2025 |
| January | 31,2009 | 21,9709 | 24,4309 | +11.2% |
| February | 44,54010 | 39,48010 | 42,77010 | +8.3% |
| March | 53,47011 | 46,75011 | 53,93011 | +15.4% |
| April | 32,76012 | 17,60012 | 23,04012 | +30.9% |
| May | 27,96013 | 23,22013 | 28,17013 | +21.3% |
| June | 24,63014 | 21,57014 | 22,73014 | +5.4% |
| July | 43,00015 | 36,21015 | 38,30015 | +5.8% |
| August | 63,0704 | 60,6104 | 62,6004 | +3.3% |
Source · Australian Bureau of Statistics, Overseas Arrivals and Departures, Australia (short-term visitor arrivals from Japan; each month as first published, the latest month provisional).
Japan’s share in the Australian tourism industry
- Japan accounted for 4.7% of all international visitor trips to Australia in 20251, making it the 7th-largest source market for tourism in Australia.
How much did Japanese tourists spend in Australia in 2025?
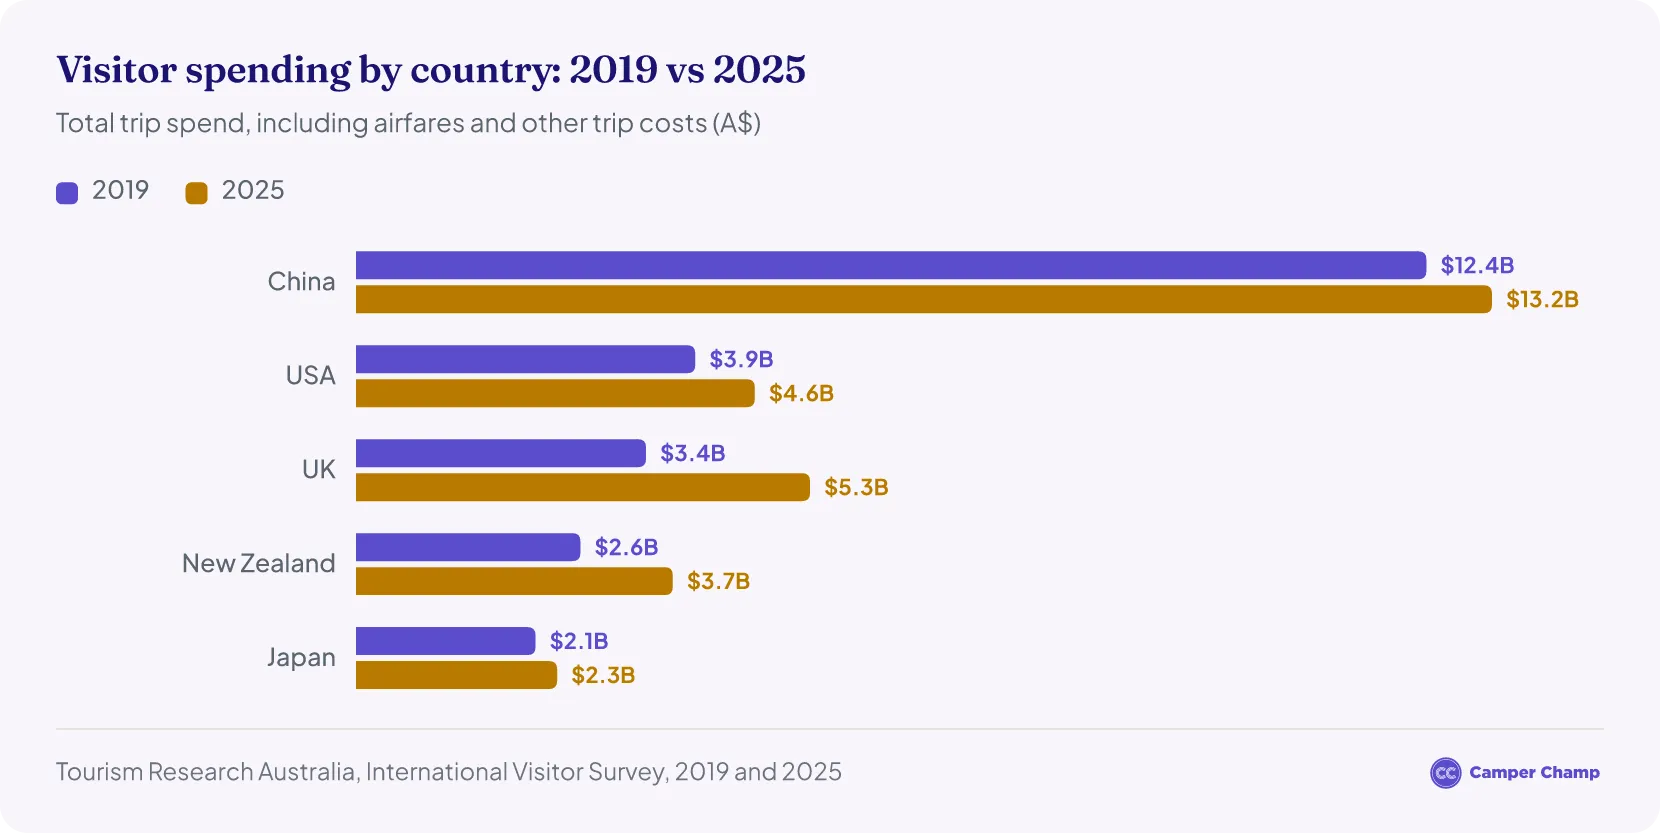
Japanese visitors spent approximately $2.33 billion during trips to Australia in 20251.
- In 2025, spending within Australia by Japanese visitors increased by 12.67%, rising from $1.43 billion in 2024 to $1.62 billion1. Total trip spending grew by 10.91%, increasing from $2.10 billion to $2.33 billion.
- In 2025, Japanese spending in Australia was 30.48% higher than the 2019 level of $1.24 billion2. Total trip spending in 2025 was also 11.85% higher than the 2019 figure of $2.08 billion, taking it above pre-pandemic levels.
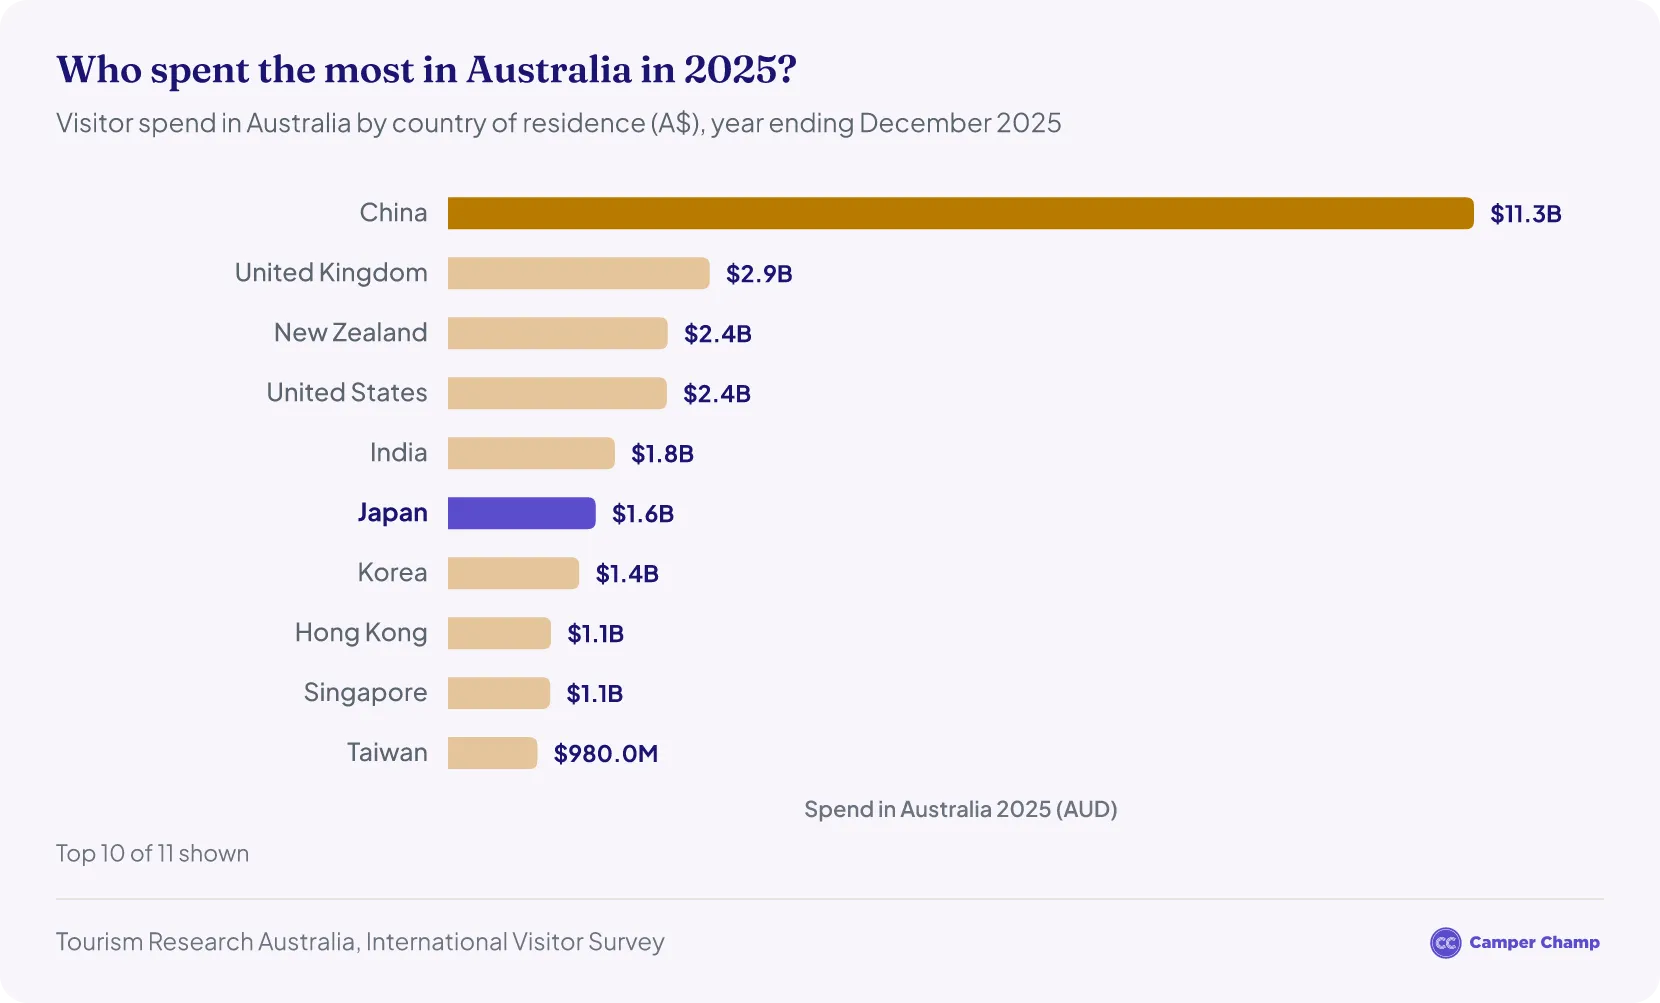
- Japan ranked 6th in terms of total spending by international visitors in Australia in 20251.
| Tourism Spending by Japanese Visitors in Australia | ||
|---|---|---|
| Year | Spend in Australia | Total Trip Spend |
| 2019 | 1,240,000,0002 | 2,080,000,0002 |
| 2020 | – | 430,000,000 |
| 2021 | 13,000,000 | 20,000,000 |
| 2022 | 300,000,000 | 440,000,000 |
| 2023 | 1,170,000,0008 | 1,750,000,0008 |
| 2024 | 1,430,000,0008 | 2,100,000,0008 |
| 2025 | 1,620,000,0001 | 2,330,000,0001 |
Source · Note: “Spend in Australia” is spending within Australia, while “Total Trip Spend” includes all trip expenses, including those outside Australia such as international flights and pre-trip costs.
Japan’s contribution to tourism expenditure in Australia
- At $1.62 billion in 2025, Japan accounted for 4.1% of all spending in Australia by international visitors1, ranking 6th on Australia’s top list of spenders.
How much do Japanese tourists spend per night in Australia?
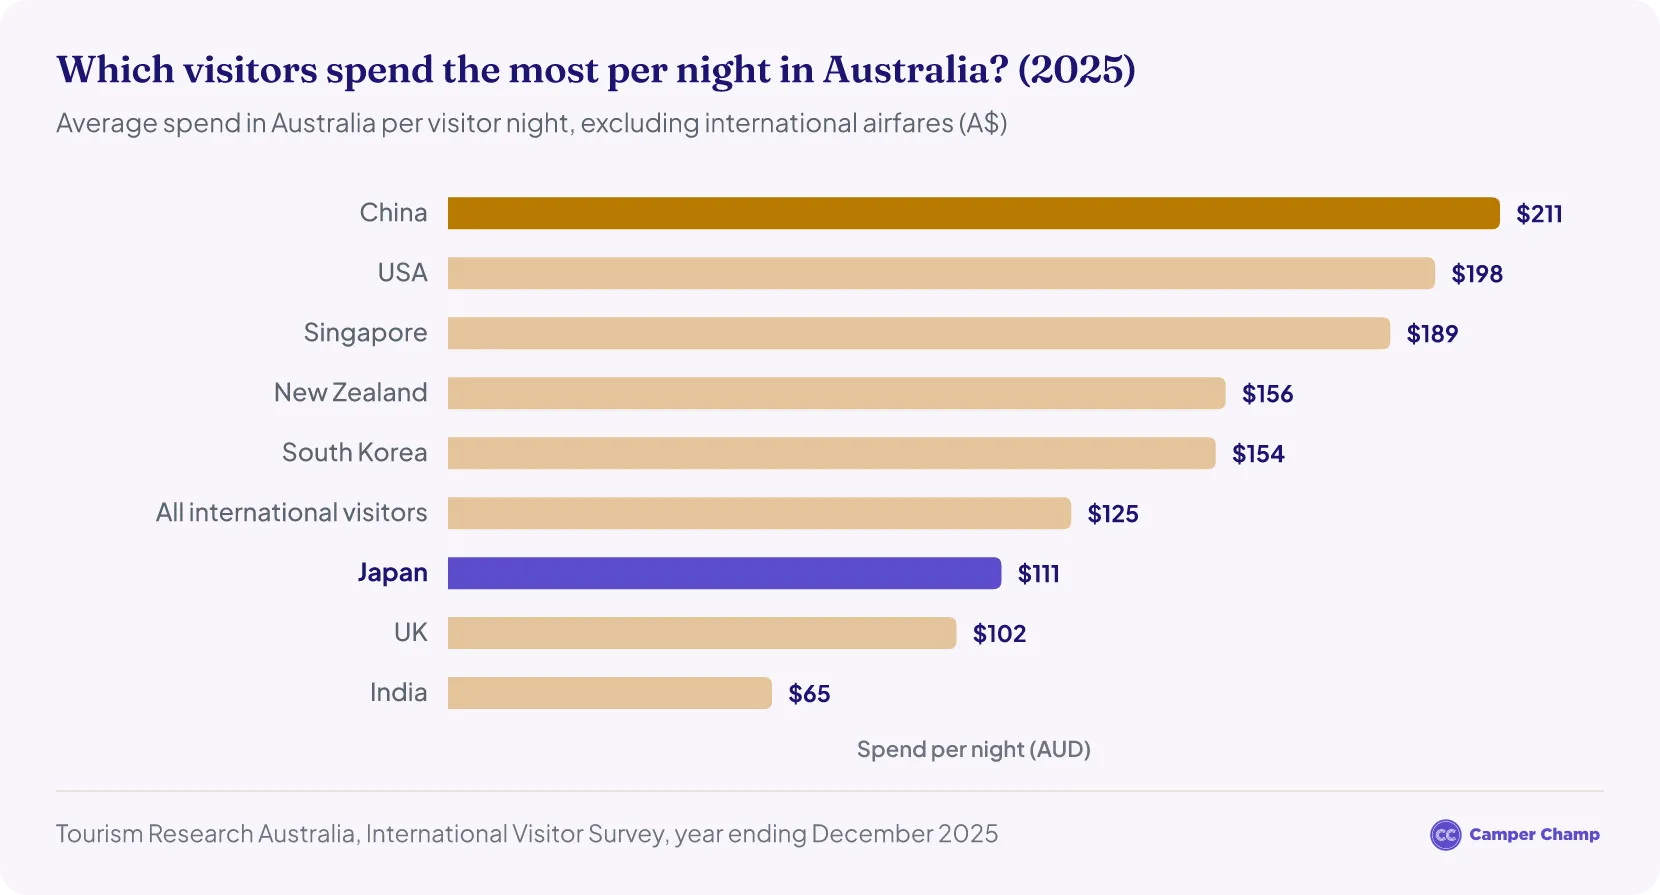
- Japanese visitors spent about $111 a night in Australia in 2025, excluding international airfares. That is below the $125 average for all international visitors, and well behind visitors from China ($211), the USA ($198) and Singapore ($189)1.
- Per trip, Japanese visitors spent about $4,200 each within Australia in 20255.
- Tourism Research Australia doesn't publish a 2025 breakdown by spending item for Japan, so the chart below compares total spend per night.
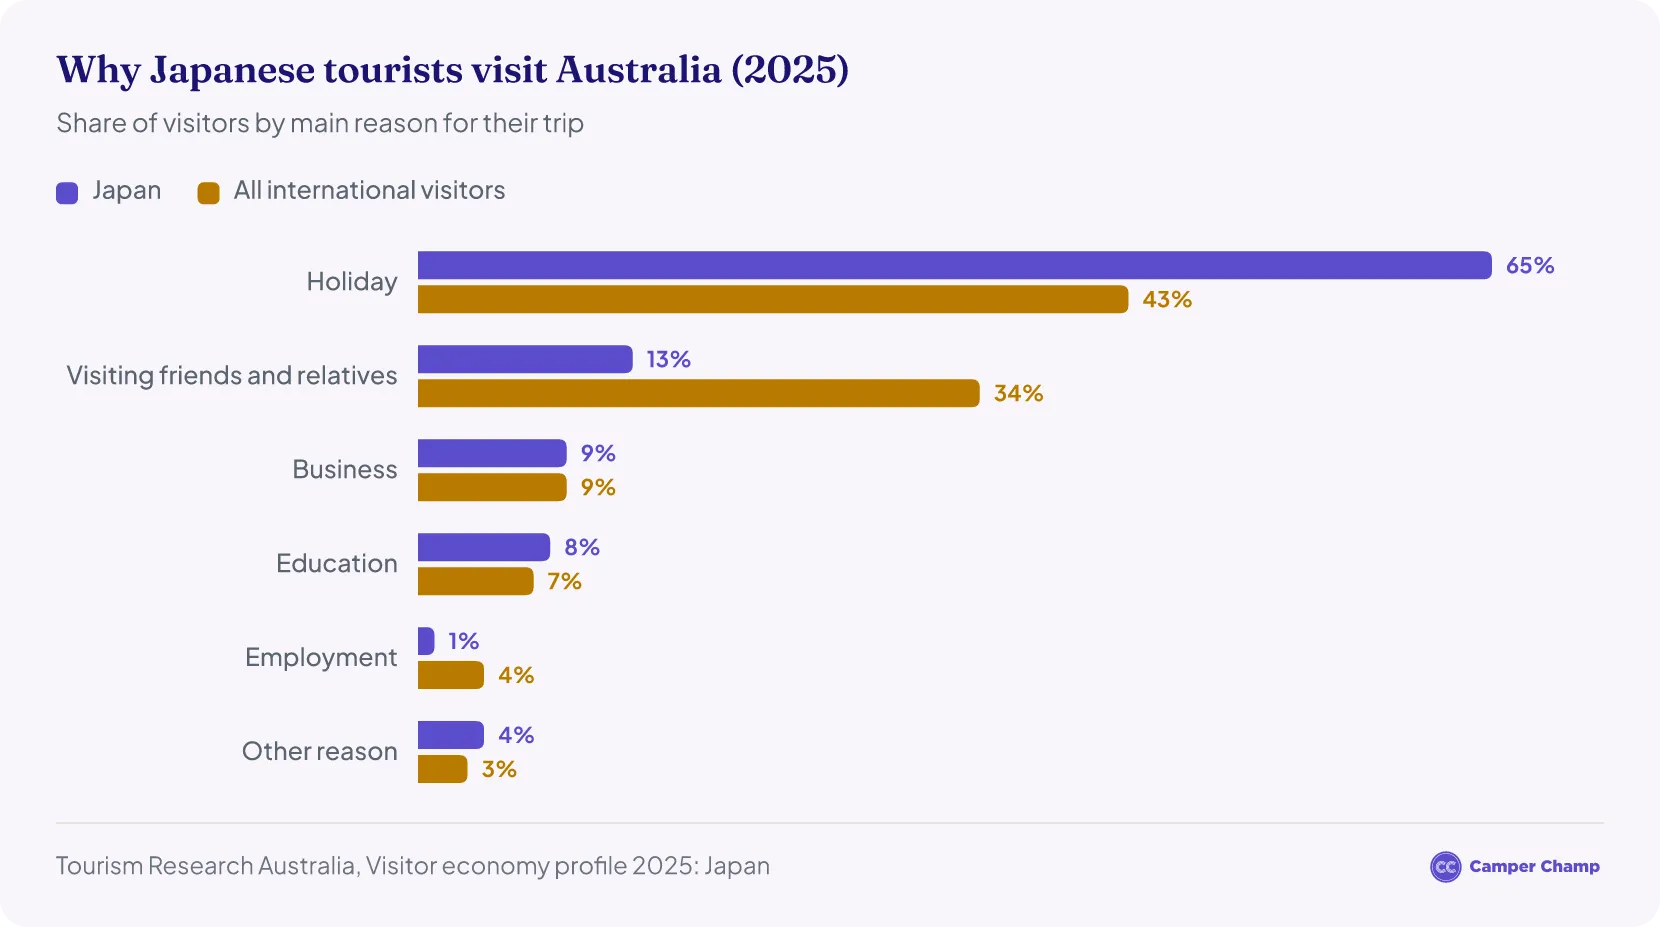
Reasons Japanese tourists visit Australia
Do Japanese tourists go camping in Australia?
There is no national count of Japanese visitors who hire campervans or stay in caravan parks: the caravan industry's 2025 national report includes no international visitor figures16. What data there is shows Japanese visitors are keener than most to get out of the cities, though most of their trips are short.
- 35% of Japanese visitors travelled beyond the capital cities and the Gold Coast in 2025, compared with 29% of all international visitors5.
- 43% visited a national or state park, close to the 45% of all international visitors, and 41% went to a wildlife park, zoo or aquarium, against 34%5.
- Most trips are short: 63% of Japanese visitors stayed a week or less in 2025, against 33% of all international visitors5.
- More than half (53%) travelled solo, and 55% were on their first trip to Australia5.
- Japan was not among the top three international markets for caravan and camping in New South Wales in 2025: those were the UK, Germany and New Zealand17.
Where do Japanese tourists go in Australia?
Most Japanese visitors head to Queensland and New South Wales. Of the 62,600 short-term visitors who arrived from Japan in August 2026, by state of intended stay:
- Queensland: 27,880 (45%)4
- New South Wales: 21,060 (34%)4
- Victoria: 7,810 (12%)4
- Western Australia: 4,030 (6%)4
- South Australia: 1,030 (2%)4
- Northern Territory: 310 (0.5%)4
- ACT: 260 (0.4%)4
- Tasmania: 220 (0.4%)4
Japan was the second-largest source of visitors to Queensland in August 2026, after New Zealand4. Over 2025 as a whole, 42% of Japanese visitors went to Queensland during their trip, compared with 29% of all international visitors5.
Campervan hire in Australia
Japanese tourism through the years
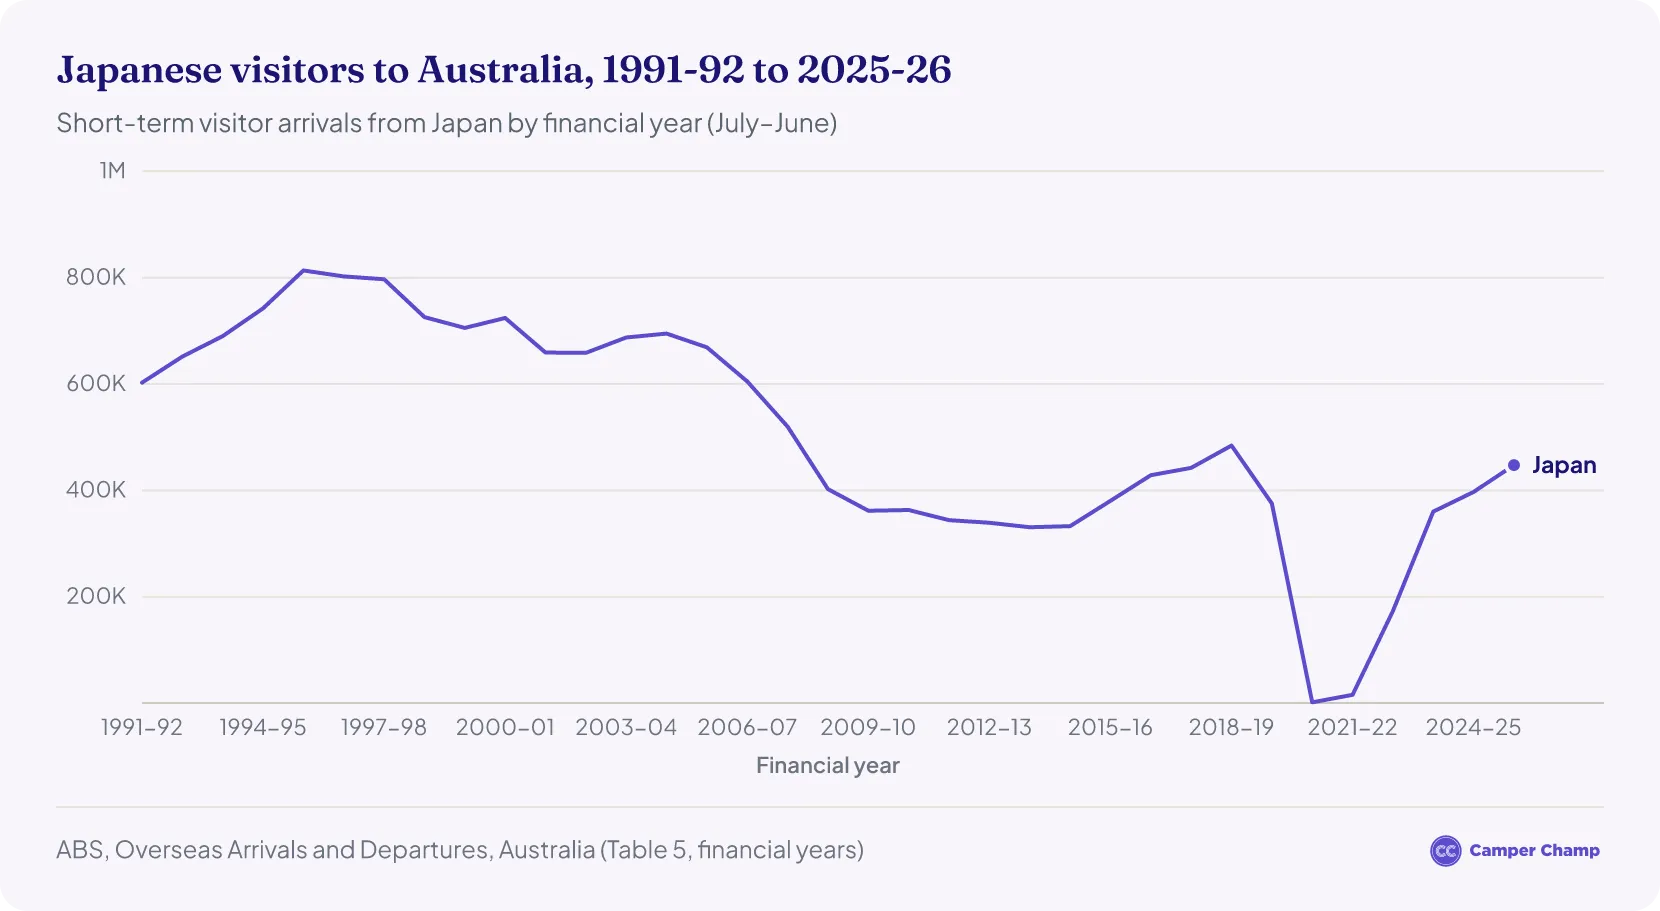
- Since peaking in 1995/96 with 813,500 visitors18, Japanese tourism has generally been on the decline and only started to increase again in 2014/15.
- Although Japanese tourism grew 9.5% in 2018/19, that year's total was still 40% lower than the ’90s peak18.
- After the pandemic, 447,600 visitors arrived from Japan in 2025/26, still 45% below the 1995/96 peak18.
Why has Japanese tourism struggled through the years?
- The economic situation is believed to be a major contributing factor to the lower numbers of tourists.
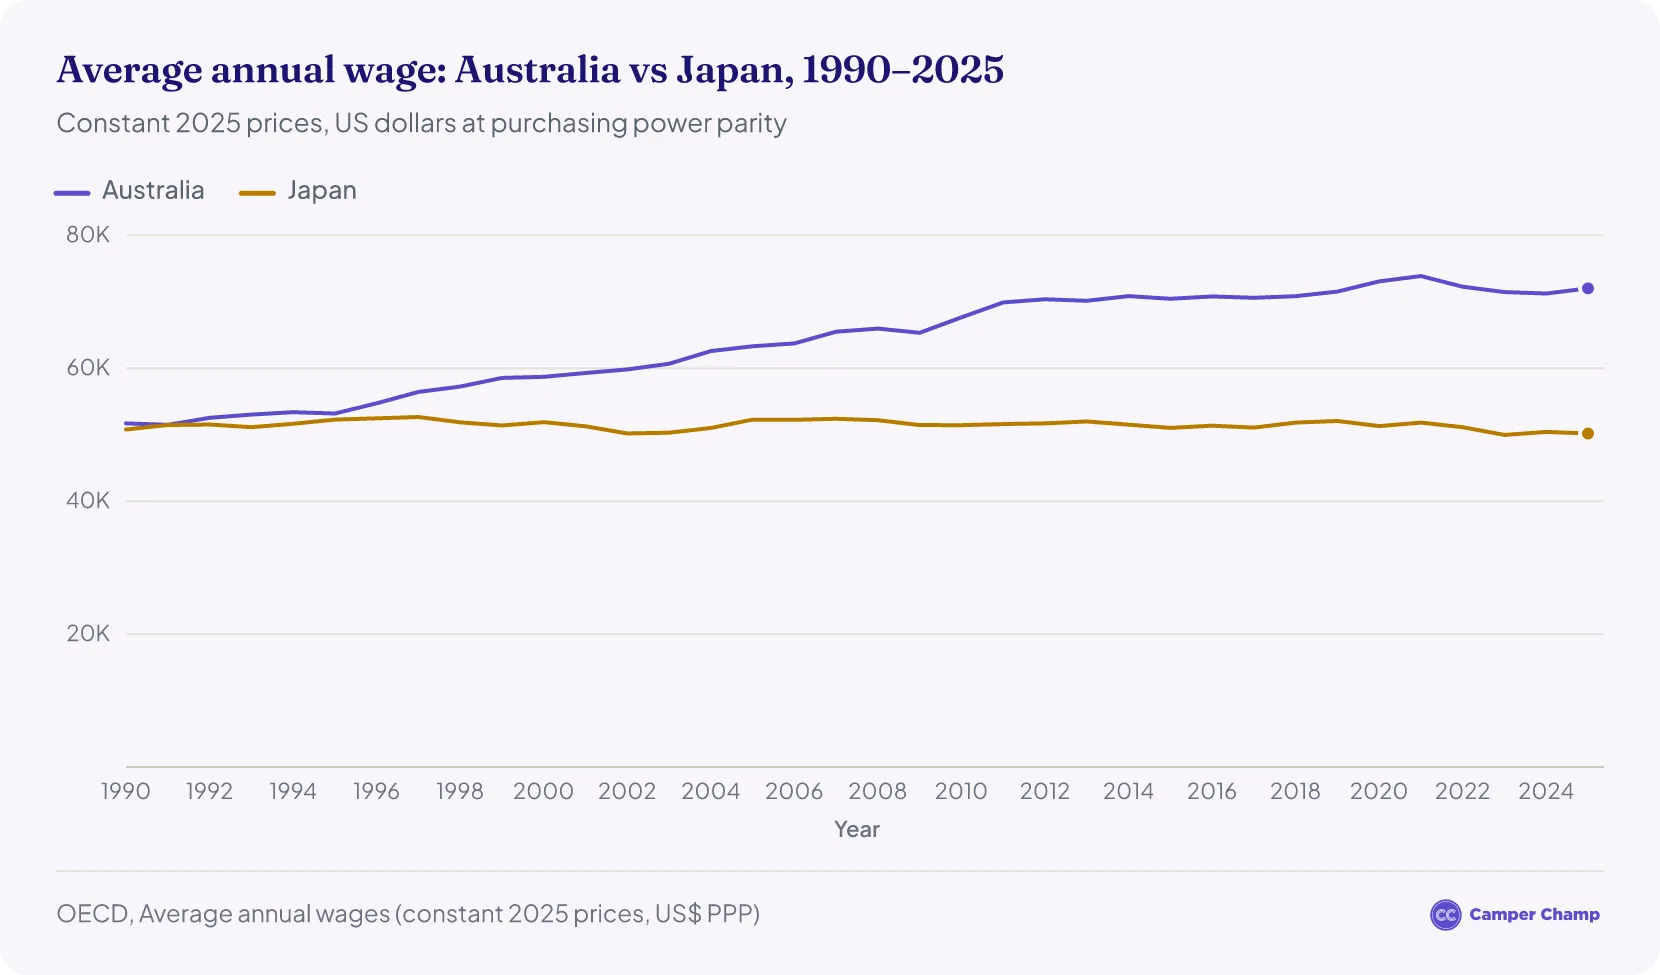
- Average wages in Japan have barely changed in 35 years19.
- In 2025, the average Japanese wage was about US$50,200 (in 2025 prices, adjusted for purchasing power), slightly lower than in 199019. Over the same period, the average Australian wage rose 39% to about US$72,000.
- On the other hand, Australia has had impressive economic performance over the last two decades and average weekly earnings have increased dramatically.
- As wages have increased, so have prices in Australia, which has made Australia a much more expensive destination for Japanese tourists.
Japan’s travel patterns and Australia’s share
- Despite having one of the strongest passports in the world, only about 17.5% of Japanese people held a valid passport at the end of 2024 (21.6 million passports)20, down from about a quarter before the pandemic21.
- Taiwan, South Korea and Hawaii were the top three travel destinations for Japanese tourists every year from 2008 to 201822.
- Australia ranked 9th on the list, according to one 2018 survey22.
- Australia ranked 6th on a list of places Japanese tourists would like to visit22, indicating numbers could rise in the coming years.
How many Japanese tourists visited Australia in 2020?
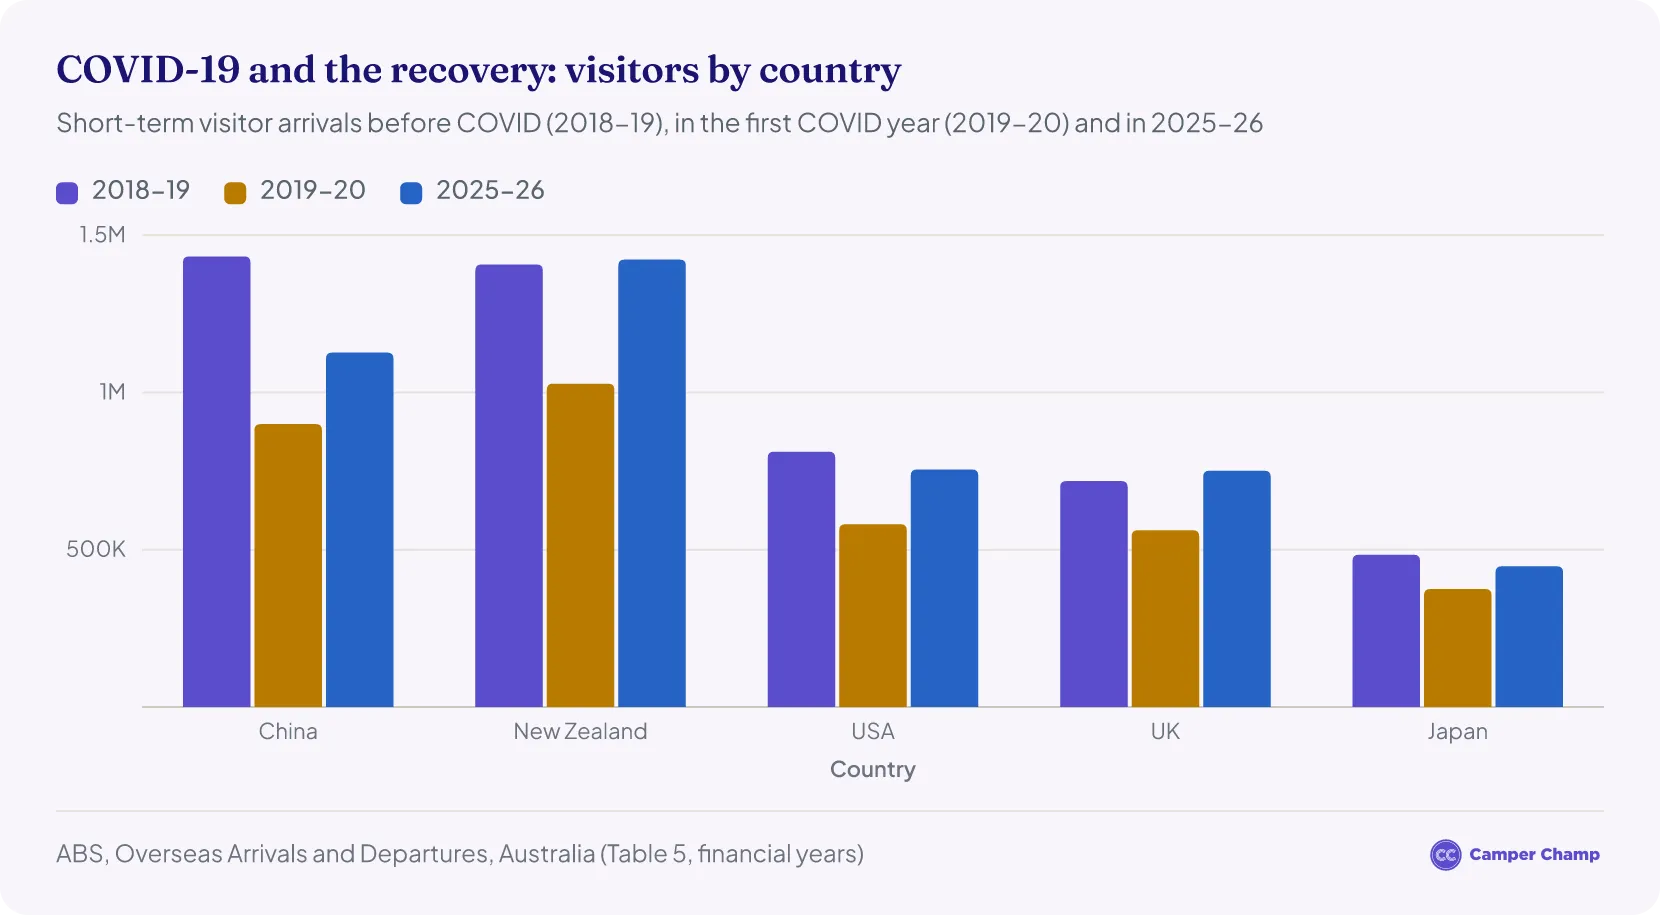
About 375,300 visitors from Japan travelled to Australia for the year ending June 202023.
- Visitors from Japan decreased by 22.5% when compared with the 484,000 of the previous year23.
- Japan was the 5th highest source of visitors to Australia in 2019/2023.
- The effects of the coronavirus travel restrictions are the main cause of this dramatic decrease.
- By 2025/26, arrivals from Japan had recovered to 447,600, or 92% of the 2018/19 level18.
Impact of the Coronavirus on Japanese Tourist Expenditure
Japanese visitors spent an estimated $1.58 billion during visits to Australia in the year ending June 202024.
How many Japanese tourists visited Australia in 2019?
Over 484,000 Japanese tourists visited Australia between July 2018 and June 201923.
Japanese tourism in Australia: quick answers
How much does a Japanese tourist spend in Australia?
On average, Japanese visitors spent about $4,200 per trip within Australia in 2025 ($1.62 billion across 385,000 trips)1. Including airfares and other costs outside Australia, the average trip cost about $6,000.
Other Resources
- Australia Tourism Statistics
- Chinese Tourism in Australia Statistics
- Hong Kong Tourism in Australia Statistics
- Indian Tourism in Australia Statistics
- Malaysia Tourism in Australia Statistics
- New Zealand Tourism in Australia Statistics
- Singapore Tourism in Australia Statistics
- South Korea Tourism in Australia Statistics
- UK Tourism in Australia Statistics
- USA Tourism in Australia Statistics
References
- International tourism results — year ending December 2025 (International Visitor Survey) · Tourism Research Australia ↑ b c d e f g h i j k l m n o p q r s t
- IVS results for the year ending December 2024 compared to December 2019 · Tourism Research Australia ↑ b c d e f g
- International tourism results — year ending June 2026 (International Visitor Survey) · Tourism Research Australia ↑ b c d
- Overseas Arrivals and Departures, Australia, August 2026 · Australian Bureau of Statistics ↑ b c d e f g h i j k l m n
- TRA market profile: Japan 2025 (Tourism Research Australia) · Tourism Research Australia ↑ b c d e f g h i j
- International Visitor Survey tourism results — year ending December 2021 compared with 2020 (Tourism Research Australia) · Tourism Research Australia ↑ b
- International Visitor Survey tourism results — year ending December 2022 compared with 2021 (Tourism Research Australia) · Tourism Research Australia ↑
- IVS results for the year ending December 2024 compared to December 2023 · Tourism Research Australia ↑ b c d e
- Overseas Arrivals and Departures, Australia, January 2026 · Australian Bureau of Statistics ↑ b c
- Overseas Arrivals and Departures, Australia, February 2026 · Australian Bureau of Statistics ↑ b c
- Overseas Arrivals and Departures, Australia, March 2026 · Australian Bureau of Statistics ↑ b c
- Overseas Arrivals and Departures, Australia, April 2026 · Australian Bureau of Statistics ↑ b c
- Overseas Arrivals and Departures, Australia, May 2026 · Australian Bureau of Statistics ↑ b c
- Overseas Arrivals and Departures, Australia, June 2026 · Australian Bureau of Statistics ↑ b c
- Overseas Arrivals and Departures, Australia, July 2026 (time series tables 1, 7 and 8) · Australian Bureau of Statistics ↑ b c
- Caravan and Camping State of Industry 2025 (Caravan Industry Association of Australia) · assets.pc.gov.au ↑
- NSW Government media release: NSW number one for caravan and camping trips · nsw.gov.au ↑
- Overseas Arrivals and Departures, Australia, August 2026 — Table 5: Short-term visitors arriving, selected countries of residence (original) · Australian Bureau of Statistics ↑ b c d
- OECD Average annual wages (constant 2025 prices, US dollars PPP) — Australia and Japan, 1990–2025 · sdmx.oecd.org ↑ b
- 旅券統計(令和6年1月~12月) — Passport statistics, January–December 2024 (Ministry of Foreign Affairs of Japan) · mofa.go.jp ↑
- Only one in six Japanese citizens has a passport, data shows (AFP via France 24, 21 February 2025) · france24.com ↑
- Taiwan, the Top Overseas Destination for Japanese Travelers (Nippon.com, November 2019) · nippon.com ↑ b c
- Overseas Arrivals and Departures, Australia, June 2020 · Australian Bureau of Statistics ↑ b c d
- International Visitor Survey results — year ending June 2020 (Tourism Research Australia) · Tourism Research Australia ↑ b
- TRA — International tourism results, Australia, March 2024 · Tourism Research Australia