

Updated
At a glance
- International visitors reached 3.82 million in 2025 and spent A$13.73 billion, up from A$10.90 billion in 2024.1
- In the year ending June 2026, Sydney had about 16.9 million overnight visitors, who spent A$26.3 billion.2 Including day trips, the total was 68.4 million.3
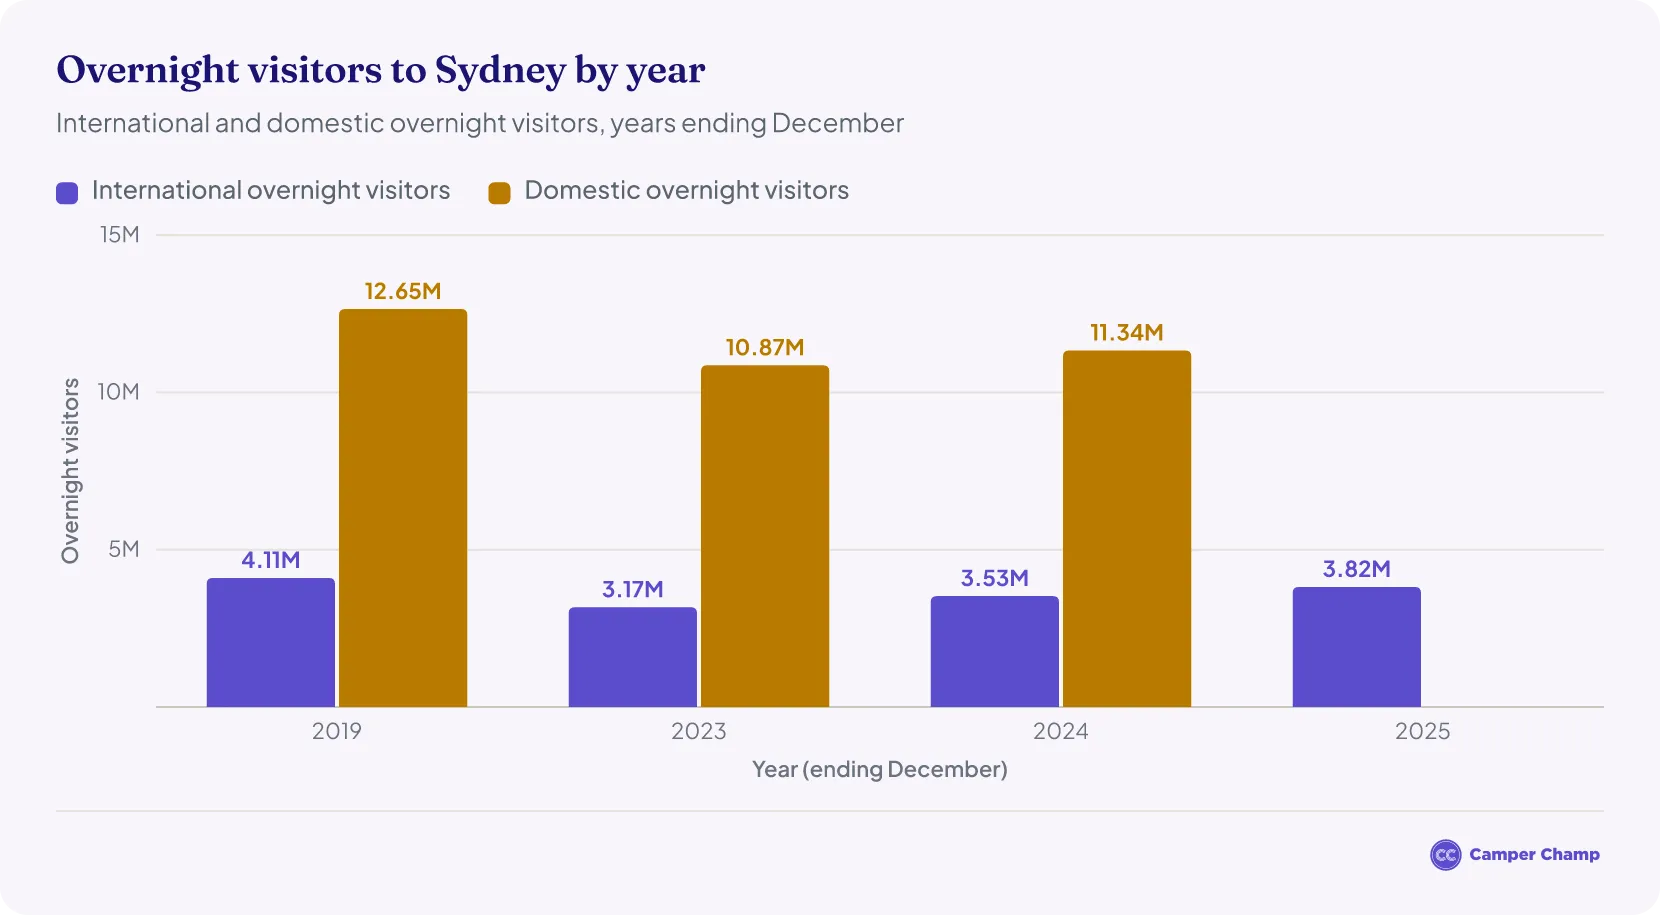
- About 14.87 million overnight visitors came to Sydney in 2024: 11.34 million domestic4 and 3.53 million international.5
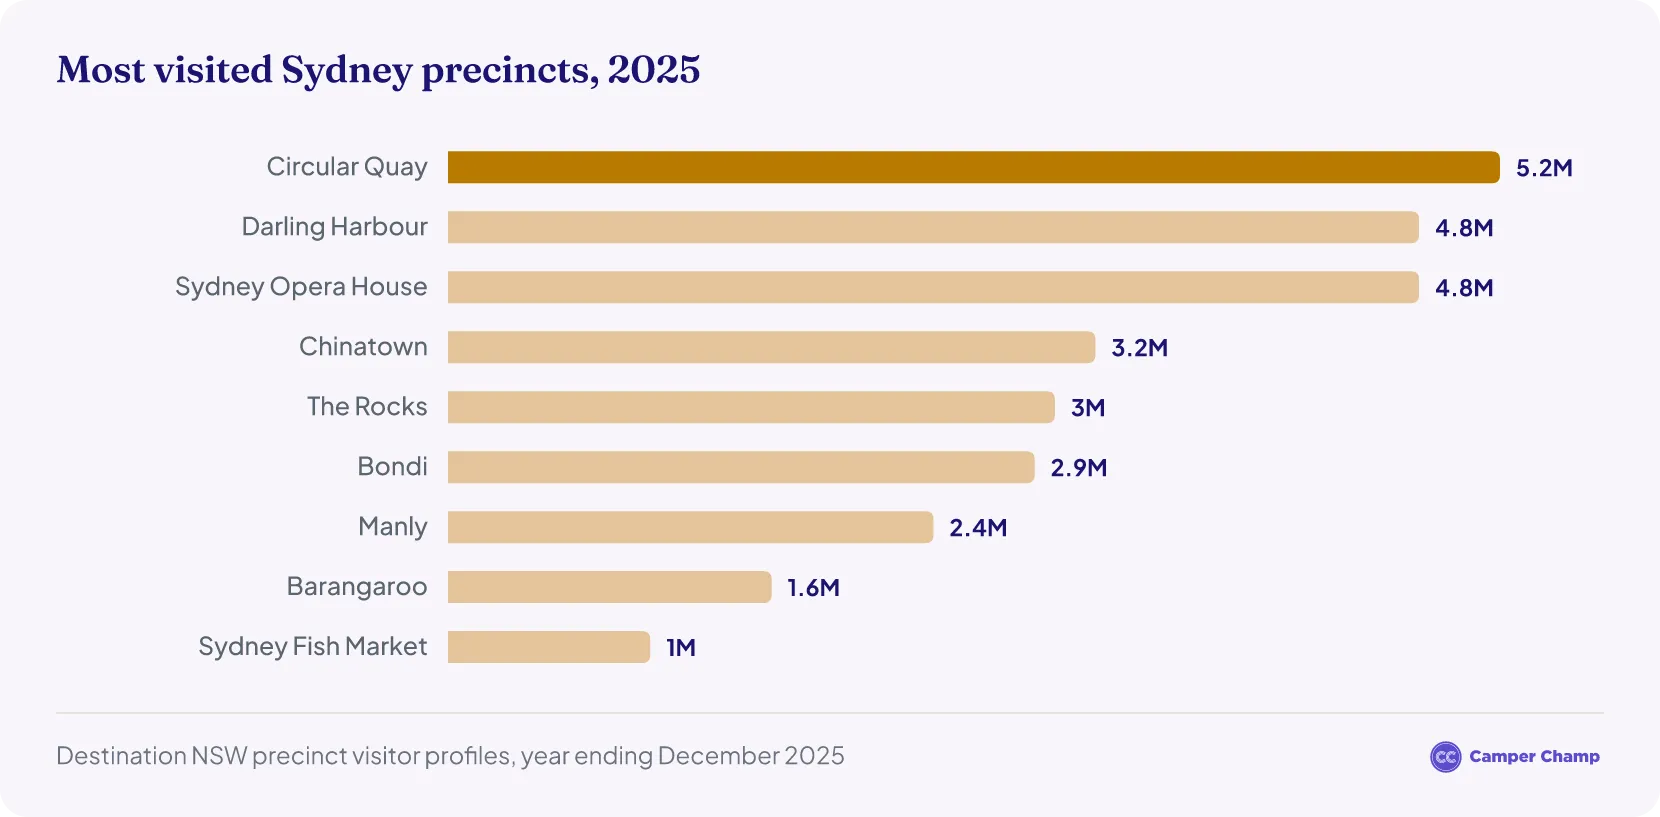
- Circular Quay was Sydney's most visited precinct in 2025, with about 5.2 million domestic overnight and international visitors.6
- More than 42.54 million passengers travelled through Sydney Airport in 2025.7
- Domestic figures from 2025 come from a new survey, so they can't be compared directly with earlier years.3
How many tourists visit Sydney each year?
About 3.82 million international visitors came to Sydney in 2025, up from 3.53 million in 2024.1 They stayed about 88.2 million nights in Sydney.
- About 14.87 million overnight visitors travelled to Sydney in 2024 (year ending December), the latest calendar year with a total for all visitors.54
- Of these, about 11.34 million were domestic trips4 and about 3.53 million international trips8.
- International visits in 2024 had recovered strongly from pandemic lows but were still about 14% below the 2019 peak of 4.11 million.9
- There is no 2025 total for all visitors: Sydney's domestic figures now come from Tourism Research Australia's new Domestic Tourism Statistics3, and the latest total covers the year ending June 2026.2
- During COVID-19 travel restrictions, visitor numbers fell to about 12.5 million in the year ending June 2020: 9.62 million domestic overnight visitors10 and 2.85 million international visitors11, down from 16.1 million a year earlier.12
How many tourists have visited Sydney in 2026?
Sydney welcomed about 16.9 million overnight visitors in the year ending June 2026: 13.0 million domestic overnight visitors and 3.84 million international visitors.2 Together they spent about A$26.3 billion.
- Including day trips, Sydney had 68.4 million visitors in the year ending June 2026, who spent A$35.1 billion.3
- International visitors were up 6.6% on a year earlier and spent about A$13.74 billion, up 14%.14
- Domestic overnight visitors stayed 2.6 nights on average and spent about A$371 a night.3
- Sydney ranked 2nd among Australia's capital cities for domestic overnight visitors.3
- Domestic figures now come from Tourism Research Australia's Domestic Tourism Statistics, which replaced the National Visitor Survey in 2025, so they can't be compared directly with the 2024 figures above.3 No total for January–June 2026 has been published yet; the year ending June 2026 is the latest period available.
Where do Sydney's international tourists come from?
China sent the most international visitors to Sydney in the year ending June 2026, with 15% of the 3.8 million total.3 The USA (12%), New Zealand (10%), the UK (9%) and South Korea (8%) made up the rest of the top five.
- Just over half (52%) of international visitors came for a holiday, 27% to visit friends and relatives, 8% for business and 5% for education.3
- Education visitors made up only 5% of international visitors, but accounted for 43% of all international visitor spending in Sydney and 29% of nights.3
- Almost half (49%) were making their first visit to Australia, and 66% travelled independently rather than on a package tour.3
How much money does Sydney make from tourism?
International visitors spent about A$13.73 billion in Sydney in 2025, up from A$10.90 billion in 2024.1 No 2025 domestic spending total has been published for Sydney.
- International visitors spent about A$13.74 billion in Sydney in the year ending June 2026, up 14% on a year earlier.2
- In 2024 (year ending December), visitors spent about A$23.09 billion in Sydney.54
- Domestic visitors spent about A$12.19 billion of this4 (up from A$11.43 billion in 2023) and international visitors about A$10.90 billion5.
- That international figure was about 5% higher than in 2019 (A$10.35 billion).9
| Visitor spending in Sydney | ||
|---|---|---|
| Year | International | Domestic |
| 2025 | A$13.73 B1 | Not available |
| 2024 | A$10.90 B5 | A$12.19 B4 |
| 2023 | A$9.92 B5 | A$11.43 B4 |
| 2019 | A$10.35 B9 | A$9.39 B13 |
Source · Data source: Tourism Research Australia, National Visitor Survey and International Visitor Survey (years ending December).
Is Sydney the most visited city in Australia?
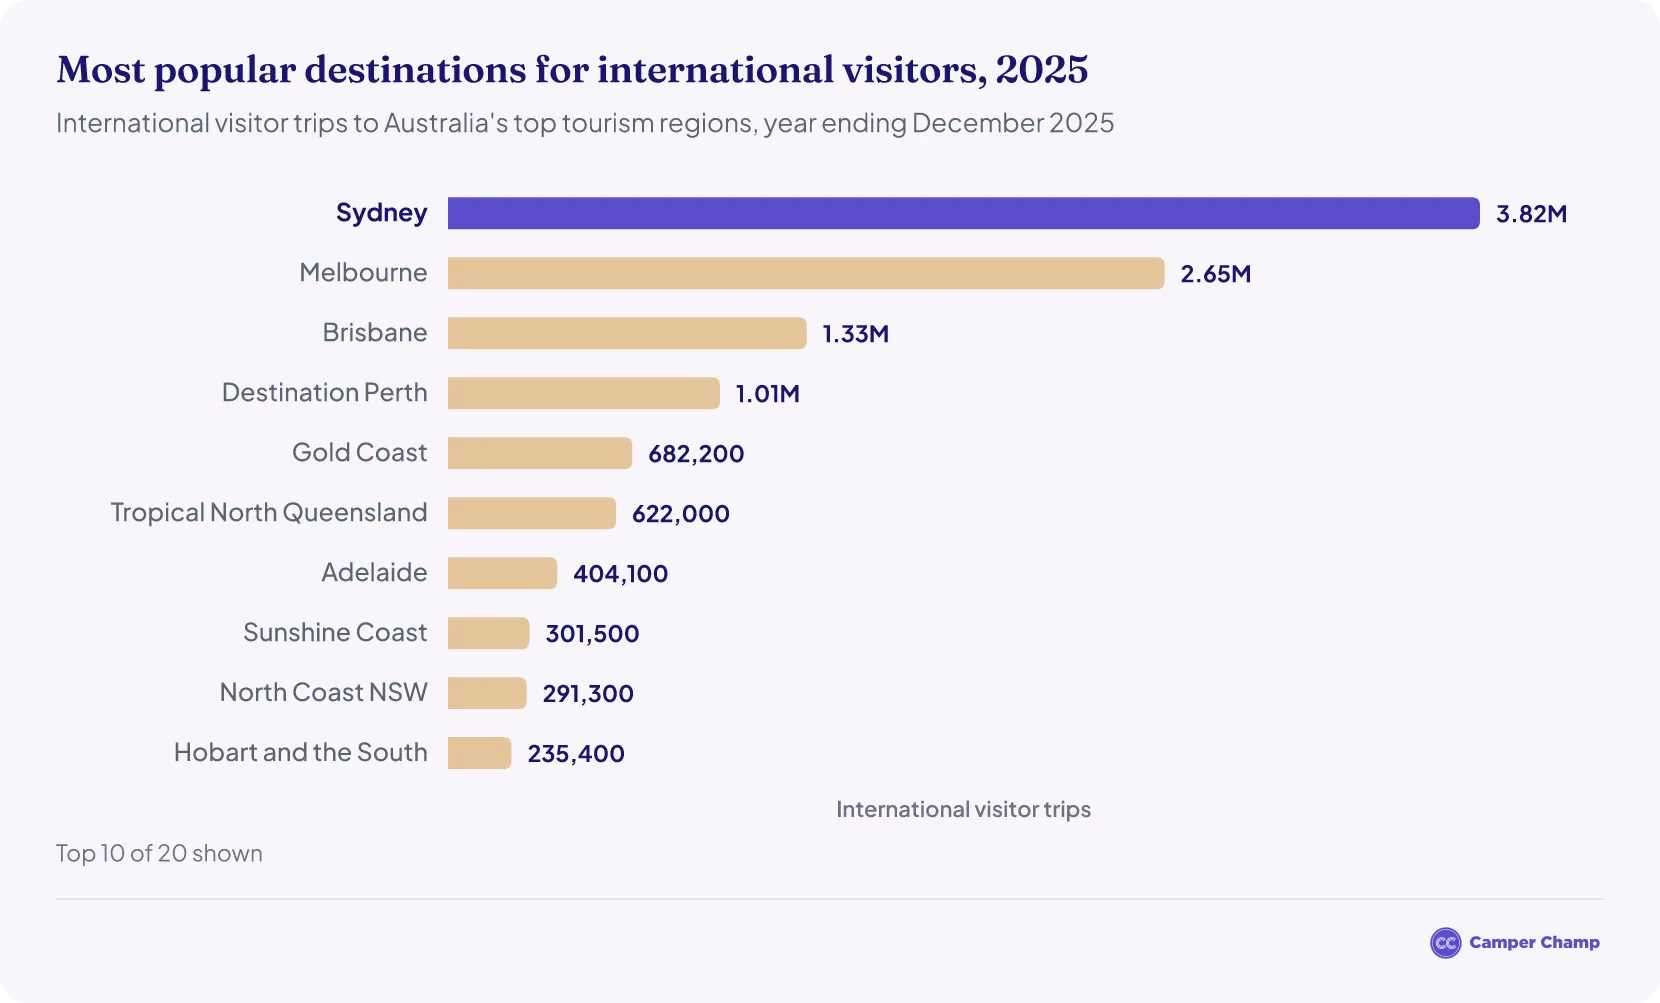
- In 2025 (year ending December), Sydney was the most visited destination in Australia for international travellers, with 3.82 million visitors, ahead of Melbourne with 2.65 million.1
- In the year ending June 2026, Sydney ranked 1st among Australia's capital cities for international visitors, but 2nd for total visitors including day trips and for domestic overnight visitors.3
Which Australian destination makes the most money from tourism?
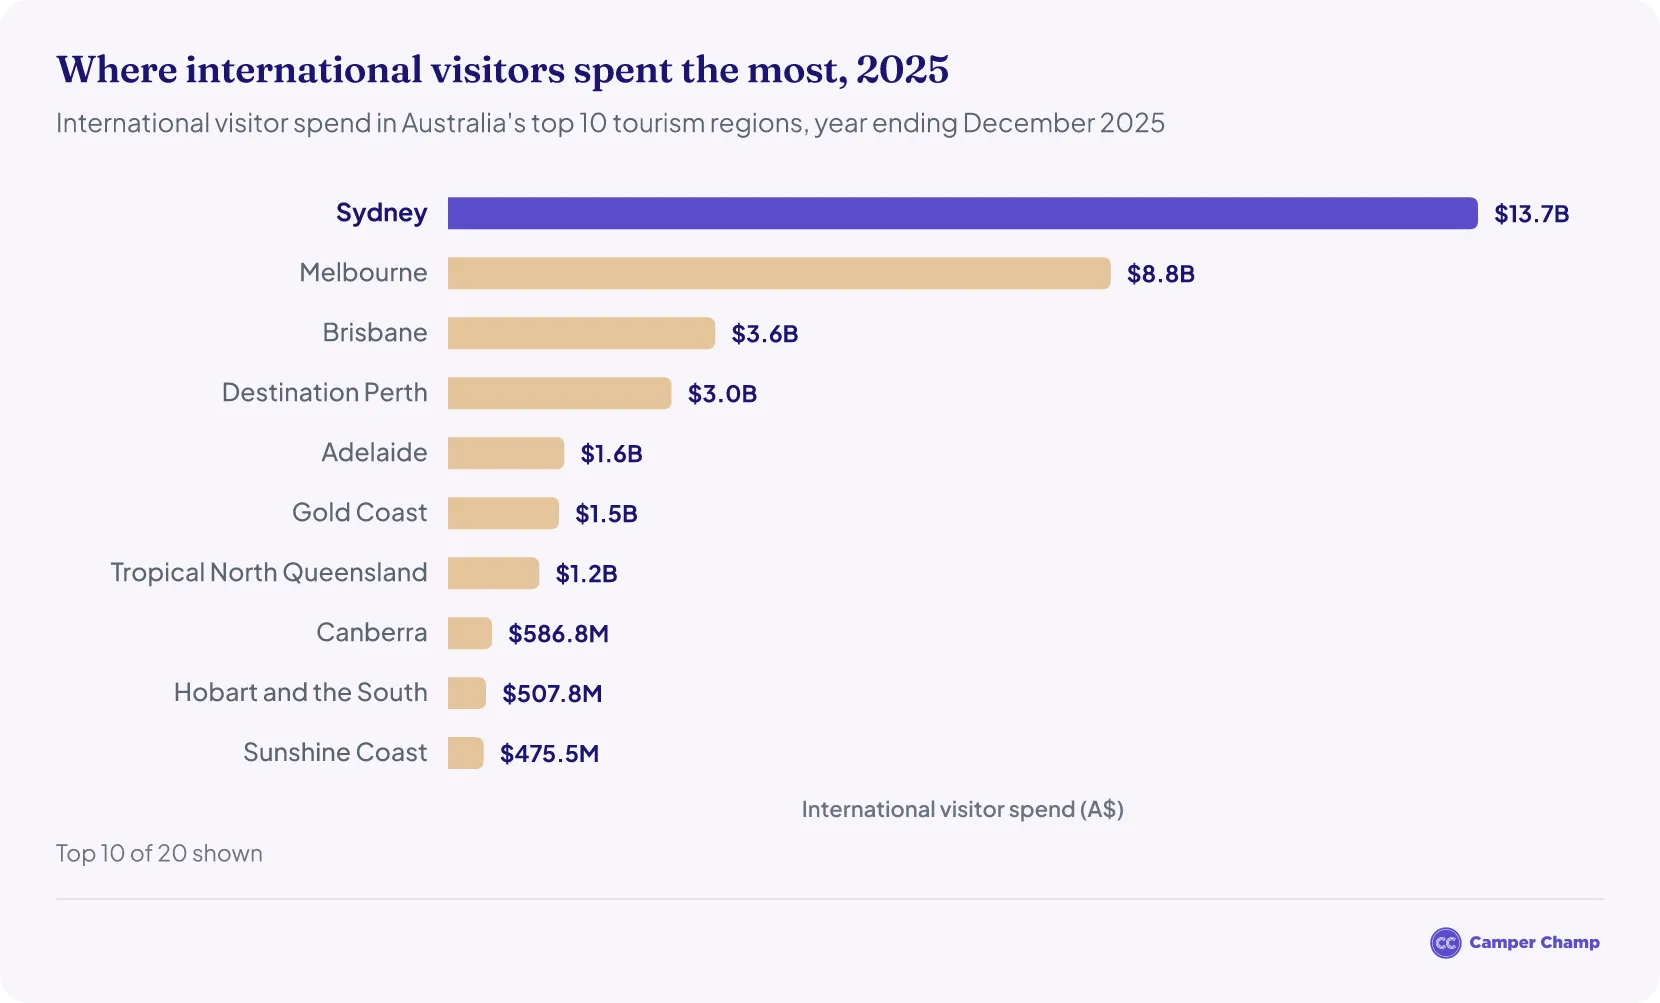
- Sydney had the highest international visitor spend of any Australian destination in 2025 (year ending December), at A$13.73 billion, ahead of Melbourne at A$8.84 billion.1
- In the year ending June 2026, visitors spent A$35.1 billion in Sydney including day trips, the most of any Australian capital city and 31% of all capital-city visitor spending.3
- Counting domestic and international visitors together, Sydney also led in 2024 (year ending December), with A$23.09 billion in visitor spending, ahead of Melbourne's A$20.80 billion.54
How much do international tourists spend per night in Sydney?
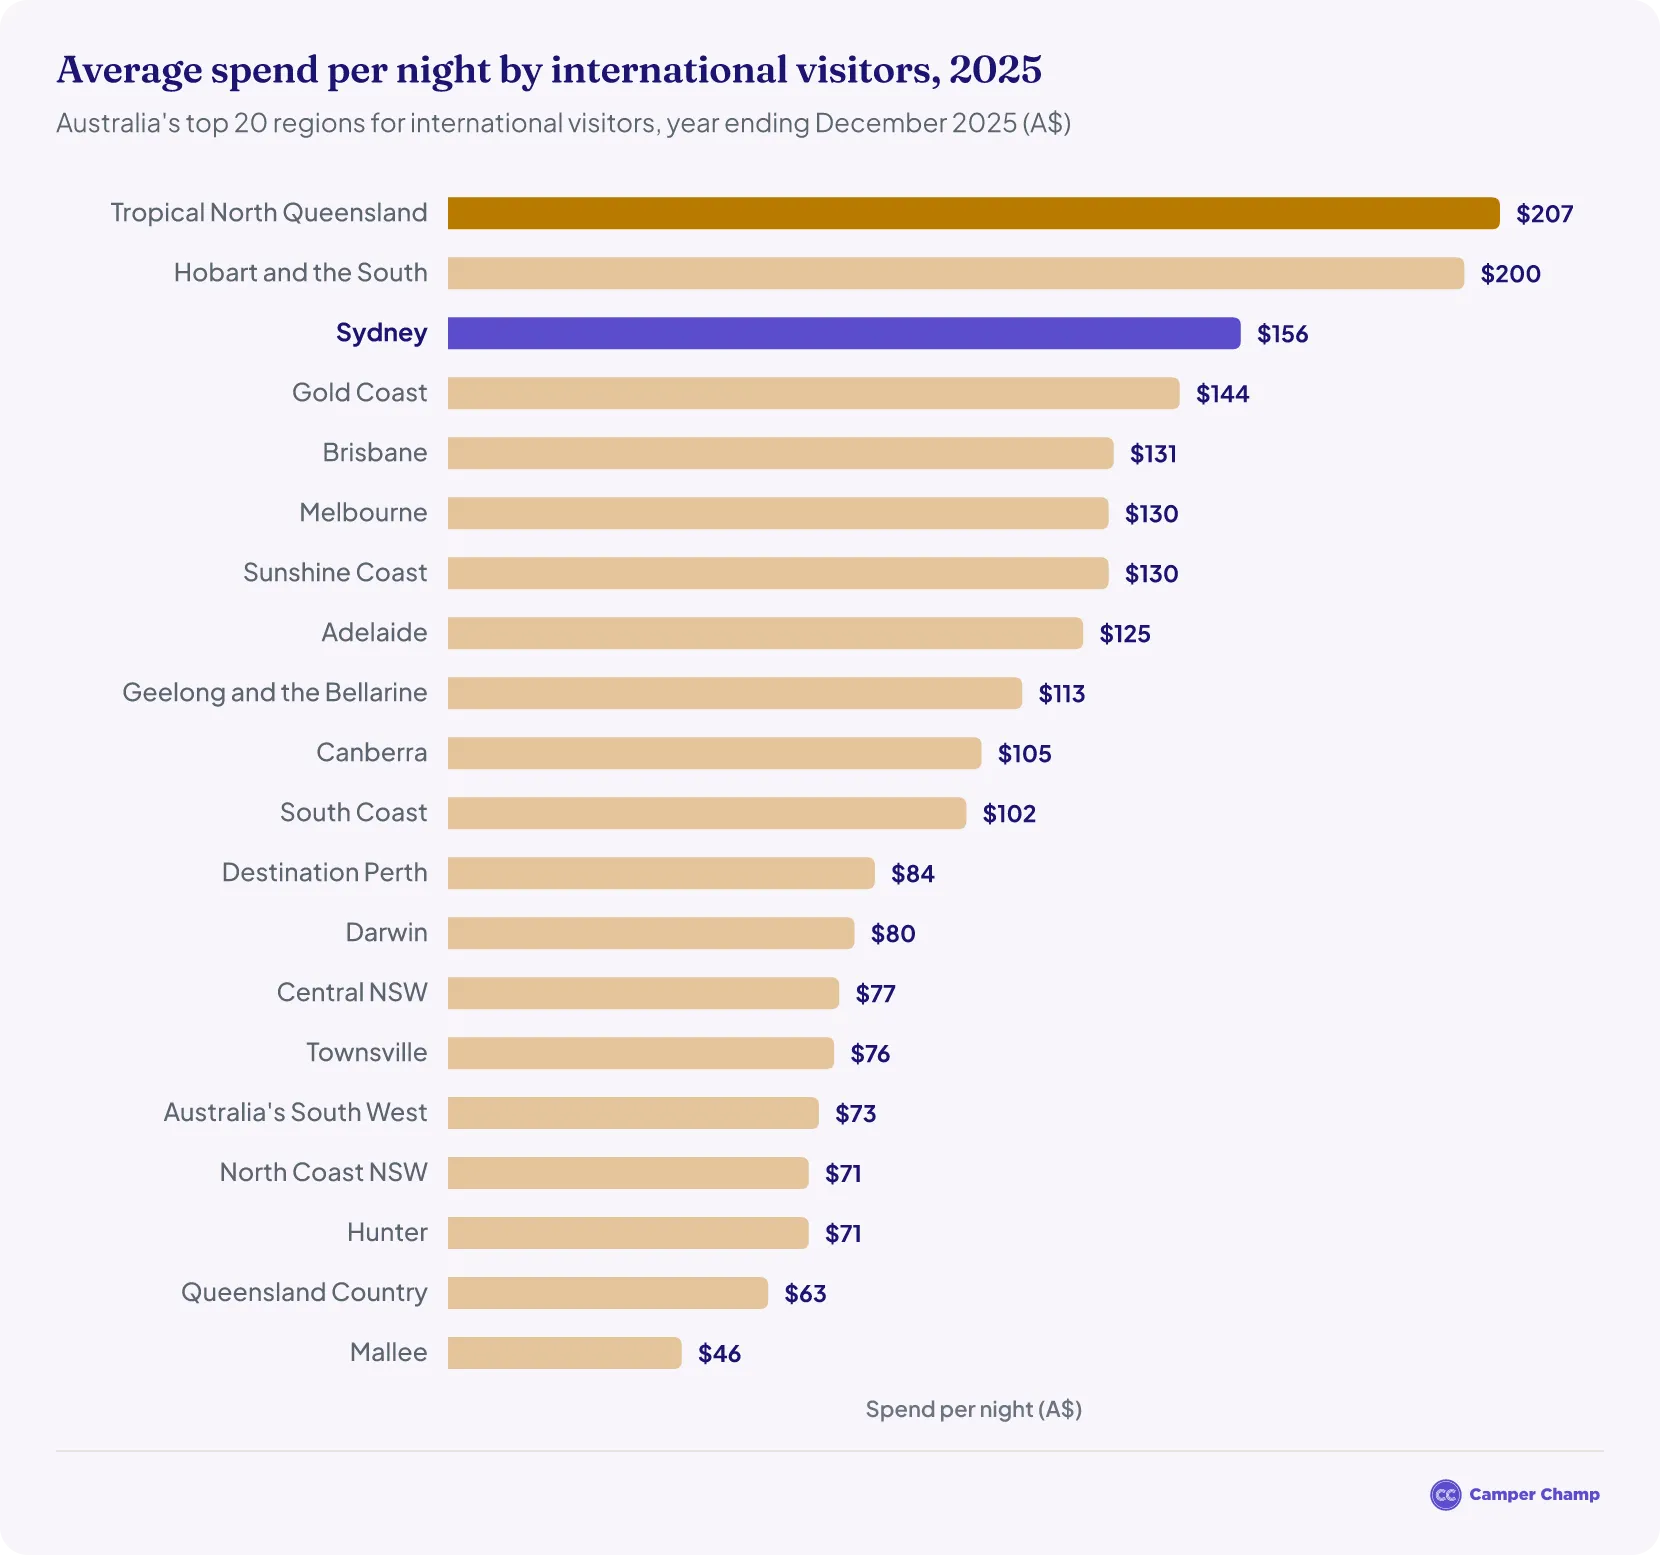
- International visitors spent an average of about A$156 per night in Sydney in 2025 (A$13.73 billion over 88.2 million nights)1, up from A$126 in 2019.9 That ranked Sydney 3rd among Australia's top 20 regions for international visitors, behind Tropical North Queensland and Hobart and the South.
- In the year ending June 2026, the average was A$154 per night, up from A$123 in the year ending June 2019.2
- On that measure Sydney ranked 4th of the top 20 regions, behind Hobart and the South, Tropical North Queensland and the Whitsundays.14
- Each visitor spent about A$3,574 per trip on average, up from A$2,499 in the year ending June 2019.2
How long do international tourists stay in Sydney?
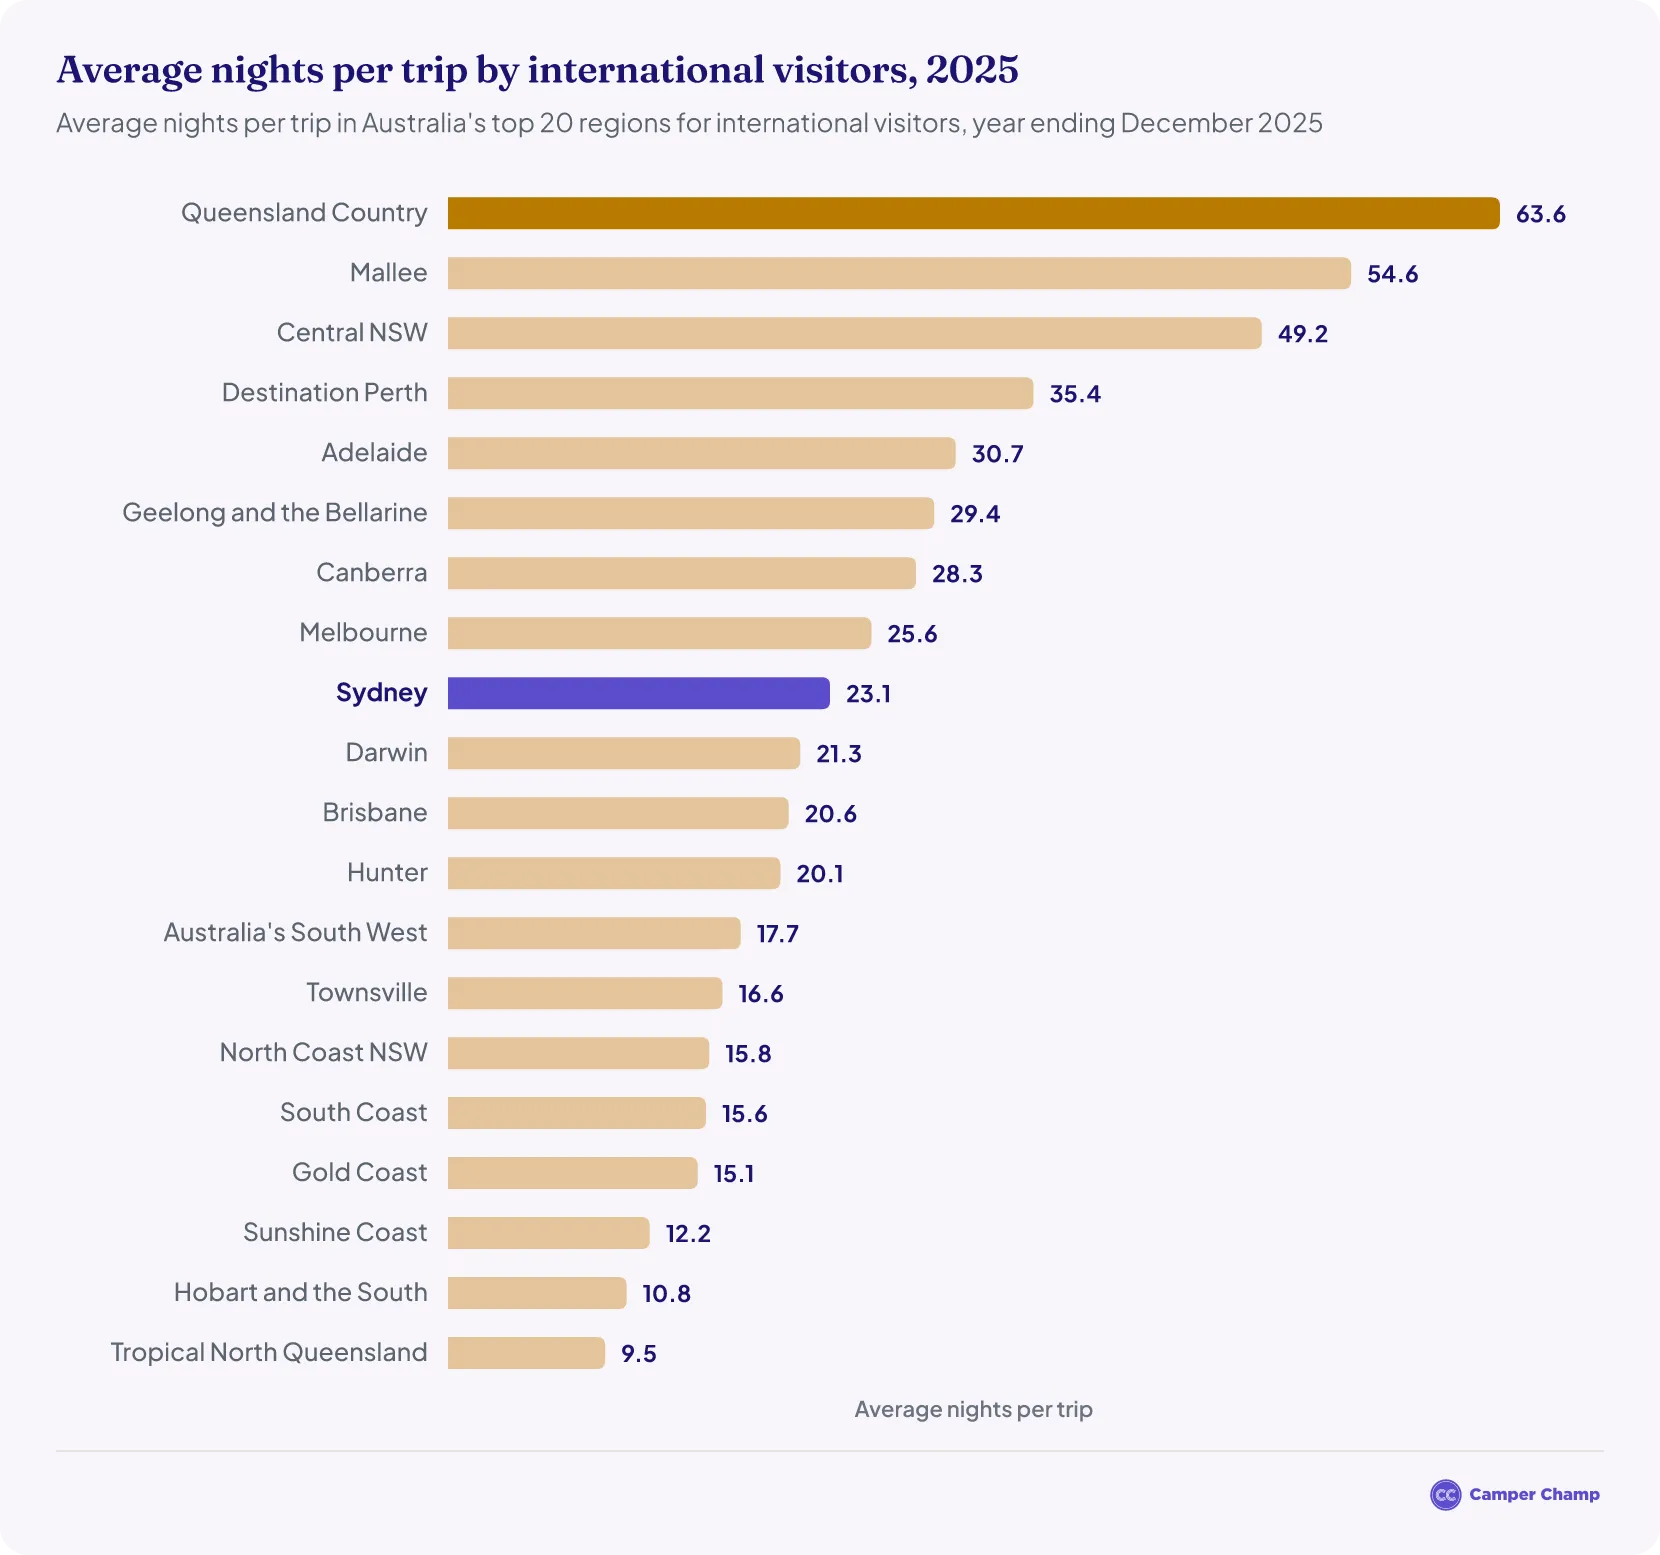
- In 2025, international tourists stayed in Sydney for an average of about 23.1 nights per trip (88.2 million nights over 3.82 million trips), down from 23.7 nights in 2024.1 That ranked Sydney 9th among Australia's top 20 regions for international visitors; Queensland Country had the longest stays (63.6 nights), and Melbourne averaged 25.6 nights.
- In the year ending June 2026, the average stay was also 23.1 nights2, up from 20.3 nights in the year ending June 2019.
- Sydney again ranked 9th of the top 20 regions.14 The longest stays were in Queensland Country (53.4 nights) and Central NSW (41.9 nights), while Melbourne averaged 26.3 nights.
Campervan hire in Australia
- Alice Springs motorhome hire
- Broome campervan rental
- Cairns campervan rental
- Campervan hire in Adelaide
- Campervan hire in Brisbane
- Campervan hire in Darwin
- Campervan hire in Gold Coast
- Devonport campervan rental
- Hobart campervan rental
- Launceston campervan rental
- Melbourne campervan rental
- Perth
- Sydney
- Tasmania motorhome hire
What are the most visited attractions in Sydney?
Circular Quay is the most visited part of Sydney, with about 5.2 million domestic overnight and international visitors in 2025.6 Darling Harbour and the Sydney Opera House followed, with about 4.8 million each.15
- The Opera House draws the most international visitors: about 2.83 million in 2025, three in four (74.1%) of all international visitors to Sydney.16
- Barangaroo had the fastest growth in international visitors, up 23.9% on 2024.17
- The counts cover domestic overnight and international visitors who went to each precinct during their trip6, so they leave out day trippers, and a visitor who went to several precincts counts in each.
| Most visited Sydney precincts, 2025 | |||
|---|---|---|---|
| Precinct | Total visitors | Domestic overnight | International |
| Circular Quay | 5.2 million6 | 2.75 million6 | 2.46 million6 |
| Darling Harbour | 4.8 million15 | 2.67 million15 | 2.11 million15 |
| Sydney Opera House | 4.8 million16 | 1.99 million16 | 2.83 million16 |
| Chinatown | 3.2 million18 | 1.52 million18 | 1.72 million18 |
| The Rocks | 3.0 million19 | 1.63 million19 | 1.37 million19 |
| Bondi | 2.9 million20 | 1.11 million20 | 1.82 million20 |
| Manly | 2.4 million21 | 1.32 million21 | 1.03 million21 |
| Barangaroo | 1.6 million17 | 1.06 million17 | 0.51 million17 |
| Sydney Fish Market | 1.0 million22 | 0.36 million22 | 0.63 million22 |
How many people visit the Sydney Opera House each year?
- The Sydney Opera House had about 4.8 million domestic overnight and international visitors in 2025.16
- The Opera House's own figure is higher, at more than 10.9 million people a year23, because it counts everyone who comes to the site, not only tourists. It doesn't say which year that figure covers.
How many people visit Bondi Beach every year?
- About 2.9 million domestic overnight and international visitors went to Bondi Beach in 2025.20
- About 1.82 million were international visitors, up 10.2% on 2024.20 Nearly half (47.7%) of all international visitors to Sydney went to Bondi.
- About 1.11 million were domestic overnight visitors.20
How many people visit the Sydney Harbour Bridge each year?
How many cruise ships visit Sydney?
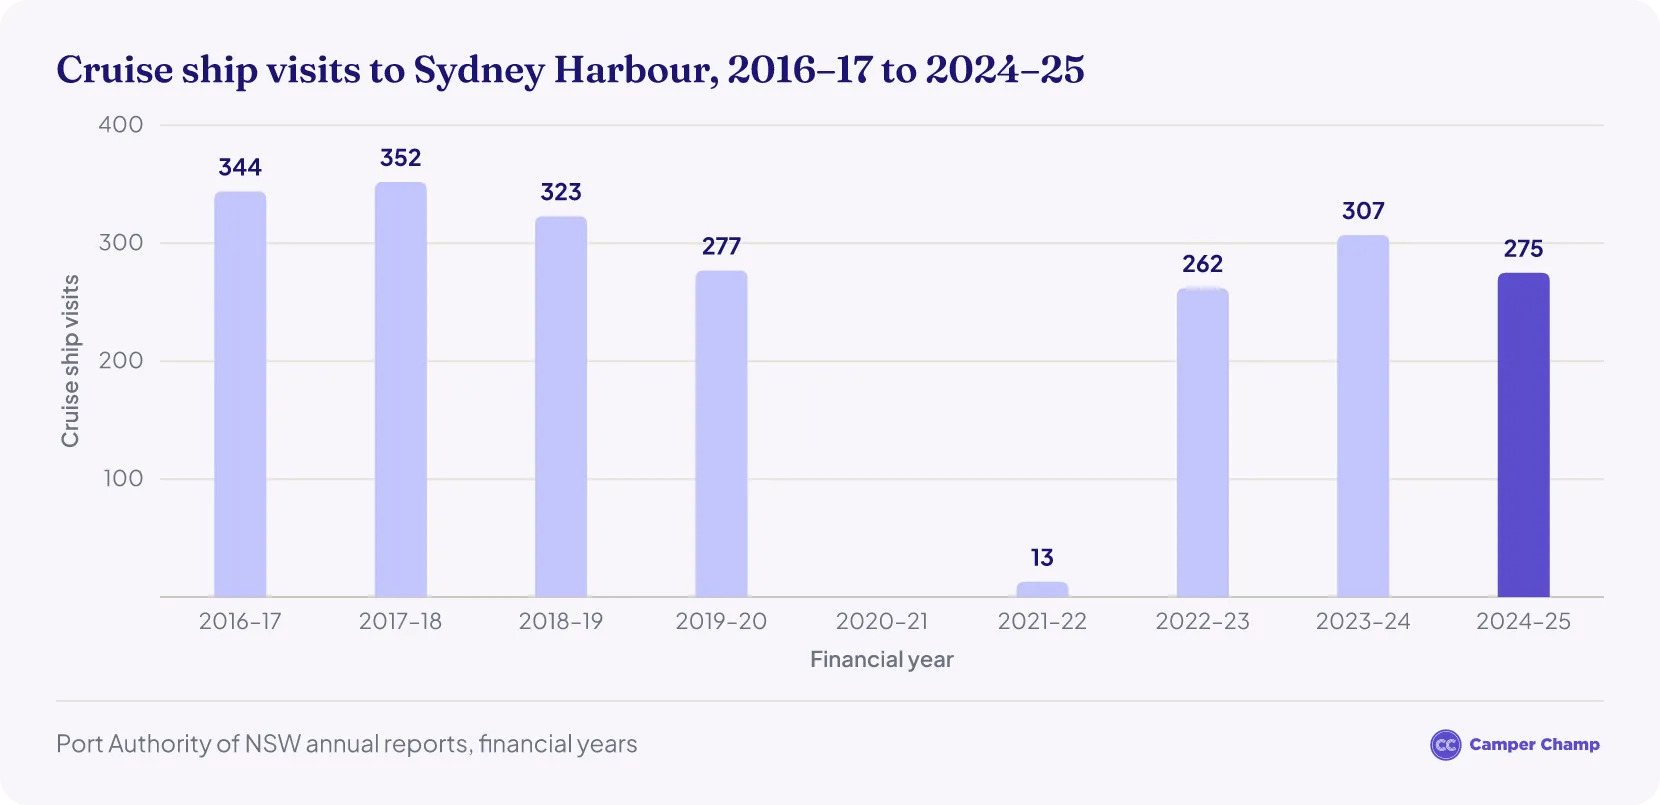
Sydney Harbour had 275 cruise ship visits in 2024–25, from 40 different ships.24 That was down 10% from 307 in 2023–24.25
- Ship visits peaked at 352 in 2017–18.26 That year about 1.6 million passengers got on or off cruise ships in Sydney Harbour, the most in the published series.27
- Cruising stopped during the pandemic: Sydney had no cruise ship visits in 2020–21 and 13 in 2021–22.28
- Close to 1 million passengers passed through the Overseas Passenger Terminal and White Bay Cruise Terminal in 2022–23.29
- Port Authority of NSW says cruise ship visits generate around A$4.41 billion a year for the NSW economy and support over 13,000 jobs.25
Figures are for financial years (July to June). Passenger numbers count everyone getting on or off a ship27, and Port Authority of NSW stopped publishing exact Sydney passenger totals after 2019–20.
How many passengers use Sydney Airport?
More than 42.54 million passengers travelled through Sydney Airport in 2025, up 2.7% on 2024.7 A record 17.17 million of them flew through the T1 International terminal.
- October to December 2025 was the airport's busiest quarter on record for international travel, with more than 4.62 million passengers.7
- In the first half of 2026, more than 20.7 million passengers used the airport, 1.5% more than a year earlier.30
- International passengers rose 2.1% to 8.44 million in the first half of 2026, and domestic passengers rose 1.0% to 12.29 million.30
These are Sydney Airport's own counts of arriving and departing passengers.
How many tourists visit New South Wales each year?
About 4.11 million international visitors came to New South Wales in 2025, up 8.0% on 2024. They stayed 105.9 million nights and spent A$15.0 billion, up 25.1%.1 No 2025 domestic total has been published for NSW.
About 130.6 million visitors travelled to New South Wales in the year ending June 2026, up 5.1% on a year earlier.31 They spent A$62.9 billion, up 12.8%.
- Domestic visitors made up 126.4 million of them and spent A$47.8 billion.31 Of these, 39.2 million stayed overnight.
- 4.1 million international visitors stayed 106.6 million nights and spent A$15.1 billion.31
- For more, see our NSW tourism statistics.
Sydney camping & campervan statistics
New South Wales is Australia's most popular state for caravan and camping trips:32 5.5 million domestic caravan and camping visitors went there in 2025, and they stayed 18.2 million nights.
- Sydney drew 8% of those visitors, making it the fifth most popular NSW region for caravan and camping, after the North Coast (26%), South Coast (17%), The Murray (10%) and the Hunter (10%).32
- International caravan and camping visitors to NSW rose 10.4% in 2025 to about 86,000, and they stayed 801,500 nights, up 24.3%.32
- Across Australia, travellers took 17.3 million caravan and camping trips in 2025 and spent A$12.6 billion.32
- NSW had 229,719 registered caravans, campervans and motorhomes in January 2025, second only to Queensland.33
- For national figures, see Australia camping statistics.
FAQs
Have Sydney's visitor numbers returned to 2019 levels?
Not yet. International visitors reached 3.82 million in 20251, still short of the 4.11 million in 2019.9 There is no 2025 total for all visitors; the latest calendar-year total, about 14.87 million overnight visitors in 20244, was below the 16.76 million recorded in 2019.13 Spending has recovered faster: international visitors spent about A$13.73 billion in 20251, about a third more than the A$10.35 billion they spent in 2019.9
What is the busiest time of year for tourists in Sydney?
For international visitors, the December and March quarters are busiest: each brought 29% of Sydney's international visitors in the year ending June 2026, ahead of the September quarter (23%) and the June quarter (19%).3 October to December 2025 was also Sydney Airport's busiest quarter on record for international travel.7
Where do Sydney's tourism statistics come from?
Visitor numbers and spending come from Tourism Research Australia. International figures come from its International Visitor Survey.14 Domestic figures came from the National Visitor Survey until 2024; from 2025 they come from Domestic Tourism Statistics, published for Sydney by Destination NSW.3 Precinct figures come from Destination NSW's visitor profiles6, cruise figures from Port Authority of NSW25 and airport figures from Sydney Airport.7
More tourism statistics
- Bondi Beach Tourism Statistics
- Brisbane Tourism Statistics
- Byron Bay Tourism Statistics
- Cradle Mountain Tourism Statistics
- Darwin Tourism Statistics
- Esperance Tourism Statistics
- Fraser Island Tourism Statistics
- Great Ocean Road Tourism Statistics
- Queensland Tourism Statistics
- Sydney Opera House Tourism Statistics
- Tasmania Tourism Statistics
- Whitsundays Tourism Statistics
References
- International tourism results — year ending December 2025 (International Visitor Survey) · Tourism Research Australia ↑ b c d e f g h i j k l m
- Travel to Sydney Tourism Region — time series, year ended June 2026 (Destination NSW; TRA Domestic Tourism Statistics & International Visitor Survey) · destinationnsw.com.au ↑ b c d e f g h i
- Travel to Sydney — visitor profile, year ending June 2026 (Destination NSW) · cdn.sanity.io ↑ b c d e f g h i j k l m n o p q r s t u
- NVS results data tables for the year ending December 2024 compared to December 2023 (Tourism Research Australia) · Tourism Research Australia ↑ b c d e f g h i j k l
- IVS results for the year ending December 2024 compared to December 2023 · Tourism Research Australia ↑ b c d e f g h i j k
- Circular Quay visitor profile, year ending December 2025 (Destination NSW) · cdn.sanity.io ↑ b c d e f g h
- Sydney Airport Traffic and Operational Performance Q4 2025 (4 February 2026) · sydneyairport.com.au ↑ b c d e
- Record-breaking year for international tourism in NSW (Destination NSW) · destinationnsw.com.au ↑
- IVS results for the year ending December 2024 compared to December 2019 · Tourism Research Australia ↑ b c d e f g h
- National Visitor Survey results — year ending June 2020 (Tourism Research Australia) · Tourism Research Australia ↑
- International Visitor Survey results — year ending June 2020 (Tourism Research Australia) · Tourism Research Australia ↑
- National Visitor Survey results — year ending June 2019 (Tourism Research Australia) · Tourism Research Australia ↑
- NVS results data tables for the year ending December 2023 compared to December 2019 (Tourism Research Australia) · Tourism Research Australia ↑ b c d e f
- International tourism results — year ending June 2026 (International Visitor Survey) · Tourism Research Australia ↑ b c d e
- Darling Harbour visitor profile, year ending December 2025 (Destination NSW) · cdn.sanity.io ↑ b c d
- Sydney Opera House visitor profile, year ending December 2025 (Destination NSW) · cdn.sanity.io ↑ b c d e
- Barangaroo visitor profile, year ending December 2025 (Destination NSW) · cdn.sanity.io ↑ b c d
- Chinatown visitor profile, year ending December 2025 (Destination NSW) · cdn.sanity.io ↑ b c
- The Rocks visitor profile, year ending December 2025 (Destination NSW) · cdn.sanity.io ↑ b c d
- Bondi visitor profile, year ending December 2025 (Destination NSW) · cdn.sanity.io ↑ b c d e f
- Manly visitor profile, year ending December 2025 (Destination NSW) · cdn.sanity.io ↑ b c
- Sydney Fish Market visitor profile, year ending December 2025 (Destination NSW) · cdn.sanity.io ↑ b c
- Sydney Opera House — Facts About the Sydney Opera House · sydneyoperahouse.com ↑
- A year of progress — FY2025 (Port Authority of NSW) · portauthoritynsw.com.au ↑
- Port Authority of NSW Annual Report 2024/25 · portauthoritynsw.com.au ↑ b c
- Port Authority of NSW Annual Report 2020/21 · portauthoritynsw.com.au ↑
- Port Authority of NSW Annual Report 2019/20 · portauthoritynsw.com.au ↑ b
- Port Authority of NSW Annual Report 2023/24 · portauthoritynsw.com.au ↑
- Port Authority of NSW Annual Report 2022/23 · portauthoritynsw.com.au ↑
- Sydney Airport Traffic and Operational Performance Q2 2026 (3 August 2026) · sydneyairport.com.au ↑ b
- Destination NSW Research & Statistics — visitor spend, nights spent, origin and purpose of visit · destinationnsw.com.au ↑ b c
- NSW number one for caravan and camping trips (Destination NSW media release, 14 August 2026) · destinationnsw.com.au ↑ b c d
- Australian caravan and camping industry statistics (Caravan Industry Association of Australia, updated 8 September 2026) · caravanindustry.com.au ↑
- TRA — International tourism results, Australia, March 2024 · Tourism Research Australia