

Updated
At a Glance
- Tourists made 43.32 million overnight trips to New South Wales in 2025: 39.21 million by Australians1 and 4.11 million by international visitors2.
- In the first half of 2026, tourists made about 21.45 million overnight trips to the state3 and spent about A$23.77 billion4.
- Australians also made about 84.0 million day trips in New South Wales in 20255.
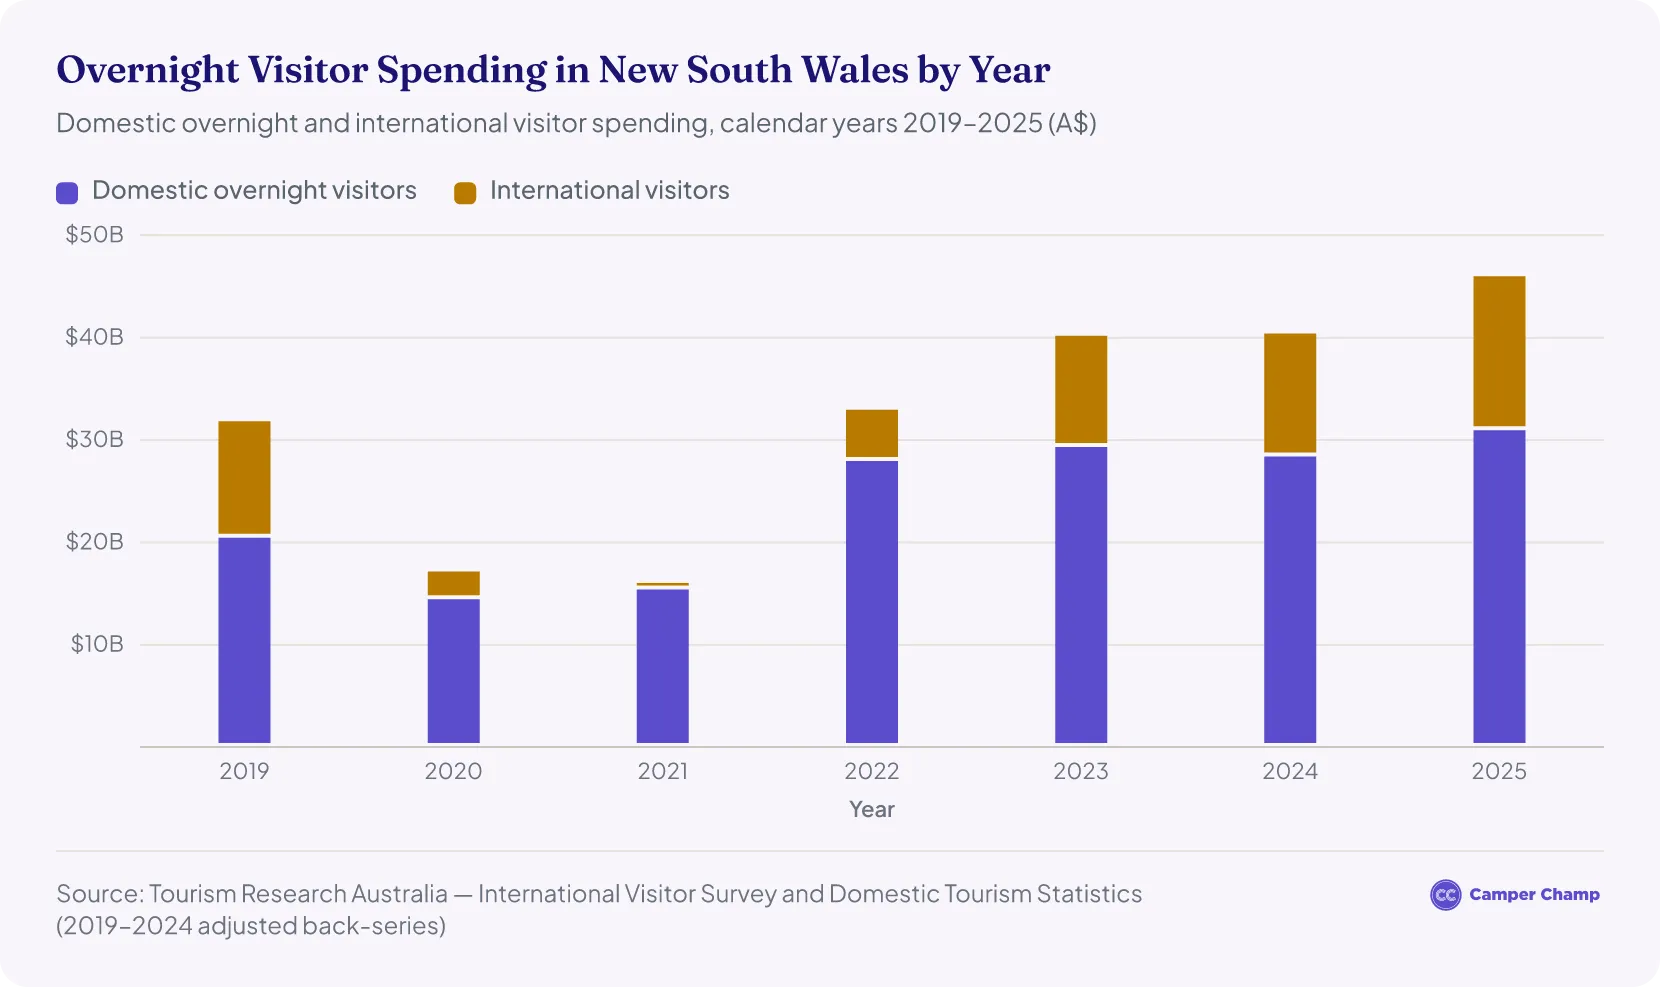
- Overnight visitors spent about A$45.99 billion in 2025: A$30.95 billion by domestic visitors1 and A$15.04 billion by international visitors2. Including day trips, Destination NSW puts visitor spending at A$60.4 billion6.
- Sydney is the most visited region, with about 13.1 million domestic overnight trips7 and 3.82 million international visitors in 20252.
- Tourism contributed A$51.6 billion to the state economy in 2024–258, counting indirect effects, and supported 346,800 jobs.
How many tourists visit NSW each year?
Tourists made about 43.32 million overnight trips to New South Wales in calendar year 2025, not counting about 84.0 million day trips by Australians5.
- Of these, around 39.21 million were domestic overnight trips1, 0.6% more than the 38.98 million in 20249.
- International visitors numbered about 4.11 million in 20252, up 8% from 3.81 million in 2024 and about 6% below the 4.38 million who came in 201910.
- Domestic figures come from Tourism Research Australia's Domestic Tourism Statistics, which replaced the National Visitor Survey in 2025. The 2019–2024 figures are its adjusted back-series, so they differ from numbers published earlier.
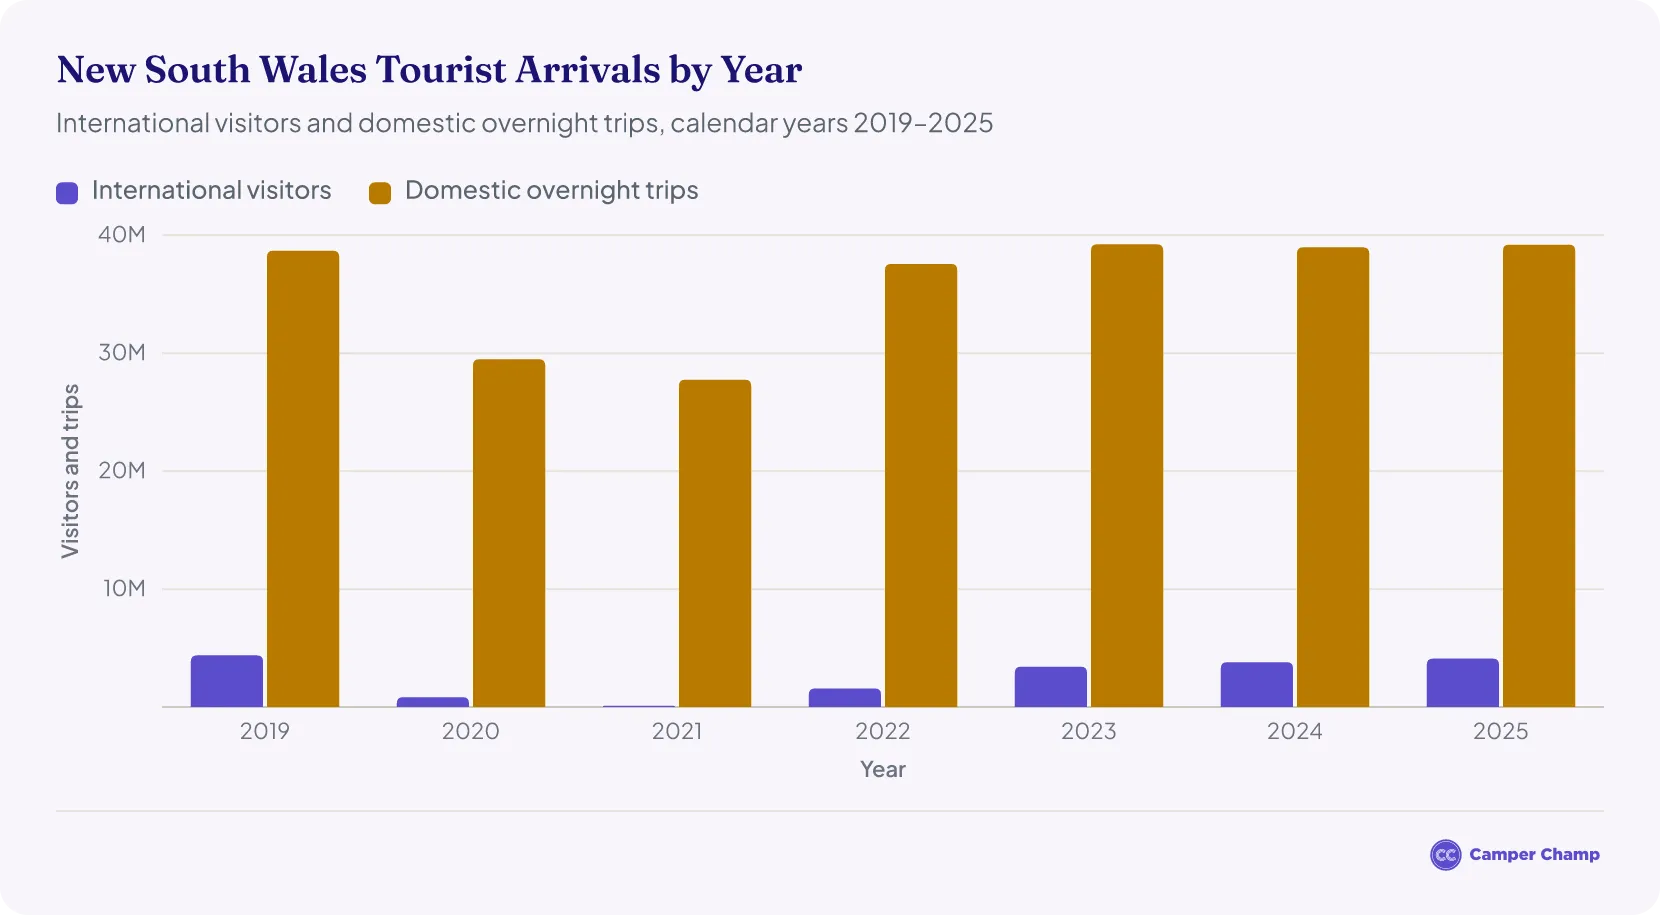
| Year | Period | Total overnight trips | International visitors | Domestic overnight trips | Overnight visitor spending |
|---|---|---|---|---|---|
| 2026 (so far) | January–June 2026 | 21.45 million | 1.98 million114 | 19.47 million3 | A$23.77 billion3114 |
| 2025 | Year ending December 2025 | 43.32 million | 4.11 million2 | 39.21 million1 | A$45.99 billion12 |
| 2024 | Year ending December 2024 | 42.79 million | 3.81 million2 | 38.98 million9 | A$40.42 billion92 |
| 2023 | Year ending December 2023 | 42.66 million | 3.42 million12 | 39.24 million9 | A$40.18 billion912 |
| 2022 | Year ending December 2022 | 39.15 million | 1.58 million13 | 37.57 million9 | A$32.96 billion913 |
| 2021 | Year ending December 2021 | 27.87 million | 112,35714 | 27.76 million9 | A$16.03 billion914 |
| 2020 | Year ending December 2020 | 30.33 million | 838,70514 | 29.49 million9 | A$17.16 billion914 |
| 2019 | Year ending December 2019 | 43.08 million | 4.38 million10 | 38.69 million9 | A$31.83 billion910 |
Source · Data source: Tourism Research Australia (International Visitor Survey and Domestic Tourism Statistics).
How many tourists have visited New South Wales in 2026?
Tourists made about 21.45 million overnight trips to New South Wales between January and June 20263, much the same as in the first half of 2025. They spent about A$23.77 billion, up 3%.
- Australians made 19.47 million overnight trips3, just under the 19.48 million of a year earlier, and spent about A$16.36 billion, up 5%.
- International visitors made about 1.98 million trips11, up 1% on 1.96 million, and spent about A$7.41 billion, up 0.2%4.
- Australians also made about 43.8 million day trips in the state, up 8%3.
- Counting day-trippers as well, visitors spent A$62.9 billion in the year ending June 202615, Destination NSW's latest annual figure.
- The March quarter was busier than the June quarter, with 10.11 million domestic overnight trips against 9.36 million3.
- Figures come from Tourism Research Australia's June quarter 2026 releases, the latest available. The 2026 totals combine the March and June quarters.
How much do tourists spend in NSW?
Overnight visitors, domestic and international, spent A$45.99 billion in New South Wales in the year ending December 2025. Including day trips, Destination NSW puts total visitor spending at A$60.4 billion6, with about 44% of it spent in regional New South Wales16. That rose to A$62.9 billion in the year ending June 202615.
- Domestic overnight visitors contributed about A$30.95 billion1, around 9% more than the A$28.39 billion spent in 20249.
- International visitors spent around A$15.04 billion in 20252, 25% more than the A$12.03 billion spent in 2024 and about 32% higher than the pre-pandemic A$11.38 billion in 201910.
- Total overnight visitor spending was about 44% higher than in 2019, when it totalled about A$31.83 billion9.
- Domestic spending figures also come from Tourism Research Australia's Domestic Tourism Statistics. The 2019–2024 figures are its adjusted back-series, and it advises caution when comparing them with 2025. Destination NSW reports domestic and total spending on the new basis only from 2025.
How important is tourism to the New South Wales economy?
Tourism contributed about A$51.6 billion to the New South Wales economy in the 2024–25 financial year8, counting its direct and indirect effects. Visitors spent about A$65.9 billion on tourism goods and services in the state, up 5.1% on 2023–24.
- Tourism directly contributed about A$25.3 billion, up 5.8%8 on the year before, and indirectly another A$26.3 billion. That direct contribution was the largest of any state or territory, ahead of Victoria's A$19.6 billion.
- The industry supported 346,800 jobs, up 4.1%8. About 203,200 of them were directly in tourism, up 3.9%.
- These are the latest figures from Tourism Research Australia's state tourism satellite accounts. They use a new model, so they can't be compared with earlier published editions.
Is NSW tourism growing?
Yes. Including day trips, visitors spent about A$62.9 billion in NSW in the year ending June 202615, already above the NSW Government's target of A$59 billion for 202617.
- International visitors rose 8% to about 4.11 million in 20252, but were still about 6% below the 2019 level10.
- Domestic overnight trips grew 0.6% to 39.21 million in 20251.
- The NSW Visitor Economy Strategy 2035 aims for A$71 billion in annual visitor spending by 2030 and A$91 billion by 2035, along with 150,000 more jobs, 40,000 new hotel rooms and 8.5 million new airline seats17.
How many day trips are made in New South Wales?
Australians made about 84.0 million domestic day trips in New South Wales in 20255 and spent about A$14.41 billion on them. Together with overnight trips, that makes about 123.2 million domestic trips and about A$45.36 billion in domestic visitor spending.
How does New South Wales compare with other states for tourism?
New South Wales is Australia's biggest state for tourism, with the most domestic overnight trips, the most domestic visitor spending and the most international visitors. Australians made 39.21 million overnight trips to New South Wales in 2025, ahead of Victoria (31.38 million), Queensland (25.94 million) and Western Australia (9.95 million)5.
- Domestic visitors spent about A$45.36 billion in New South Wales in 2025, including day trips, the most of any state5. Its overnight visitors accounted for 29% of all domestic overnight visitor spending in Australia.
- Domestic overnight visitors spent about A$789 per trip5 in New South Wales, below the national average of A$945. Only Victoria was lower, at A$732.
- New South Wales drew the most international visitors, about 4.11 million, ahead of Victoria (2.83 million) and Queensland (2.37 million)2. They spent about A$15.04 billion in the state.
| State | Domestic overnight trips | Day trips | Domestic visitor spending | International visitors | International visitor spending |
|---|---|---|---|---|---|
| New South Wales | 39.21 million5 | 84.03 million5 | A$45.36 billion5 | 4.11 million2 | A$15.04 billion2 |
| Victoria | 31.38 million5 | 84.54 million5 | A$37.04 billion5 | 2.83 million2 | A$9.68 billion2 |
| Queensland | 25.94 million5 | 55.37 million5 | A$36.85 billion5 | 2.37 million2 | A$7.48 billion2 |
| Western Australia | 9.95 million5 | 29.09 million5 | A$15.80 billion5 | 1.07 million2 | A$3.40 billion2 |
| South Australia | 7.81 million5 | 16.39 million5 | A$9.28 billion5 | 445,0002 | A$1.76 billion2 |
| Tasmania | 2.97 million5 | 4.65 million5 | A$3.75 billion5 | 279,0002 | A$712 million2 |
| Australian Capital Territory | 2.25 million5 | 2.09 million5 | A$2.57 billion5 | 199,0002 | A$587 million2 |
| Northern Territory | 995,0005 | 1.22 million5 | A$1.99 billion5 | 255,0002 | A$527 million2 |
Source · Data source: Tourism Research Australia, Domestic Tourism Statistics, year ending December 2025 (as published by Tourism and Events Queensland), and International Visitor Survey, year ending December 2025.
How long do tourists stay in New South Wales?
Domestic overnight visitors spent about 118.2 million nights in New South Wales in 2025, an average of about 3.0 nights per trip5.
- Interstate visitors stayed 3.5 nights on average5, and New South Wales was the only state or territory where their average stay did not fall in 2025. New South Wales residents travelling in their own state stayed 2.8 nights.
- International visitors spent about 105.9 million nights in the state, up 5% on 20242, an average stay of about 26 nights.
- Most of those international nights, about 88.2 million (83%), were spent in Sydney2.
Where do visitors to New South Wales come from?
New South Wales residents travelling in their own state made about 28.47 million of the 39.21 million domestic overnight trips in 2025, down 2.1% on 20245. Interstate visitors made about 10.74 million, up 4.2%.
- New South Wales residents spent about A$18.76 billion on overnight trips in their own state5, and interstate visitors spent about A$12.19 billion.
- About 16.73 million domestic overnight trips were holidays, 15.58 million were visits to friends and relatives and 4.16 million were business trips5.
- Queensland and Victoria each accounted for about 10% of domestic overnight visitors to New South Wales, and the ACT for about 4%18. Most of the rest came from within the state: 39% from Sydney and 34% from regional New South Wales.
- The origin shares are Destination NSW's, based on Tourism Research Australia's Domestic Tourism Statistics, and are rounded.
| Visitors | Overnight trips | Share of overnight trips | Overnight spending | Average stay |
|---|---|---|---|---|
| New South Wales residents (travelling in their own state) | 28.47 million5 | 66% | A$18.76 billion5 | 2.8 nights5 |
| Interstate visitors | 10.74 million5 | 25% | A$12.19 billion5 | 3.5 nights5 |
| International visitors | 4.11 million2 | 9% | A$15.04 billion2 | 26 nights2 |
Source · Data source: Tourism Research Australia, Domestic Tourism Statistics, year ending December 2025 (as published by Tourism and Events Queensland), and International Visitor Survey, year ending December 2025.
Which countries do NSW's international visitors come from?
China is New South Wales' biggest international market: about 547,000 Chinese visitors spent A$5.46 billion in the state in 202519. The United States was second, with about 484,000 visitors spending A$1.09 billion20, followed by New Zealand (442,000)21 and the United Kingdom (379,000), whose visitors spent A$1.01 billion22.
- China was also the biggest single contributor to the growth: Chinese visitor numbers rose 16.6% in 202523.
- South Korea (294,000)24, India (179,000)25, Japan (166,000)26, Hong Kong (111,000)27, Germany (109,000)28 and Singapore (103,000)29 were the next-largest markets by visitor numbers.
- South Korea, Vietnam, the Philippines, the United Kingdom and India all sent more visitors to New South Wales in 2025 than in 201923.
- The market figures are from Destination NSW's market profiles for 2025, based on Tourism Research Australia's International Visitor Survey.
| Rank by visitors | Market | Visitors, 2025 | Visitor spending, 2025 | Rank by spending |
|---|---|---|---|---|
| 1 | China | 547,00019 | A$5.46 billion19 | 1 |
| 2 | United States | 484,00020 | A$1.09 billion20 | 2 |
| 3 | New Zealand | 442,00021 | A$664 million21 | 5 |
| 4 | United Kingdom | 379,00022 | A$1.01 billion22 | 3 |
| 5 | South Korea | 294,00024 | A$791 million24 | 4 |
| 6 | India | 179,00025 | A$593 million25 | 6 |
| 7 | Japan | 166,00026 | A$434 million26 | 7 |
| 8 | Hong Kong | 111,00027 | A$423 million27 | 8 |
| 9 | Germany | 109,00028 | A$225 million28 | 14 |
| 10 | Singapore | 103,00029 | A$224 million29 | 15 |
Source · Data source: Destination NSW, International Market Profile Time Series, year ended December 2025 (based on Tourism Research Australia's International Visitor Survey).
When is the busiest time of year for tourism in NSW?
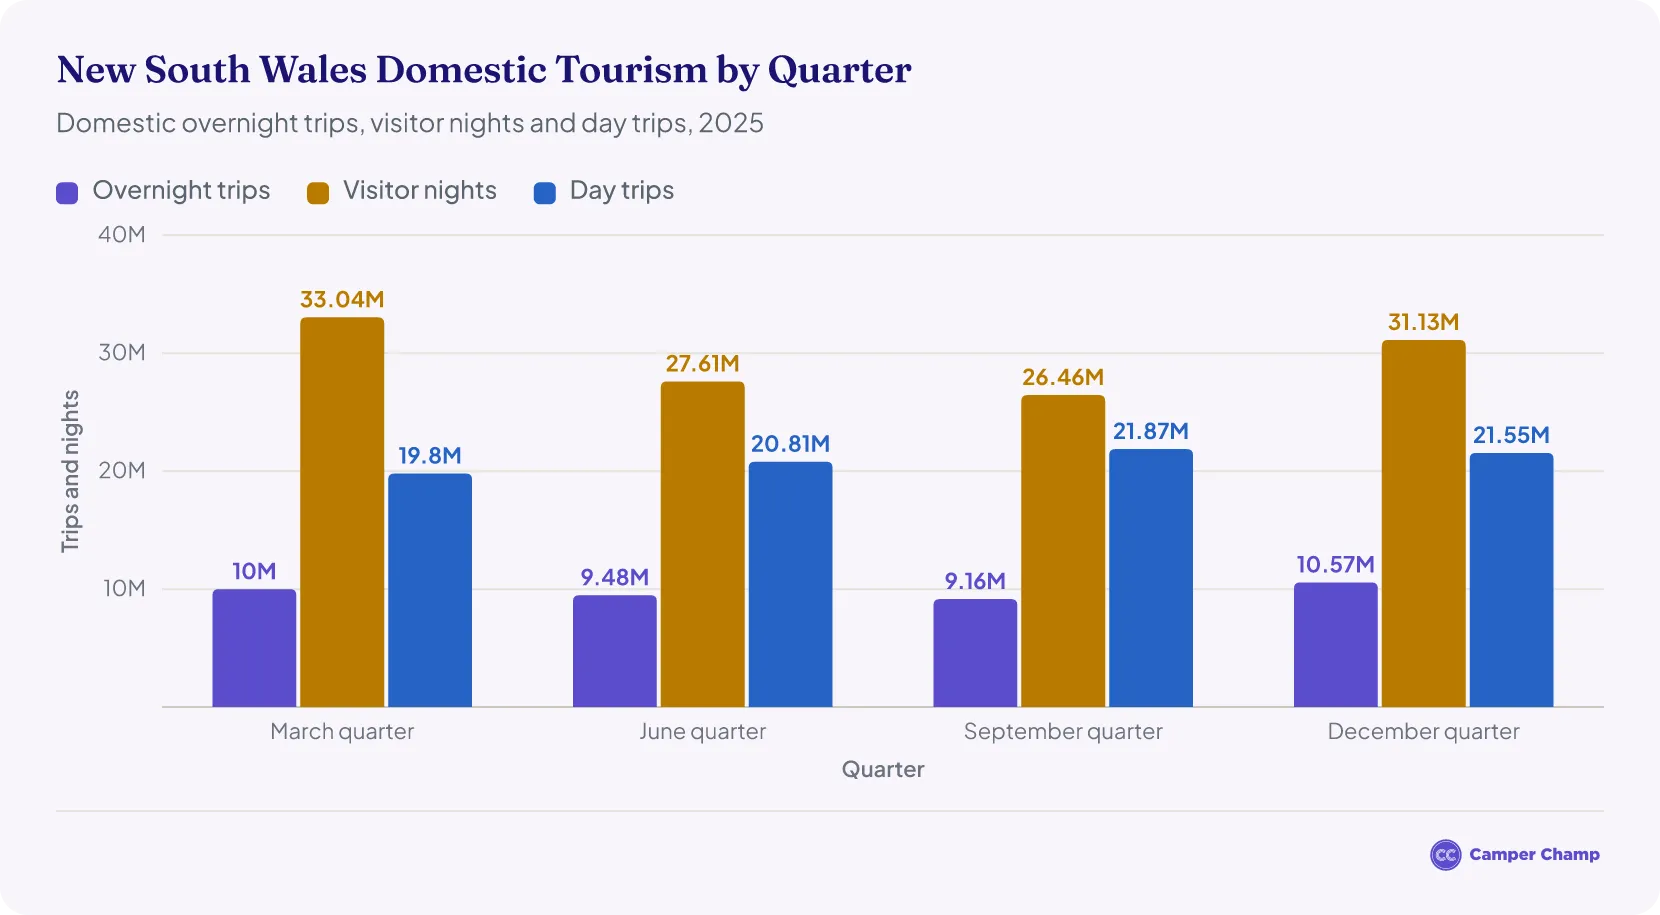
Australians made the most overnight trips to the state in the December quarter of 2025, about 10.57 million1, but spent the most nights there in the March quarter, about 33.04 million. The September quarter was the quietest for overnight trips, with 9.16 million.
- Day trips peaked in the September quarter, at about 21.87 million1.
- Overseas visitors arrive in the largest numbers in December: about 389,290 planned to stay mainly in New South Wales in December 202530, the busiest month of the year. June was the quietest month, with 217,640.
Sydney's summer, from December to February, averages 18.6–25.8°C, with sea temperatures of 21.9–23.7°C31. Winter, from June to August, averages 8.8–17°C. Humpback whales can be seen off Sydney as they migrate north from May to August. In the Snowy Mountains, the snow season typically runs from the King's Birthday weekend in June to the Labour Day weekend in October32.
- Planning a trip? See our 7-day Sydney round-trip campervan itinerary.
What are the most visited regions in NSW?
Sydney is by far the most visited region in New South Wales, with about 13.06 million domestic overnight trips5 and about 3.82 million international visitors in 20252. Of all Australian tourism regions, only Melbourne had more domestic overnight trips5.
- Outside Sydney, the North Coast drew the most domestic overnight visitors, about 6.45 million5, followed by the Hunter (5.19 million) and the South Coast (5.02 million). All three were among Australia's 10 busiest regions for domestic overnight trips.
- Central NSW (2.81 million)33, the Central Coast (2.51 million)34, Capital Country (2.07 million)35 and The Murray (1.79 million)36 were next.
- The North Coast also drew the most international visitors of any regional area, about 291,000 in 20252, and domestic overnight visitors spent about A$4.22 billion there5.
- These regional figures, all for 2025, come from Destination NSW's regional time series and Tourism Research Australia's surveys.
| Rank | Region | Domestic overnight trips | Domestic visitor nights | Domestic overnight spending | International visitors | International visitor spending |
|---|---|---|---|---|---|---|
| 1 | Sydney | 13.06 million37 | 33.75 million37 | A$12.49 billion37 | 3.82 million2 | A$13.73 billion2 |
| 2 | North Coast | 6.45 million5 | Not available | A$4.22 billion5 | 291,0002 | A$327 million2 |
| 3 | Hunter | 5.19 million38 | 13.11 million38 | A$3.80 billion38 | 156,0002 | A$221 million2 |
| 4 | South Coast | 5.02 million39 | 14.68 million39 | A$3.02 billion39 | 144,0002 | A$229 million2 |
| 5 | Central NSW | 2.81 million33 | 7.24 million33 | A$1.51 billion33 | 37,0002 | A$142 million2 |
| 6 | Central Coast | 2.51 million34 | 6.12 million34 | A$1.35 billion34 | 48,00034 | A$58 million34 |
| 7 | Capital Country | 2.07 million35 | 4.44 million35 | A$906 million35 | 22,00035 | Not published |
| 8 | The Murray | 1.79 million36 | 4.00 million36 | A$752 million36 | 28,00036 | Not published |
Source · Data source: Destination NSW, Travel to [region] Tourism Region time series, year ended December 2025; Tourism and Events Queensland, Domestic Tourism Statistics Snapshot, year ending December 2025 (North Coast domestic); Tourism Research Australia, International Visitor Survey, year ending December 2025.
What are the most visited tourist attractions in New South Wales?
Of the attractions that count visitors at the gate, the Royal Botanic Garden Sydney is New South Wales' busiest, with about 5.10 million visits counted at its gates in 2024–2540. The neighbouring Domain, a public park used for sport and events, had an estimated 6.86 million visits, and the four Botanic Gardens of Sydney sites drew more than 13 million visits in total.
- The Art Gallery of New South Wales had 2,369,750 visits to its Sydney campus, up 16.6%41, and Taronga's two zoos welcomed more than 1.7 million guests42, including over 230,000 at Taronga Western Plains Zoo in Dubbo.
- At the Sydney Opera House, 1,438,000 people attended performing arts events43 and 457,525 took a guided tour.
- The Australian Museum welcomed more than 1 million visitors on site44, and the Museum of Contemporary Art Australia had 819,504 in 202545.
- In the Blue Mountains, Scenic World says it has over a million visitors a year46, and Blue Mountains National Park had about 7.83 million visits in 2024–25, the most of any national park in the state47.
- Australians made about 65.6 million visits to New South Wales national parks and other National Parks and Wildlife Service parks in 2024–25, up 24% since 202247, and international visitors made an estimated 4.6 million more.
- Each figure is the attraction's own count for 2024–25 unless stated. Some count visits, others guests, audiences or tour patrons, and the national park figures are survey estimates, so treat the ranking as a guide.
| Rank | Attraction | Location | Visitors, 2024–25 | What is counted |
|---|---|---|---|---|
| 1 | Royal Botanic Garden Sydney | Sydney | 5,100,93540 | Visits, counted at the gates |
| 2 | Art Gallery of New South Wales | Sydney | 2,369,75041 | Visits to the gallery's two buildings, Naala Badu and Naala Nura |
| 3 | Taronga Zoo Sydney and Taronga Western Plains Zoo | Sydney and Dubbo | 1.7 million+42 | Guests at both zoos, including over 230,000 at Taronga Western Plains Zoo |
| 4 | Sydney Opera House | Sydney | 1,438,00043 | Audience attendance at performing arts events (a further 457,525 took tours) |
| 5 | Australian Museum | Sydney | 1 million+44 | Visitors on site |
| 6 | Australian Botanic Garden Mount Annan | Mount Annan | 954,02840 | Visits |
| 7 | Museum of Contemporary Art Australia | Sydney | 819,50445 | Visitors on site (2025) |
| 8 | Blue Mountains Botanic Garden Mount Tomah | Mount Tomah | 184,80140 | Visits |
Source · Data source: 2024–25 annual reports of the Botanic Gardens of Sydney, Art Gallery of New South Wales, Taronga Conservation Society Australia, Sydney Opera House and Australian Museum; Museum of Contemporary Art Australia Annual Report 2025.
How many tourists visit Sydney each year?
Sydney had about 13.06 million domestic overnight trips in 2025: 8.40 million by New South Wales residents and 4.66 million by interstate visitors37. Domestic overnight visitors spent about A$12.49 billion and 33.8 million nights there.
- About 3.82 million international visitors stayed in Sydney in 2025, spending about A$13.73 billion over 88.2 million nights37. Sydney was Australia's most visited capital city for international visitors23.
- China, the United States and New Zealand are Sydney's biggest overseas markets, with about 534,000, 459,000 and 380,000 visitors37.
- Australians also made about 49.5 million day trips to Sydney37. Including day trips, Sydney had about 66.4 million visitors, who spent about A$34.1 billion.
- Read more: Sydney Tourism Statistics
How many tourists visit the Blue Mountains each year?
About 2.59 million people visited the Blue Mountains tourism region in 2025, and they spent about A$1.07 billion48.
- Most came for the day: Australians made about 1.40 million day trips to the region48. Domestic overnight visitors made about 1.12 million trips and spent 2.36 million nights there.
- About 75,000 international visitors stayed in the Blue Mountains in 2025, down 6% on 2024, spending 499,000 nights in the region48.
How much do visitors spend in the Blue Mountains?
- Domestic overnight visitors spent about A$759 million in the Blue Mountains in 202548.
- International visitors spent about A$49 million, up 38% on 202448.
- Domestic figures for 2025 come from Tourism Research Australia's new Domestic Tourism Statistics survey, so they are not comparable with the older visitor numbers for earlier years.
How many tourists visit Byron Bay each year?
Byron Shire, which includes Byron Bay, had about 1.5 million visitors in 2025, who spent about A$686 million49.
- About 685,000 Australians stayed at least one night49, spending about A$461 million and about 2 million nights in the shire.
- Australians also made about 654,000 day trips to Byron Shire49, spending about A$114 million.
- About 169,000 international visitors stayed in Byron Shire in 2025, about 2% fewer than in 202449, and they spent about 1.3 million nights there. That is about 58% of the North Coast region's international overnight visitors.
- These figures are from Byron Shire Council's Tourism Monitor, based on Tourism Research Australia data. Domestic figures for 2025 come from the new Domestic Tourism Statistics survey and are not comparable with earlier years.
- Read more: Byron Bay Tourism Statistics
How many tourists visit the Hunter Valley each year?
Visitor figures are published for the wider Hunter tourism region, which includes the Hunter Valley wine country as well as Newcastle and Port Stephens.
- The Hunter had about 5.19 million domestic overnight trips in 2025: 4.63 million by New South Wales residents and 562,000 by interstate visitors38. Domestic overnight visitors spent about A$3.80 billion and 13.1 million nights there.
- Australians also made about 8.35 million day trips to the region38. Including day trips, the Hunter had about 13.7 million visitors, who spent about A$5.77 billion.
- About 156,000 international visitors stayed in the Hunter in 2025, spending about A$221 million over 3.13 million nights38.
How many people go caravanning and camping in NSW?
About 5.5 million domestic caravan and camping visitors travelled to New South Wales in 202550, more than one in three of Australia's total. They spent 18.2 million nights in the state, an average of about 3.3 nights each.
- Caravan parks in New South Wales earned more than A$1 billion in 2025 for the first time51, up from A$984 million in 202452.
- New South Wales had 223,30352 registered caravans and campervans, the second most of any state after Queensland and 25% of the national total.
- About 86,000 international caravan and camping visitors came to New South Wales in 2025, up 10.4%, and they spent 801,500 nights in the state50.
- Caravan parks are busiest in January, when 74% of powered sites were occupied in 2024, and quietest in May and June52.
- Visitor and night figures for 2025 are Tourism Research Australia data published by the NSW Government. The Caravan Industry Association's 2026 State of Industry report is not public, so registrations and the 2024 park revenue come from its 2025 report. See also our Australia camping statistics.
Where do people camp in NSW?
The North Coast is New South Wales' busiest caravan and camping region and the busiest in Australia, the only region with more than one million caravan and camping trips in 202452. Australians took about 1.31 million caravan and camping trips there in 2024, down 5%, and spent 5.26 million nights.
- The North Coast was also the top destination for domestic caravan and camping visitors to New South Wales in 2025, at 26%, followed by the South Coast at 17%, the Murray and the Hunter at 10% each, and Sydney at 8%50.
- Four of Australia's top 10 caravan and camping regions in 2024 were in New South Wales: the North Coast, the South Coast with 991,550 trips, Central NSW with 516,258 and the Hunter with 506,69652.
- There were 1.8 million overnight stays in the state's national park campgrounds in 2023–2453, across more than 365 campgrounds. In a 2022 survey, 90% of the most frequent national park campers were satisfied or very satisfied.
- About 14% of visitors to New South Wales national parks in 2024–25 stayed at least one night47.
Campervan hire in Australia
FAQs
How does New South Wales compare with other states for tourism?
New South Wales is Australia's biggest state for tourism. Australians made 39.21 million overnight trips there in 2025, more than to any other state5, and it drew the most international visitors, about 4.11 million2. Its domestic overnight visitors spent about A$789 per trip5, below the national average of A$945.
What is the most visited place in New South Wales?
Sydney, with about 13.06 million domestic overnight trips5 and 3.82 million international visitors in 20252. Outside the city, the North Coast is the most visited region, with about 6.45 million domestic overnight trips5. Of the attractions that count visitors at the gate, the Royal Botanic Garden Sydney is the busiest, with about 5.10 million visits in 2024–2540.
What is the busiest month for tourists in New South Wales?
December was the busiest month for overseas visitors in 2025, with about 389,290 arrivals planning to stay mainly in New South Wales30, and February has been the busiest month of 2026 so far, with 367,220. Australians made the most overnight trips in the December quarter of 2025, about 10.57 million1.
More tourism statistics
- Adelaide Tourism Statistics
- Australia Tourism Statistics
- Broome Tourism Statistics
- Cairns Tourism Statistics
- Darwin Tourism Statistics
- Great Barrier Reef Tourism Statistics
- Queensland Tourism Statistics
- South Australia Tourism Statistics
- Sunshine Coast Tourism Statistics
- Sydney Tourism Statistics
- Warner Bros. Movie World Tourism Statistics
- Western Australia Tourism Statistics
References
- Domestic Tourism Statistics results — December quarter 2025 (Tourism Research Australia) · Tourism Research Australia ↑ b c d e f g h i j k l m
- International tourism results — year ending December 2025 (International Visitor Survey) · Tourism Research Australia ↑ b c d e f g h i j k l m n o p q r s t u v w x y z a2 b2 c2 d2 e2 f2 g2 h2 i2 j2 k2 l2 m2 n2 o2 p2 q2 r2 s2 t2 u2 v2 w2 x2 y2 z2 a3 b3 c3
- Domestic Tourism Statistics results — June quarter 2026 compared to June quarter 2025 (Tourism Research Australia) · Tourism Research Australia ↑ b c d e f g h
- International tourism results — year ending June 2026 (International Visitor Survey) · Tourism Research Australia ↑ b c d
- Domestic Tourism Statistics Snapshot, year ending December 2025 (Tourism and Events Queensland) · teq.queensland.com ↑ b c d e f g h i j k l m n o p q r s t u v w x y z a2 b2 c2 d2 e2 f2 g2 h2 i2 j2 k2 l2 m2 n2 o2 p2 q2 r2 s2 t2 u2 v2 w2 x2 y2 z2 a3 b3 c3 d3
- Travel to NSW Key Statistics — year ending December 2025 (Destination NSW; TRA DoTS & IVS) · destinationnsw.com.au ↑ b
- Travel to Sydney — visitor profile, year ending December 2025 (Destination NSW; TRA DoTS & IVS) · destinationnsw.com.au ↑
- State and Regional Tourism Satellite Accounts 2024–25 · Tourism Research Australia ↑ b c d e
- Tourism Research Australia — Domestic Tourism Statistics: 2019–2024 overnight backcast data (revised) · Tourism Research Australia ↑ b c d e f g h i j k l m n o p q r s t
- IVS results for the year ending December 2024 compared to December 2019 · Tourism Research Australia ↑ b c d e f g
- International tourism results — March quarter 2026 (International Visitor Survey) · Tourism Research Australia ↑ b c
- IVS results for the year ending December 2024 compared to December 2023 · Tourism Research Australia ↑ b
- International Visitor Survey tourism results — year ending December 2022 compared with 2021 (Tourism Research Australia) · Tourism Research Australia ↑ b
- International Visitor Survey tourism results — year ending December 2021 compared with 2020 (Tourism Research Australia) · Tourism Research Australia ↑ b c d
- Travel to NSW Key Statistics — year ending June 2026 (Destination NSW; TRA DoTS & IVS) · destinationnsw.com.au ↑ b c d e
- Travel to Regional NSW — visitor profile, year ending December 2025 (Destination NSW; TRA DoTS & IVS) · destinationnsw.com.au ↑
- NSW Visitor Economy Strategy 2035 · destinationnsw.com.au ↑ b
- Domestic Travel to NSW Visitor Profile — year ending December 2025 (Destination NSW; TRA Domestic Tourism Statistics) · cdn.sanity.io ↑
- China Market Profile Time Series, year ended December 2025 (Destination NSW) · cdn.sanity.io ↑ b c d
- USA Market Profile Time Series, year ended December 2025 (Destination NSW) · cdn.sanity.io ↑ b c
- New Zealand Market Profile Time Series, year ended December 2025 (Destination NSW) · cdn.sanity.io ↑ b c
- United Kingdom Market Profile Time Series, year ended December 2025 (Destination NSW) · cdn.sanity.io ↑ b c
- Record-breaking year for international tourism in NSW (Destination NSW) · destinationnsw.com.au ↑ b c
- Korea Market Profile Time Series, year ended December 2025 (Destination NSW) · cdn.sanity.io ↑ b c
- India Market Profile Time Series, year ended December 2025 (Destination NSW) · cdn.sanity.io ↑ b c
- Japan Market Profile Time Series, year ended December 2025 (Destination NSW) · cdn.sanity.io ↑ b c
- Hong Kong Market Profile Time Series, year ended December 2025 (Destination NSW) · cdn.sanity.io ↑ b c
- Germany Market Profile Time Series, year ended December 2025 (Destination NSW) · cdn.sanity.io ↑ b c
- Singapore Market Profile Time Series, year ended December 2025 (Destination NSW) · cdn.sanity.io ↑ b c
- Overseas Arrivals and Departures, Australia, August 2026 — Table 11: Short-term visitors arriving, state of intended stay (ABS) · Australian Bureau of Statistics ↑ b
- Weather in Sydney — Tourism Australia (australia.com) · australia.com ↑
- Snowy Mountains FAQ — Destination Snowy Mountains (snowymountains.com.au) · snowymountains.com.au ↑
- Travel to Central NSW Tourism Region — time series, year ended December 2025 (Destination NSW; TRA Domestic Tourism Statistics and International Visitor Survey) · cdn.sanity.io ↑ b c d
- Travel to Central Coast Tourism Region — time series, year ended December 2025 (Destination NSW; TRA Domestic Tourism Statistics and International Visitor Survey) · cdn.sanity.io ↑ b c d e f
- Travel to Capital Country Tourism Region — time series, year ended December 2025 (Destination NSW; TRA Domestic Tourism Statistics and International Visitor Survey) · cdn.sanity.io ↑ b c d e
- Travel to The Murray Tourism Region — time series, year ended December 2025 (Destination NSW; TRA Domestic Tourism Statistics and International Visitor Survey) · cdn.sanity.io ↑ b c d e
- Travel to Sydney Tourism Region — time series, year ended December 2025 (Destination NSW; TRA Domestic Tourism Statistics and International Visitor Survey) · cdn.sanity.io ↑ b c d e f g
- Travel to Hunter Tourism Region — time series, year ended December 2025 (Destination NSW; TRA Domestic Tourism Statistics and International Visitor Survey) · cdn.sanity.io ↑ b c d e f
- Travel to South Coast Tourism Region — time series, year ended December 2025 (Destination NSW; TRA Domestic Tourism Statistics and International Visitor Survey) · cdn.sanity.io ↑ b c
- Botanic Gardens of Sydney Annual Report 2024–25 · botanicgardens.org.au ↑ b c d e
- Art Gallery of New South Wales Annual Report 2024–25 · datocms-assets.com ↑ b
- Taronga Conservation Society Australia Annual Impact Report 2024–2025 · taronga.org.au ↑ b
- Sydney Opera House Annual Report 2024–25 · sydneyoperahouse.com ↑ b
- Australian Museum Annual Report 2024–25 · media.australian.museum ↑ b
- Museum of Contemporary Art Australia Annual Report 2025 · mca.com.au ↑ b
- Who we are – Scenic World · scenicworld.com.au ↑
- NSW Parks Visitation Survey: FY24-25 Annual Report · environment.nsw.gov.au ↑ b c
- Travel to Blue Mountains Tourism Region — time series, year ended December 2025 (Destination NSW; TRA Domestic Tourism Statistics and International Visitor Survey) · cdn.sanity.io ↑ b c d e
- Byron Shire Tourism Monitor (quarterly, Tourism Research Australia data prepared for Byron Shire Council) · destinationbyron.com.au ↑ b c d
- NSW Government media release: NSW number one for caravan and camping trips · nsw.gov.au ↑ b c
- State of the Industry 2026: Resilience in a changing market (Caravan Industry Association of Australia) · caravanindustry.com.au ↑
- Caravan and Camping State of Industry 2025 (Caravan Industry Association of Australia) · assets.pc.gov.au ↑ b c d e
- Improving camping in New South Wales national parks: consultation paper (NSW National Parks and Wildlife Service, 2025) · environment.nsw.gov.au ↑
- Tourism Research Australia — Local Government Area Profiles, Whitsunday, 2019 · Tourism Research Australia
- TRA — International tourism results, Australia, March 2024 · Tourism Research Australia