

Updated
At a Glance
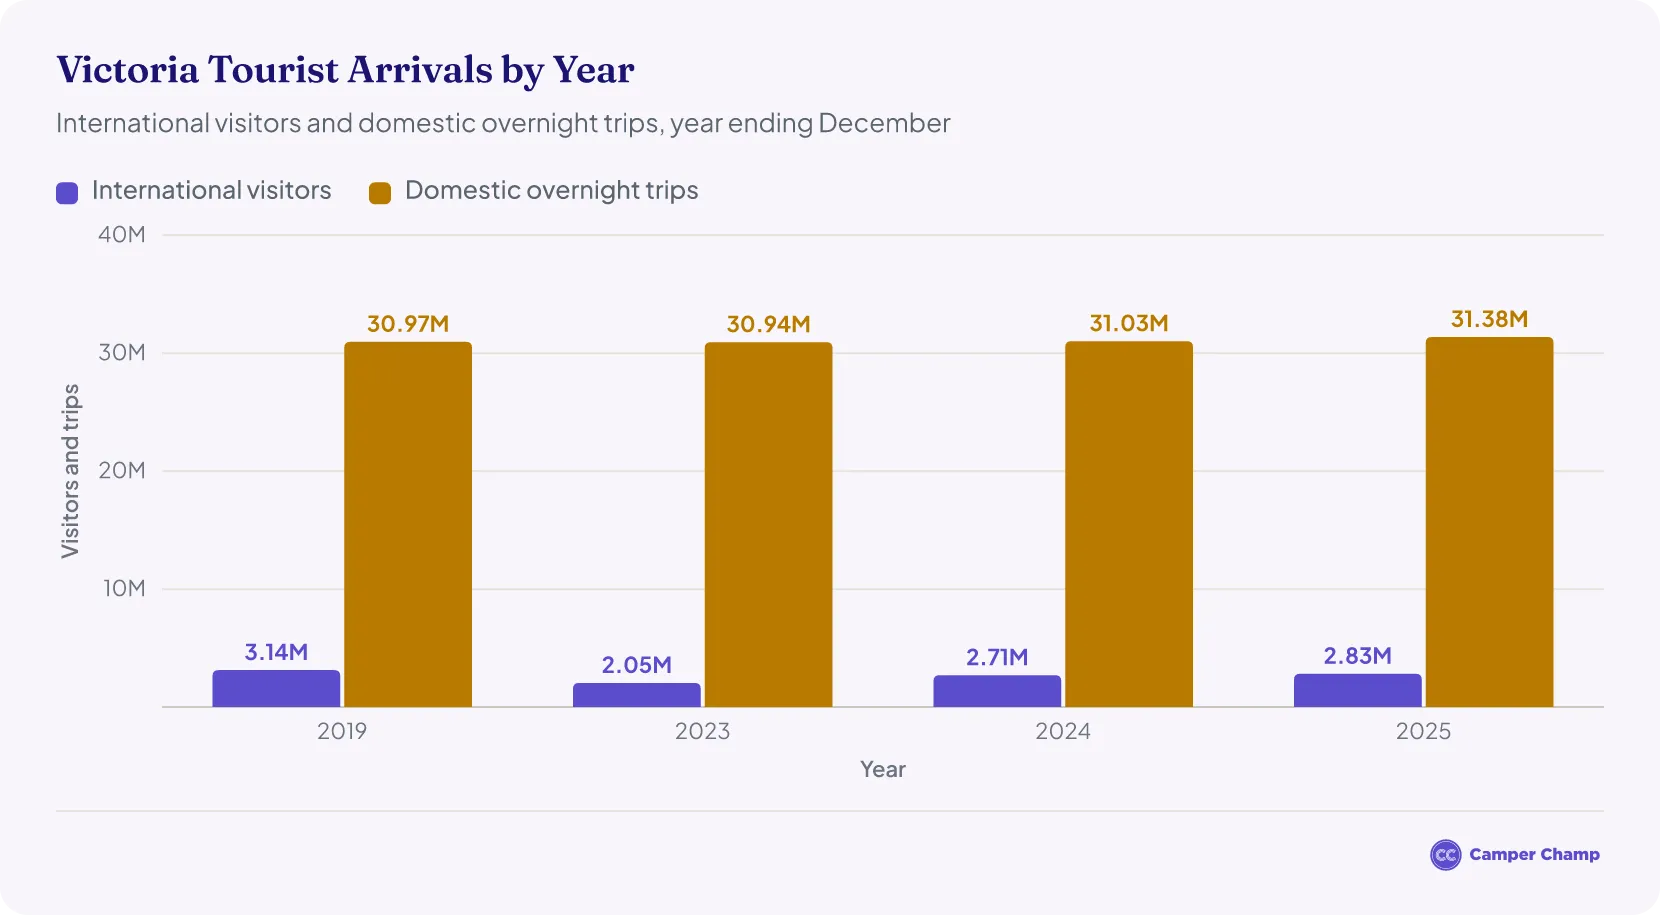
- Tourists made 34.2 million overnight trips to Victoria in 2025: 31.38 million domestic overnight trips1 and 2.83 million international trips2.
- So far in 2026 (January–June), tourists made about 17.2 million overnight trips to the state3 and spent about A$18.2 billion.
- Australians also made about 84.5 million day trips in Victoria in 20251, and Victoria drew more day trips than any other state in the year ending June 20263.
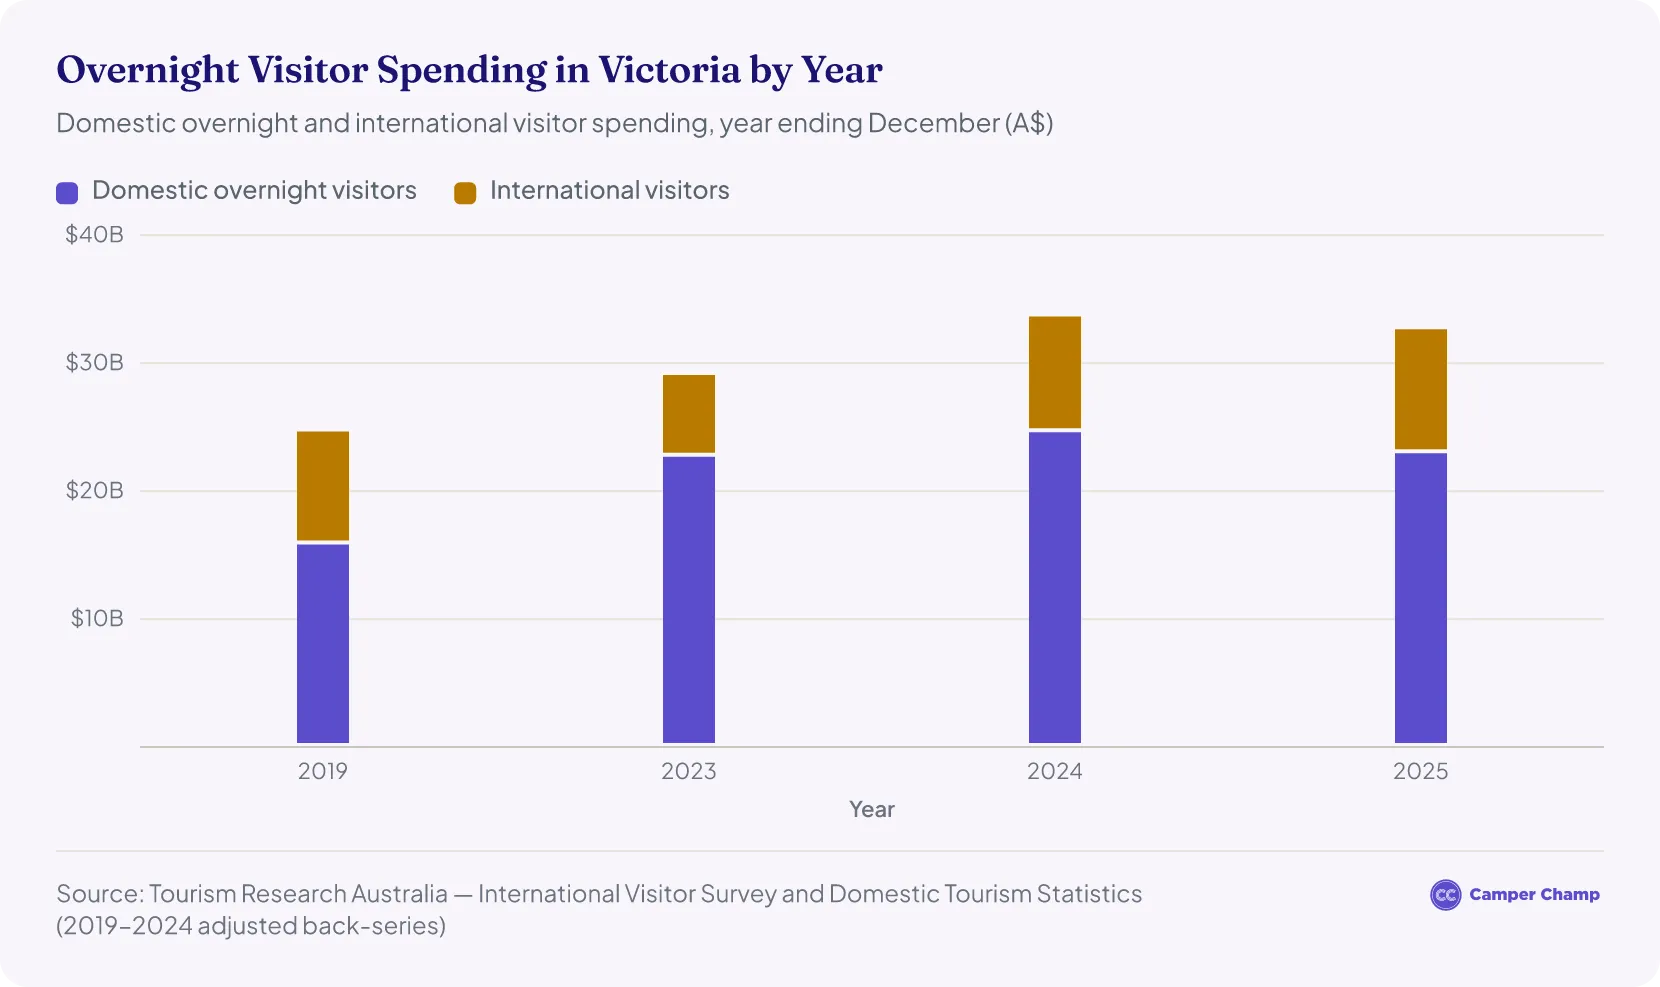
- Overnight visitors spent about A$32.65 billion in 2025: A$22.97 billion by domestic visitors1 and A$9.68 billion by international visitors2.
- Melbourne is the most visited region, with about 13.4 million domestic overnight trips in the year ending June 20264.
- Tourism contributed A$40.0 billion to the state economy in 2024–25, counting indirect effects, and supported 322,100 jobs5.
How many tourists visit Victoria each year?
Tourists made about 34.2 million overnight trips to Victoria in 2025 (year ending December), not counting about 84.5 million day trips by Australians1.21
- Of these, around 31.38 million were domestic overnight trips, about 1% more than the 31.03 million in 2024.6
- There were also about 2.83 million international visitors, up 4% from 2.71 million in 2024,2 but still about 10% below the 2019 level of 3.14 million.7
- Domestic figures come from Tourism Research Australia's Domestic Tourism Statistics, which replaced the National Visitor Survey in 2025. The 2019–2024 figures are its adjusted back-series, so they differ from numbers published earlier.
| Year | Period | Total overnight trips | International visitors | Domestic overnight trips | Visitor spending |
|---|---|---|---|---|---|
| 2026 (so far) | January–June 2026 | 17.18 million | 1.42 million8 | 15.76 million3 | A$18.23 billion3 |
| 2025 | Year ending December 2025 | 34.21 million | 2.83 million2 | 31.38 million1 | A$32.65 billion12 |
| 2024 | Year ending December 2024 | 33.73 million | 2.71 million9 | 31.03 million6 | A$33.64 billion69 |
| 2023 | Year ending December 2023 | 32.99 million | 2.05 million9 | 30.94 million6 | A$29.09 billion69 |
| 2022 | Year ending December 2022 | 31.38 million | 1.05 million10 | 30.34 million6 | A$25.15 billion610 |
| 2021 | Year ending December 2021 | 23.04 million | 61,57011 | 22.98 million6 | A$11.73 billion611 |
| 2020 | Year ending December 2020 | 19.80 million | 615,28011 | 19.19 million6 | A$10.39 billion611 |
| 2019 | Year ending December 2019 | 34.11 million | 3.14 million7 | 30.97 million6 | A$24.65 billion67 |
Source · Data source: Tourism Research Australia (International Visitor Survey and Domestic Tourism Statistics).
How many tourists have visited Victoria in 2026?
Tourists made about 17.2 million overnight trips to Victoria between January and June 20263, down 2% on the same months of 202512. They spent about A$18.2 billion, up 8%3.
- Australians made 15.76 million overnight trips12, down 2% on 16.15 million a year earlier3, and spent about A$12.68 billion, up 4%.
- International visitors made about 1.42 million trips8, up 1% on 1.41 million13, and spent about A$5.55 billion, up 17%.
- Australians also made about 44.2 million day trips in the state, up 7%3.
- Including day trips, Visit Victoria puts visitor spending at a record A$49.5 billion in the year ending June 2026, up 6.6%14.
- The March quarter was busier than the June quarter, with 8.46 million domestic overnight trips against 7.30 million3.
- Figures come from Tourism Research Australia's June quarter 2026 releases, the latest available. The 2026 totals combine the March and June quarters.
How much do tourists spend in Victoria?
Domestic overnight and international visitors spent A$32.65 billion in Victoria in the year ending December 2025.21 Including day trips, the Victorian Government puts total visitor spending at a record A$46.7 billion.16 That rose to A$49.5 billion in the year ending June 202614, the latest figure.
- Domestic overnight visitors contributed about A$22.97 billion,1 around 7% less than the A$24.60 billion spent in 2024.6
- International visitors spent around A$9.68 billion, a 7% increase from the A$9.05 billion spent in 2024.2
- Overall, overnight visitor spending in Victoria was about 32% higher than in 2019, when it totalled about A$24.65 billion.67
- Domestic spending follows Tourism Research Australia's Domestic Tourism Statistics. The 2019–2024 figures are its adjusted back-series, and TRA advises caution when comparing them with 2025.
How important is tourism to Victoria's economy?
Tourism contributed about A$40.0 billion to the Victorian economy in 2024–255, counting its direct and indirect effects, or 6.3% of gross state product. That was up 4.7% on 2023–24.
- Tourism directly contributed about A$19.6 billion, up A$1.2 billion on the year before17.
- The industry supported 322,100 filled jobs, or 7.8% of all filled jobs in the state5. About 189,600 of them were directly in tourism.
- These are the latest figures from Tourism Research Australia's state tourism satellite accounts, published by the Victorian Government. They use a new model, so they can't be compared with earlier published editions.
How many day trips are made in Victoria?
Australians made about 84.5 million domestic day trips in Victoria in 2025 and spent about A$14.07 billion on them1. Together with overnight trips, that makes about 115.9 million domestic trips and about A$37.04 billion in domestic visitor spending.
- Victoria drew more day trips than any other state in the year ending June 2026, about 87.4 million, just ahead of New South Wales with 87.2 million3.
- 2025 is the first full year of Tourism Research Australia's new Domestic Tourism Statistics, so there is no like-for-like 2024 figure for day trips.
How does Victoria compare with other states for tourism?
Victoria is Australia's second-biggest state for domestic overnight trips and the biggest for day trips. Australians made 31.38 million overnight trips to Victoria in 2025, behind New South Wales (39.21 million) and ahead of Queensland (25.94 million). They also made 84.54 million day trips, just ahead of New South Wales (84.03 million)18.
- Domestic visitors spent about A$37.04 billion in Victoria in 2025, including day trips, second to New South Wales (A$45.36 billion) and just ahead of Queensland (A$36.85 billion)18.
- Victoria was third for domestic overnight spending, at A$22.97 billion, behind New South Wales (A$30.95 billion) and Queensland (A$27.68 billion)18. Its overnight visitors spent about A$732 per trip, against a national average of A$945.
- Victoria drew the second-most international visitors, about 2.83 million, behind New South Wales (4.11 million) and ahead of Queensland (2.37 million). They spent about A$9.68 billion in the state, against A$15.04 billion in New South Wales2.
| State | Domestic overnight trips | Day trips | Domestic visitor spending | International visitors | International visitor spending |
|---|---|---|---|---|---|
| New South Wales | 39.21 million | 84.03 million | A$45.36 billion | 4.11 million | A$15.04 billion |
| Victoria | 31.38 million | 84.54 million | A$37.04 billion | 2.83 million | A$9.68 billion |
| Queensland | 25.94 million | 55.37 million | A$36.85 billion | 2.37 million | A$7.48 billion |
| Western Australia | 9.95 million | 29.09 million | A$15.80 billion | 1.07 million | A$3.40 billion |
| South Australia | 7.81 million | 16.39 million | A$9.28 billion | 445,000 | A$1.76 billion |
| Tasmania | 2.97 million | 4.65 million | A$3.75 billion | 279,000 | A$712 million |
| Australian Capital Territory | 2.25 million | 2.09 million | A$2.57 billion | 199,000 | A$587 million |
| Northern Territory | 995,000 | 1.22 million | A$1.99 billion | 255,000 | A$527 million |
Source · Data source: Tourism Research Australia, Domestic Tourism Statistics, year ending December 2025 (as published by Tourism and Events Queensland), and International Visitor Survey, year ending December 2025.
How long do tourists stay in Victoria?
- Domestic overnight visitors spent about 87.2 million nights in Victoria in 2025, an average of about 2.8 nights per trip1.
- International visitors spent 78.8 million nights in the state, down 1.8% on 2024, an average stay of about 28 nights2.
- Most of those international nights, about 67.9 million, were spent in Melbourne2.
Where do Victoria's visitors come from?
Interstate visitors made about 6.38 million overnight trips to Victoria in 202518. Victorians travelling within their own state made the other 25.0 million domestic overnight trips.
- Interstate visitors spent about A$9.86 billion and stayed 3.8 nights on average18. Victorians spent about A$13.11 billion on trips in their own state and stayed 2.5 nights.
- About 14.4 million domestic overnight trips were holidays, 12.6 million were visits to friends and relatives and 2.8 million were business trips18.
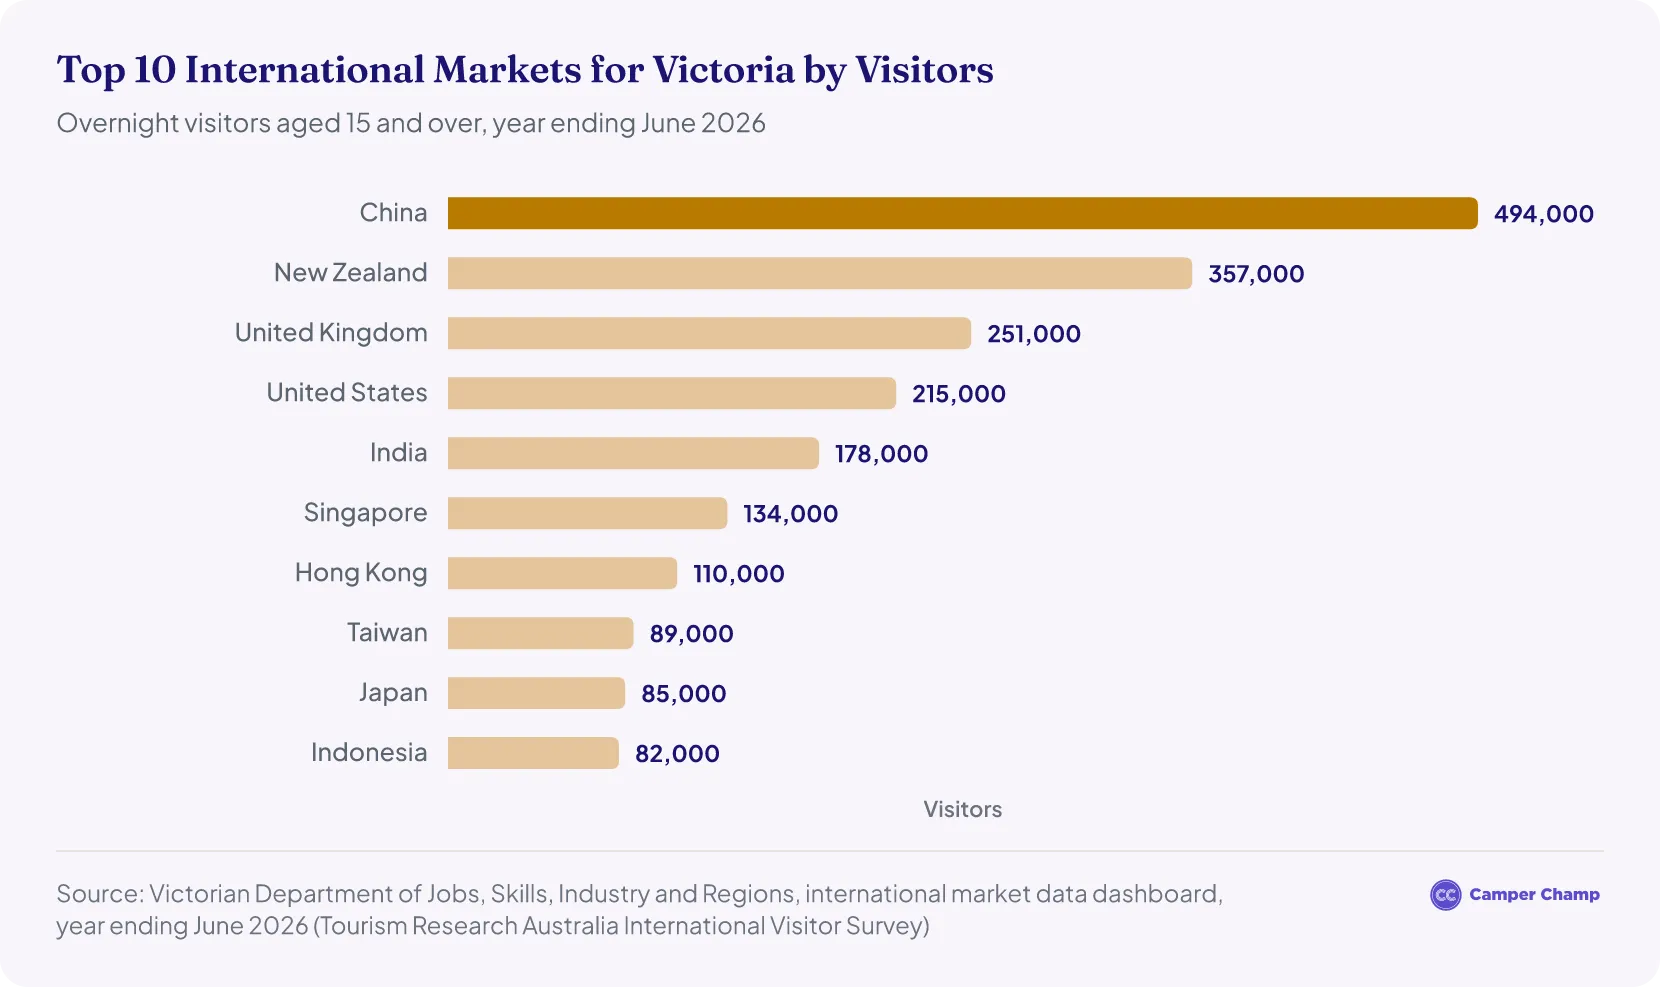
China is Victoria's biggest international market for both visitors and spending: about 494,000 Chinese visitors spent about A$3.59 billion in the state in the year ending June 202619, about a third of all international visitor spending. New Zealand sent the second-most visitors (357,000), followed by the United Kingdom (251,000), the United States (215,000) and India (178,000).
- India was the second-biggest market by spending, at about A$653 million, ahead of the UK (A$609 million) and New Zealand (A$467 million)19.
- Seven of the top 10 markets by visitor numbers are in Asia.
- Across all of 2025, about 2.65 million international visitors stayed in Melbourne and 422,000 in regional Victoria2; many visited both.
- The market figures count visitors aged 15 and over who stayed at least one night in Victoria, from Tourism Research Australia's International Visitor Survey as published by the Victorian Government.
When is the busiest time to visit Victoria?
Summer is Victoria's busiest time for overnight stays. Australians made about 8.65 million overnight trips to the state in the March quarter of 2025 and spent 26.3 million nights there1, more than in any other quarter. The December quarter was next, with 8.04 million trips, while the September quarter, in winter, was the quietest, with 7.19 million.
- Day trips peaked later in the year, in the September quarter, at about 21.6 million1.
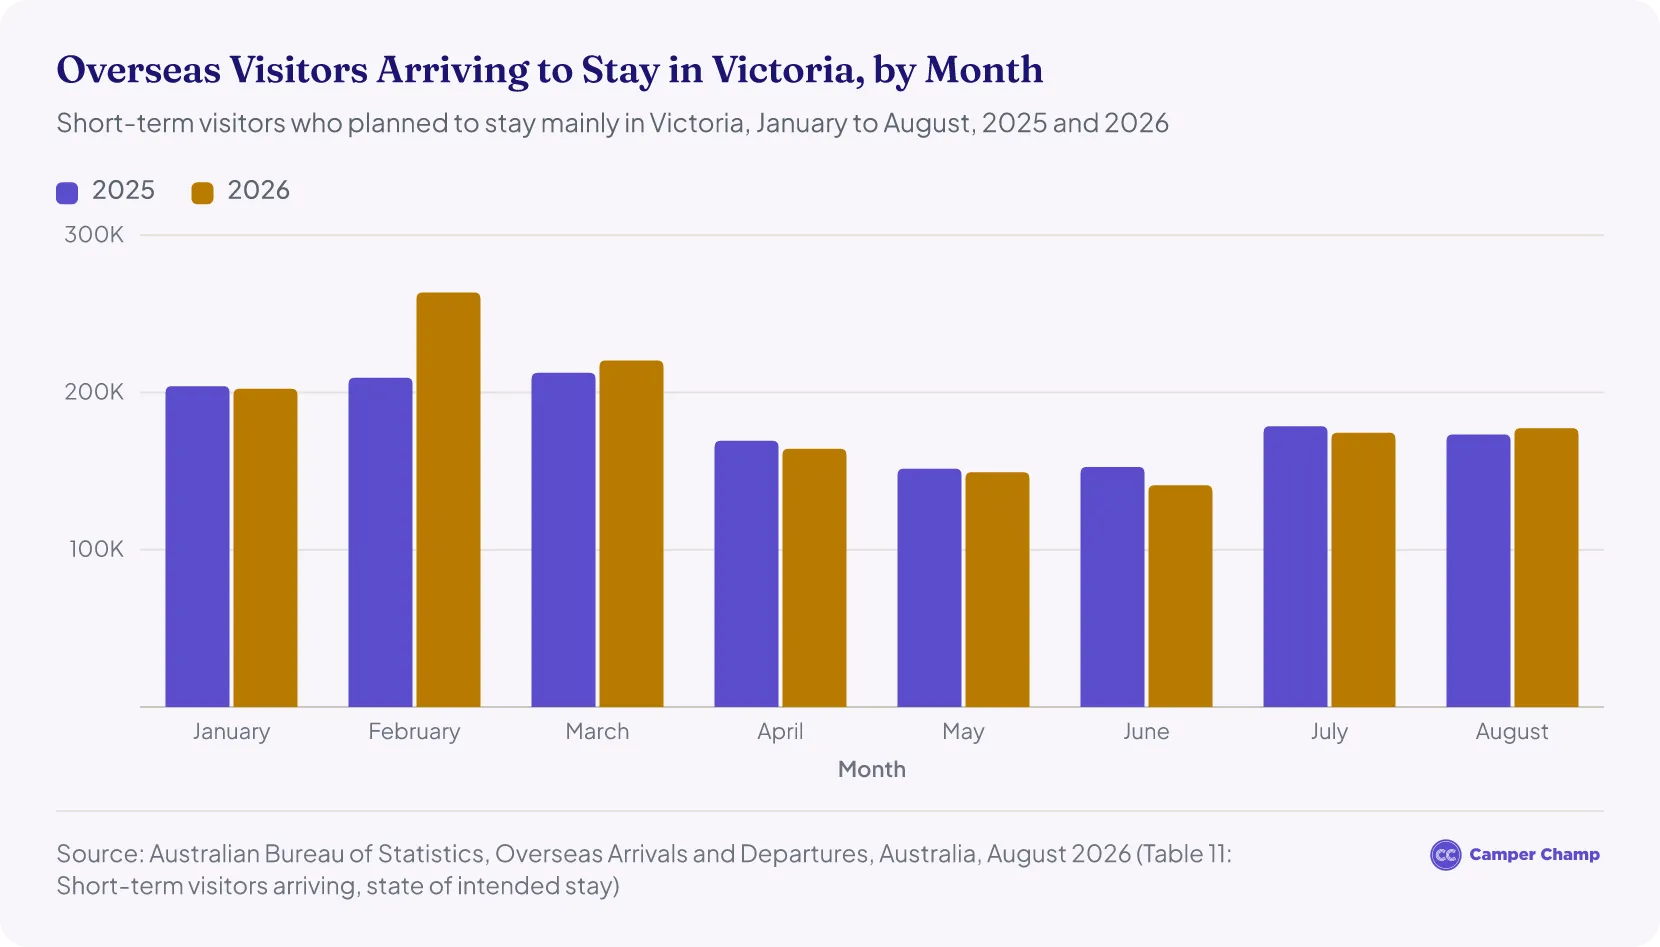
- Overseas visitors arrive in the largest numbers in December: about 281,540 planned to stay mainly in Victoria in December 202515, the busiest month of the year.
- Planning a trip? See our 7-day Great Ocean Road campervan itinerary.
| Quarter (2025) | Overnight trips | Visitor nights | Day trips |
|---|---|---|---|
| March quarter | 8.65 million | 26.34 million | 20.53 million |
| June quarter | 7.50 million | 20.49 million | 20.79 million |
| September quarter | 7.19 million | 18.96 million | 21.65 million |
| December quarter | 8.04 million | 21.45 million | 21.57 million |
Source · Data source: Tourism Research Australia, Domestic Tourism Statistics (December quarter 2025 release).
What are the most visited places and attractions in Victoria?
Melbourne is by far the most visited region in Victoria, with about 13.4 million domestic overnight trips4 and 2.67 million international visitors in the year ending June 202613. In 2025 it drew more domestic overnight visitors than any other region in Australia, ahead of Sydney18.
- Outside Melbourne, the Mornington Peninsula drew the most domestic overnight visitors, about 2.83 million, followed by Gippsland (2.55 million), Geelong and the Bellarine (2.21 million) and the Great Ocean Road (2.12 million)4.
- The Great Ocean Road drew the most international visitors of any regional area (102,000), and visitors there spent about A$1.80 billion4.
- These regional figures come from the Victorian Government's visitor economy dashboard for the year ending June 2026, based on Tourism Research Australia's surveys. They use the new survey method, so they can't be compared with years before 2025.
| Rank | Region | Domestic overnight trips | International visitors | Day trips | Visitor spending |
|---|---|---|---|---|---|
| 1 | Melbourne | 13.45 million | 2.67 million | 56.70 million | A$32.71 billion |
| 2 | Mornington Peninsula | 2.83 million | 49,000 | 5.43 million | A$2.38 billion |
| 3 | Gippsland | 2.55 million | 46,000 | 3.22 million | A$1.38 billion |
| 4 | Geelong and the Bellarine | 2.21 million | 50,000 | 3.99 million | A$1.91 billion |
| 5 | Great Ocean Road | 2.12 million | 102,000 | 1.89 million | A$1.80 billion |
| 6 | Victoria's High Country | 1.87 million | 22,000 | 1.55 million | A$1.44 billion |
| 7 | Murray | 1.80 million | 34,000 | 1.72 million | A$1.52 billion |
| 8 | Yarra Valley and Dandenong Ranges | 1.24 million | 48,000 | 4.08 million | A$1.26 billion |
| 9 | Greater Ballarat | 1.22 million | 27,000 | 2.01 million | A$899 million |
| 10 | Goulburn | 1.12 million | 22,000 | 1.93 million | A$1.09 billion |
| 11 | Grampians | 1.10 million | 15,000 | 1.17 million | A$725 million |
| 12 | Daylesford and the Macedon Ranges | 1.09 million | 21,000 | 1.72 million | A$782 million |
| 13 | Phillip Island | 1.05 million | 33,000 | 715,000 | A$704 million |
| 14 | Greater Bendigo | 960,000 | 12,000 | 1.24 million | Not published |
Source · Data source: Victorian Department of Jobs, Skills, Industry and Regions, Victoria's Visitor Economy dashboard, year ending June 2026 (Tourism Research Australia Domestic Tourism Statistics and International Visitor Survey).
What are the most visited tourist attractions in Victoria?
The National Gallery of Victoria is Victoria's most visited attraction, with about 3.18 million visits across its two Melbourne galleries in 2024–2520. Zoos Victoria's four zoos drew about 2.67 million visitors21, and Arts Centre Melbourne recorded about 2.20 million attendances22.
- In and around Melbourne, the Royal Botanic Gardens (Melbourne and Cranbourne) drew about 2.0 million visitors23, Melbourne Museum about 1.14 million24 and ACMI about 907,50025.
- Along the coast, the Twelve Apostles draw more than 2 million visitors a year26, and Phillip Island Nature Parks, home of the Penguin Parade, drew more than 1 million in 2024–2527.
- Inland, Sovereign Hill in Ballarat had 480,709 visitors28, and Puffing Billy Railway carried 466,180 passengers, 44% of them from overseas29.
- The MCG is left out of the ranking because its crowds come for events: more than 4 million fans attended 69 major events there in 202430.
- Each figure is the attraction's own count for 2024–25, the latest published. Some count visits, others attendances or ticketed admissions, so treat the ranking as a guide.
| Rank | Attraction | Location | Visitors, 2024–25 | What is counted |
|---|---|---|---|---|
| 1 | National Gallery of Victoria | Melbourne | 3,181,38420 | Attendance at NGV International and The Ian Potter Centre |
| 2 | Zoos Victoria | Melbourne, Healesville, Werribee and Kyabram | 2,670,27621 | Visitors to all four zoos |
| 3 | Arts Centre Melbourne | Melbourne | 2,197,63922 | Attendances, including food and drink visitors and the Sunday Market |
| 4 | Twelve Apostles | Great Ocean Road | More than 2 million26 | Visitors a year (Victorian Government) |
| 5 | Royal Botanic Gardens Victoria | Melbourne and Cranbourne | 2.0 million23 | Visitors to both gardens |
| 6 | Melbourne Museum | Melbourne | 1,139,05324 | Ticketed admissions, including the Royal Exhibition Building Dome Promenade |
| 7 | Phillip Island Nature Parks | Phillip Island | More than 1 million27 | Visitors, including the Penguin Parade |
| 8 | ACMI | Melbourne | 907,50925 | Visits to its Federation Square museum |
| 9 | Sovereign Hill | Ballarat | 480,70928 | Visitors |
| 10 | Puffing Billy Railway | Dandenong Ranges | 466,18029 | Passengers |
| 11 | Scienceworks | Melbourne | 411,53024 | Ticketed admissions |
Source · Data source: 2024–25 annual reports of the National Gallery of Victoria, Zoos Victoria, Arts Centre Melbourne, Royal Botanic Gardens Victoria, Museums Victoria, ACMI, Sovereign Hill, Phillip Island Nature Parks and Puffing Billy Railway; Victorian Government (Twelve Apostles).
How many tourists visit Melbourne each year?
- Melbourne had about 72.8 million visits in the year ending June 2026: 56.7 million day trips, 13.4 million domestic overnight trips4 and 2.67 million international visitors.
- Visitors spent about A$32.7 billion in Melbourne, including A$10.2 billion on day trips4. International visitors spent about A$9.70 billion and stayed 70.1 million nights13.
- Melbourne is Australia's leading destination for interstate overnight leisure travellers, with 3.5 million trips a year14.
- Read more: Melbourne Tourism Statistics
How many tourists visit the Great Ocean Road each year?
The Great Ocean Road had about 4.1 million visits in the year ending June 2026: 2.12 million domestic overnight trips, 1.89 million day trips and 102,000 international visitors4. Visitors spent about A$1.80 billion in the region and about 6.4 million nights there.
- The Twelve Apostles draw more than 2 million visitors a year26, according to the Victorian Government.
- Read more: Great Ocean Road Tourism Statistics
How many tourists visit the Mornington Peninsula each year?
- The Mornington Peninsula had about 8.3 million visits in the year ending June 2026, including 5.43 million day trips and 2.83 million domestic overnight trips4. Only about 49,000 were international visitors.
- Visitors spent about A$2.38 billion on the peninsula and about 7.7 million nights there4.
- Nearby Phillip Island had about 1.05 million domestic overnight trips and 715,000 day trips, and visitors spent about A$704 million4.
How many people camp in Victoria?
Australians took a record 3.9 million caravan and camping trips in Victoria in 2024, up 2%, and spent about 11.3 million nights there, down 11%31. Their spending fell 11% to about A$2.0 billion, or about A$530 per trip.
- Interstate caravan and camping trips fell 14%, while Victorians' own trips rose 5%, so travellers from within the state made 87% of all caravan and camping trips31.
- Caravan parks in Victoria earned about A$470 million, 15% of the national total31. The peak season runs from January to March, when powered sites reached 71% occupancy.
- Victoria had 211,788 registered caravans and campervans, the third most of any state31, behind Queensland and New South Wales.
- Caravan and camping figures are for 2024, the latest year in the Caravan Industry Association's public State of Industry report. See also our Australia camping statistics.
Where do people camp in Victoria?
The High Country and the Great Ocean Road are Victoria's busiest caravan and camping regions. Australians took about 708,000 caravan and camping trips to the High Country in 2024 and spent 1.96 million nights there, the fifth most of any region in Australia31. The Great Ocean Road was seventh, with about 552,000 trips, up 14%, and 1.82 million nights.
- They are the only Victorian regions in Australia's top 10 for caravan and camping, and between them they accounted for about a third of the state's 3.9 million caravan and camping trips31.
- High Country trips fell 9% and nights 18% on 2023, while Great Ocean Road nights rose 13%31.
- Parks Victoria manages about 1,400 camping areas32 across the state's parks and reserves.
- These are the latest regional figures, for 2024, from the Caravan Industry Association's State of Industry report, based on Tourism Research Australia data. Victoria doesn't publish caravan and camping figures for its other regions.
More tourism statistics
- Bondi Beach Tourism Statistics
- Broome Tourism Statistics
- Cradle Mountain Tourism Statistics
- Esperance Tourism Statistics
- Melbourne Tourism Statistics
- Noosa Tourism Statistics
- Queensland Tourism Statistics
- Sunshine Coast Tourism Statistics
- Sydney Opera House Tourism Statistics
- Sydney Tourism Statistics
- Warner Bros. Movie World Tourism Statistics
- Western Australia Tourism Statistics
FAQs
How many international tourists visit Victoria each year?
About 2.83 million international visitors came to Victoria in 2025, up 4% on 20242 but still about 10% below the 3.14 million of 20197. They spent about A$9.68 billion2. China is the biggest market, with about 494,000 visitors in the year ending June 2026, followed by New Zealand and the United Kingdom19.
How does Victoria compare with other states for tourism?
Victoria is the country's second-largest domestic tourism market, drawing about 27.8% of all domestic overnight trips in Australia in 2025, behind New South Wales1. It gets more day trips than any other state3, and Melbourne drew more domestic overnight visitors than any other region in Australia, ahead of Sydney18.
How much do visitors spend per trip in Victoria?
Domestic overnight visitors spent about A$732 per trip in Victoria in 2025, or about A$263 per night18.
What is the most visited place in Victoria?
Melbourne, with about 13.4 million domestic overnight trips and 2.67 million international visitors in the year ending June 20264. Outside the city, the Mornington Peninsula is the most visited region, with about 2.83 million domestic overnight trips, ahead of Gippsland and Geelong and the Bellarine.
What is the busiest month for tourists in Victoria?
December was the busiest month for overseas visitors in 2025, with about 281,540 arrivals planning to stay mainly in Victoria15, and February has been the busiest month of 2026 so far, with 263,660. Australians travel most in summer, making about 8.65 million overnight trips in the March quarter of 20251, more than in any other quarter.
Campervan hire in Australia
- Adelaide campervan rental
- Alice Springs campervan rental
- Brisbane campervan rental
- Broome
- Cairns motorhome hire
- Campervan hire in Devonport
- Campervan hire in Melbourne
- Campervan hire in Perth
- Campervan hire in Tasmania
- Darwin motorhome hire
- Gold Coast motorhome hire
- Hobart campervan rental
- Launceston motorhome hire
- Sydney
- Victoria campervan rental
References
- Domestic Tourism Statistics results — December quarter 2025 (Tourism Research Australia) · Tourism Research Australia ↑ b c d e f g h i j k l m n o p q
- International tourism results — year ending December 2025 (International Visitor Survey) · Tourism Research Australia ↑ b c d e f g h i j k l m n o p q
- Domestic Tourism Statistics results — June quarter 2026 compared to June quarter 2025 (Tourism Research Australia) · Tourism Research Australia ↑ b c d e f g h i j k
- Victoria's Visitor Economy: Total tourism data dashboard, year ending June 2026 (Department of Jobs, Skills, Industry and Regions; TRA DoTS/IVS) · app.powerbi.com ↑ b c d e f g h i j k l
- Fact sheet – Economic contribution of tourism to Victoria and its regions 2024-25 (Department of Jobs, Skills, Industry and Regions) · djsir.vic.gov.au ↑ b c d
- Tourism Research Australia — Domestic Tourism Statistics: 2019–2024 overnight backcast data (revised) · Tourism Research Australia ↑ b c d e f g h i j k l m n o p
- IVS results for the year ending December 2024 compared to December 2019 · Tourism Research Australia ↑ b c d e
- International tourism results — March quarter 2026 (International Visitor Survey) · Tourism Research Australia ↑ b
- IVS results for the year ending December 2024 compared to December 2023 · Tourism Research Australia ↑ b c d
- International Visitor Survey tourism results — year ending December 2022 compared with 2021 (Tourism Research Australia) · Tourism Research Australia ↑ b
- International Visitor Survey tourism results — year ending December 2021 compared with 2020 (Tourism Research Australia) · Tourism Research Australia ↑ b c d
- Domestic Tourism Statistics results — March quarter 2026 compared to March quarter 2025 (Tourism Research Australia) · Tourism Research Australia ↑ b
- International tourism results — year ending June 2026 (International Visitor Survey) · Tourism Research Australia ↑ b c
- Victoria's $49.5 billion visitor economy (Visit Victoria) · corporate.visitvictoria.com ↑ b c d
- Overseas Arrivals and Departures, Australia, August 2026 — Table 11: Short-term visitors arriving, state of intended stay (ABS) · Australian Bureau of Statistics ↑ b c
- Visitors Spend Big In Victoria (Premier of Victoria media release, year ending December 2025 tourism results) · premier.vic.gov.au ↑
- State and Regional Tourism Satellite Accounts 2024–25 · Tourism Research Australia ↑
- Domestic Tourism Statistics Snapshot, year ending December 2025 (Tourism and Events Queensland) · teq.queensland.com ↑ b c d e f g h i j
- Top International Markets to Victoria (ranked on spend), year ending June 2026 — international market data dashboard (Department of Jobs, Skills, Industry and Regions; TRA IVS) · app.powerbi.com ↑ b c d
- Council of Trustees of the National Gallery of Victoria Annual Report 2024/25 · ngv.vic.gov.au ↑ b
- Zoos Victoria Annual Report 2024-25 · parliament.vic.gov.au ↑ b
- Victorian Arts Centre Trust Annual Report 2024–25 · artscentremelbourne.com.au ↑ b
- Royal Botanic Gardens Victoria Annual Report 2024-25 · cdn.rbg.vic.gov.au ↑ b
- Museums Board of Victoria Annual Report 2024–25 · museumsvictoria.com.au ↑ b c
- ACMI Annual Report 2024–25 · acmi-website-media-prod.s3.amazonaws.com ↑ b
- Construction begins on Twelve Apostles Visitor Experience Centre (Department of Jobs, Skills, Industry and Regions) · djsir.vic.gov.au ↑ b c
- Phillip Island Nature Parks Annual Report 2024–25 · penguins.org.au ↑ b
- The Sovereign Hill Museums Association Annual Report 2024-25 · storage.googleapis.com ↑ b
- Puffing Billy Railway Board Annual Report 2024–2025 · parliament.vic.gov.au ↑ b
- The MCG contributed $720 million to the Victorian economy in 2024 · mcg.org.au ↑
- Caravan and Camping State of Industry 2025 (Caravan Industry Association of Australia) · assets.pc.gov.au ↑ b c d e f g
- Parks Victoria Annual Report 2024–25 (Parks Victoria) · parks.vic.gov.au ↑
- Tourism Research Australia — International Visitor Survey and National Visitor Survey · Tourism Research Australia
- Tourism Research Australia — Local Government Area Profiles, Whitsunday, 2019 · Tourism Research Australia
- TRA — International tourism results, Australia, March 2024 · Tourism Research Australia