

Updated
At a glance
- In the year to March 2026, Noosa had about 2.15 million visitors who spent $1.26 billion.1
- Noosa had 2.1 million visitors in 2023-242, down from 2.2 million in 2022-23.3
- Visitors spent $1.4 billion in 2023-24, 28% more than pre-COVID 2019.2
- Interstate visitors spent the most in 2023-24: $617 million, or 44% of the total.2
- Overnight visitors stay about 4 nights on average.4
Noosa 2026 statistics: visitors, spending and more
Visitors and spending: year to March 2026
Overnight visitors made up just over half of Noosa's visitors in the year to March 2026, but they accounted for 88% of visitor spending.1 Day trippers, the other 48%, spent just 12%.
Other 2026 figures
- Noosa accounted for 3.4% of Queensland's domestic overnight visitor spending in the year to March 2026, and 26.7% of the Sunshine Coast region's.1
- International visitor spending was up 45% on the year before, and the average overseas visitor spent $1,215 per trip.1
- In June and July 2026, visitors spent $144.1 million in person in Noosa, 16.6% more than a year earlier and 46% of all in-person card spending in the shire.1
- Over winter 2026, the average daily accommodation rate was $348, and July weekends averaged 72% occupancy.1
About the 2026 figures
How many tourists visit Noosa each year?
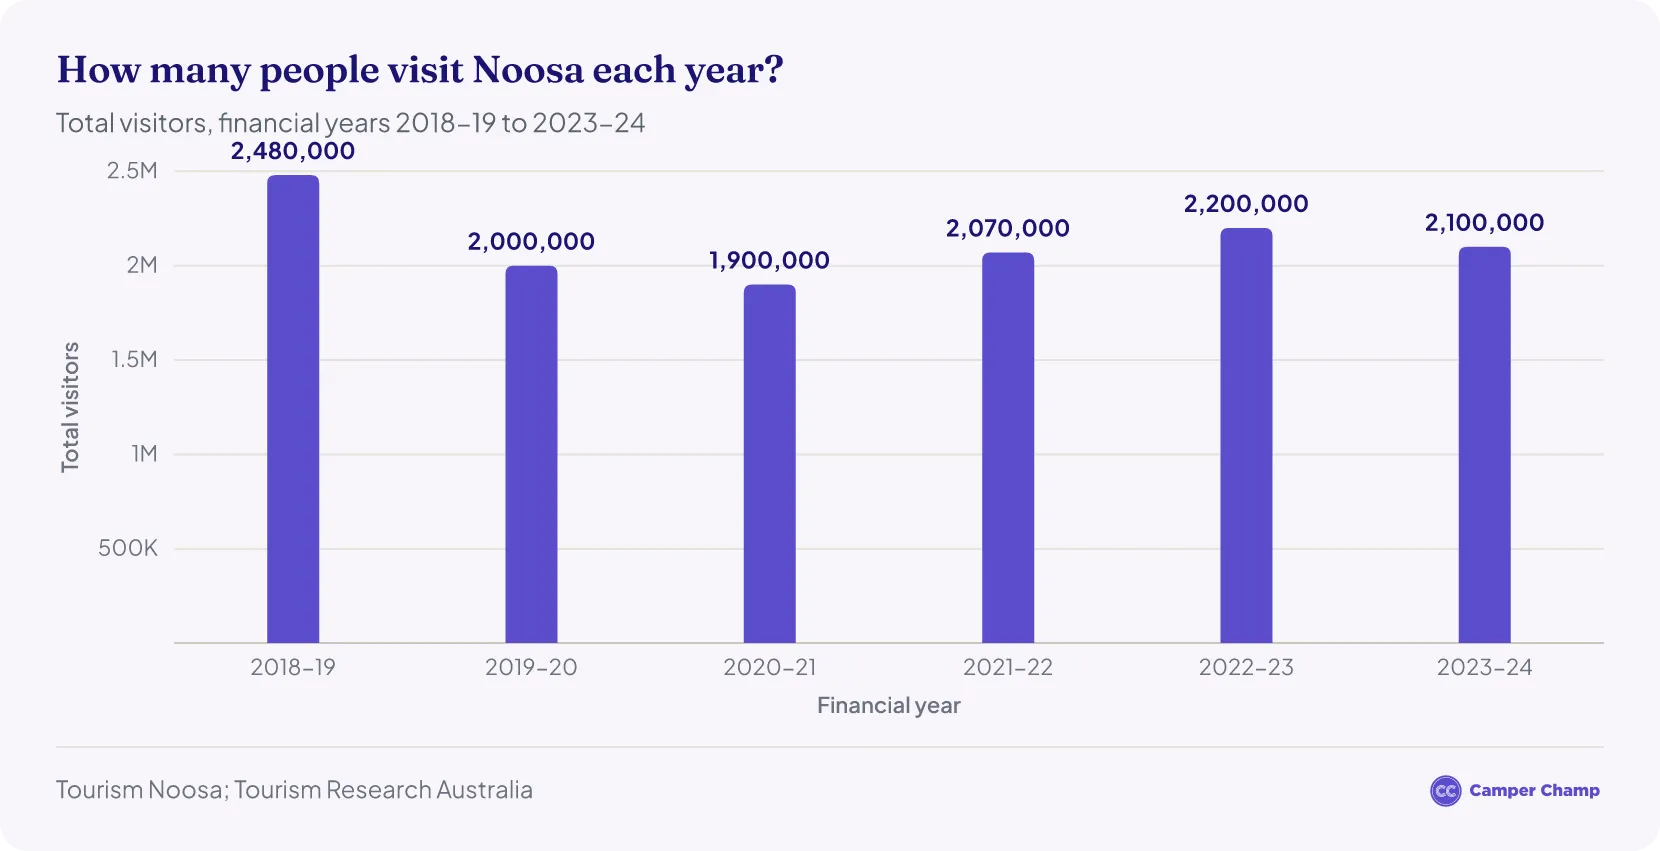
About 2.15 million tourists visit Noosa a year and spend $1.26 billion, based on the latest figures for the year to March 2026.1 Since 2018-19, yearly visitor numbers have stayed between 1.9 million and 2.5 million.
- In 2018-19, before COVID-19, Noosa drew about 2.5 million visitors.6
- COVID-19 restrictions cut that to roughly 2 million in 2019-20 and 1.9 million in 2020-21.7
- Numbers recovered to about 2.07 million in 2021-22 and 2.2 million in 2022-23.3
- They eased slightly to 2.1 million in 2023-24.2
- Tourism Research Australia changed how it surveys domestic travel in 2025, so the latest figure can't be compared directly with these.1
| Noosa total visitors by financial year | |
|---|---|
| Financial Year | Total visitors |
| 2018-19 | 2,480,000 |
| 2019-20 | 2,000,000 |
| 2020-21 | 1,900,000 |
| 2021-22 | 2,070,000 |
| 2022-23 | 2,200,000 |
| 2023-24 | 2,100,000 |
Source · Sources · Tourism Noosa visitor statistics, year ending June 2022 (2018-19, 2021-22) 6; Noosa Today, 5 October 2021 (2020-21); Tourism Noosa Annual Report 2022-23 (2022-23); Tourism Noosa Annual Report 2023-2024 (2023-24); 2019-20 read from a chart in Tourism Noosa Annual Report 2020-21
Where do Noosa's international visitors come from?
- The United Kingdom sends Noosa the most international visitors, while New Zealand is the highest-spending market. New Zealanders spent a record $59.7 million in the year to March 2026, up 62%, and UK visitors a record $33.2 million, up 47%.1
- In total, 147,000 international visitors spent a record $178.6 million in the year to March 2026, 45% more than the year before and 84% more than before COVID-19.1
- International visitors stayed 1.26 million nights in Noosa, 10% more than the year before, and spent an average of $1,215 per trip, up 64%.1
- Unlike the domestic figures, international visitor numbers can still be compared with earlier years.1
How much do tourists spend in Noosa each year?
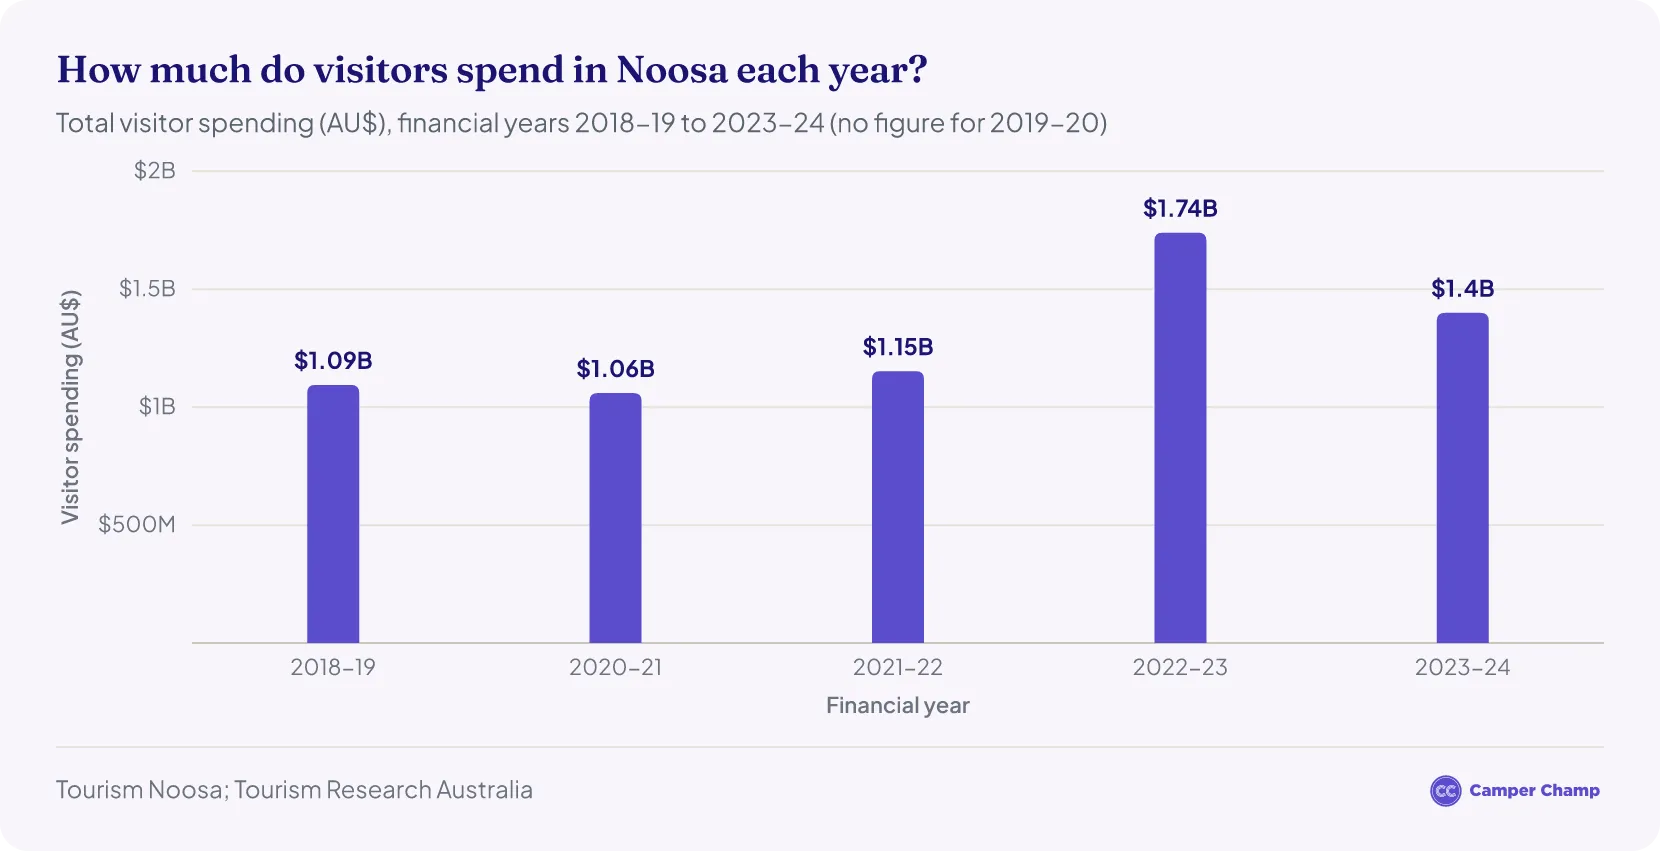
- Visitors spent about $1.1 billion in Noosa in 2018-19, before COVID-19.6
- No spending total is available for 2019-20.
- Spending dipped to $1.06 billion in 2020-21, 3% below the pre-pandemic level.7
- It rose to $1.15 billion in 2021-22, 5.3% more than in 2018-19.6
- Visitors spent a record $1.74 billion in 2022-23, 51% more than the year before.3
- Spending eased to $1.4 billion in 2023-24, still 28% above pre-COVID 2019.2
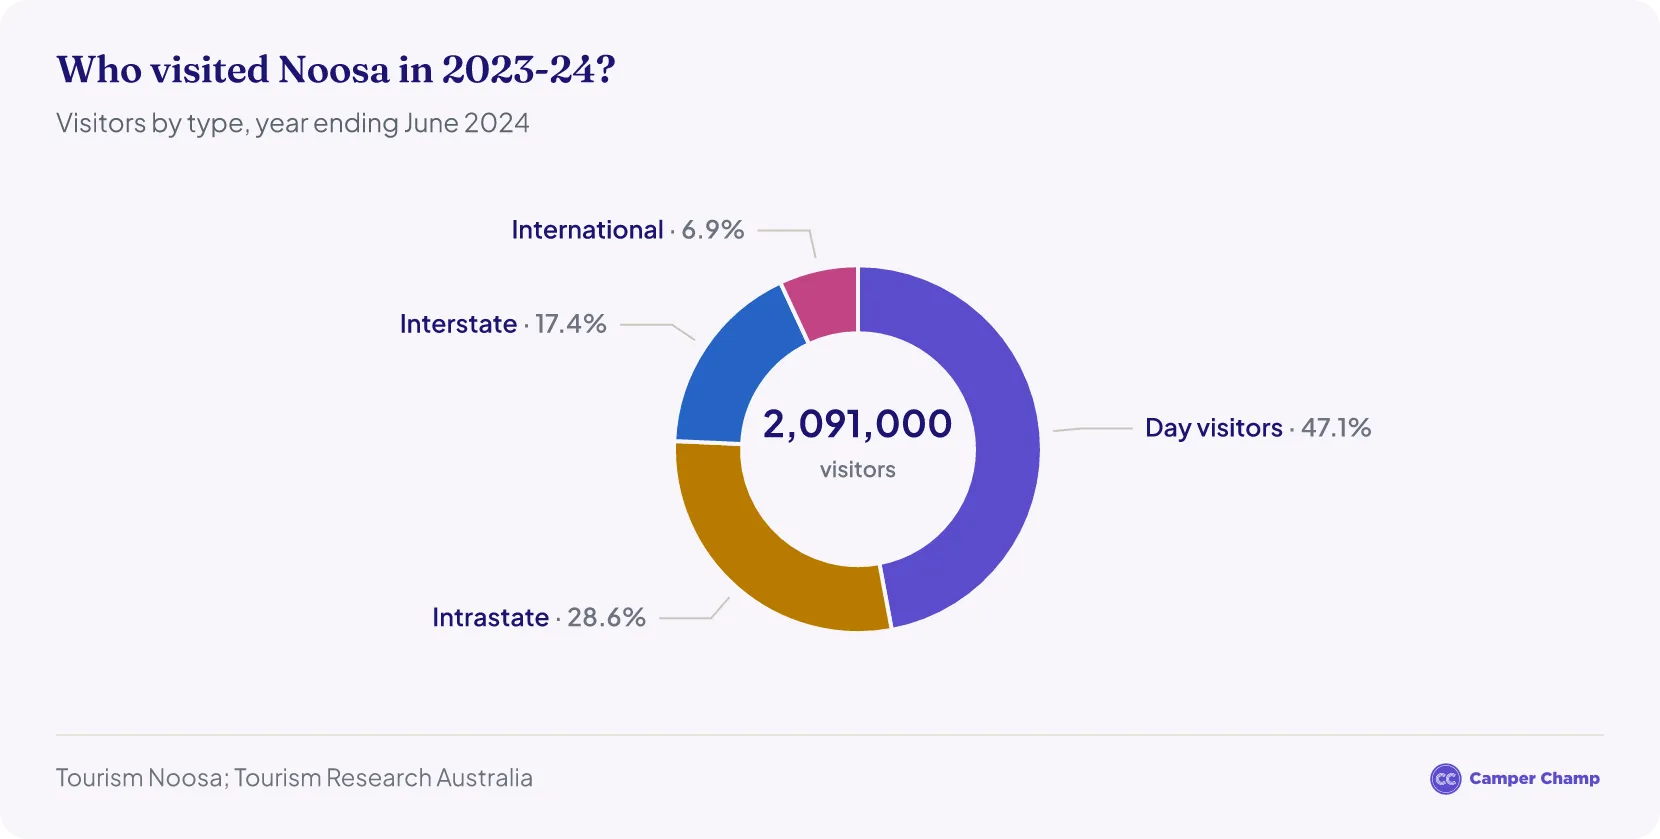
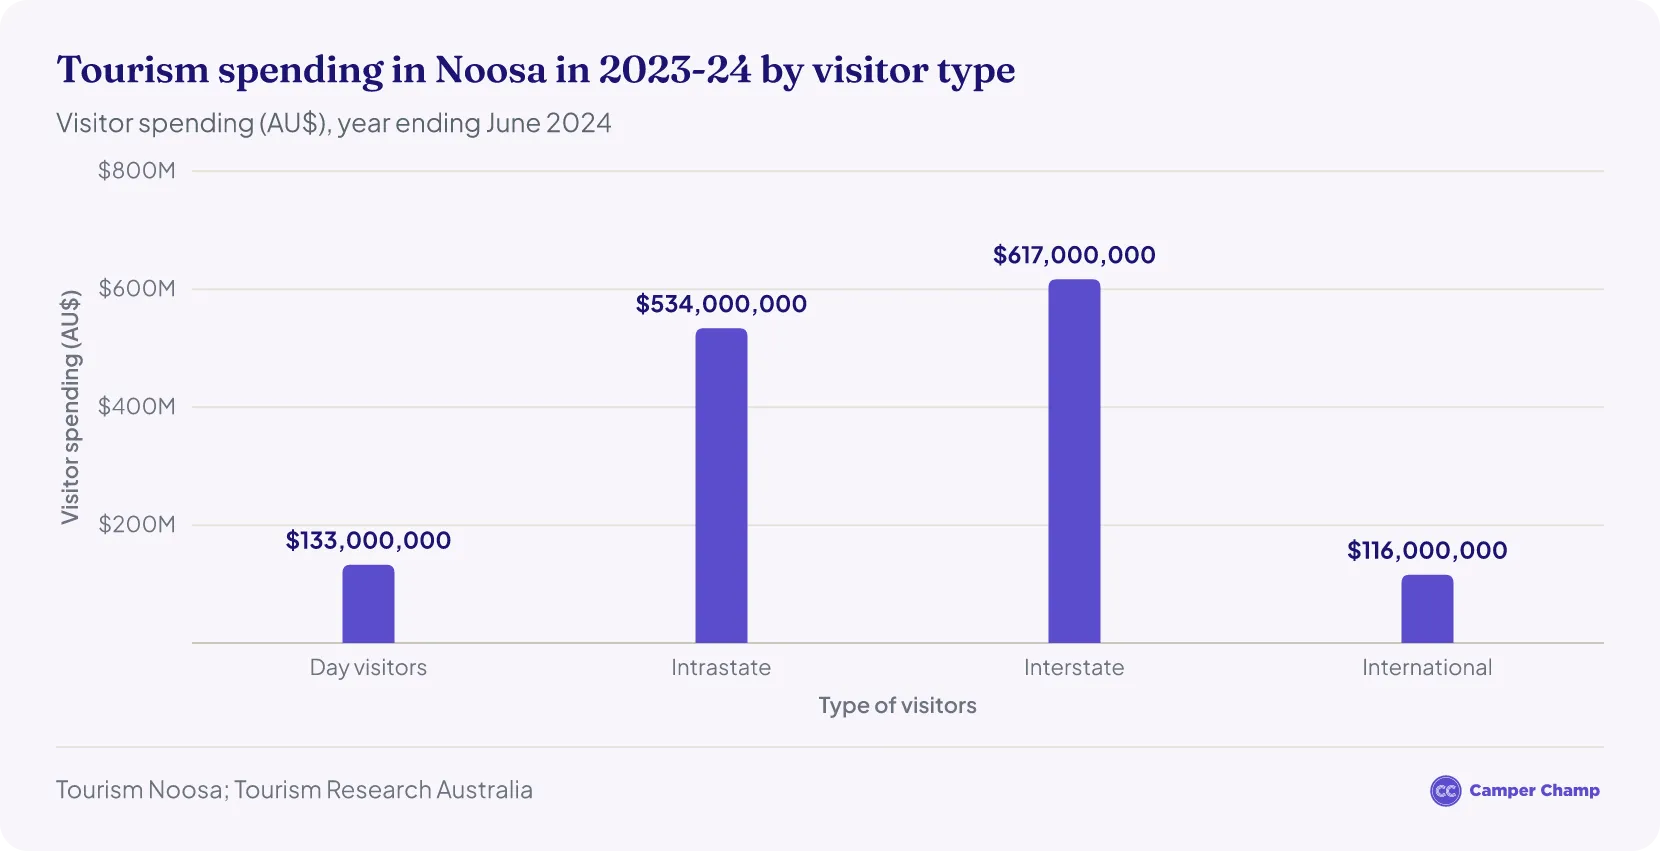
- Interstate visitors spent the most in 2023-24: $617 million, or 44% of the total. Visitors from elsewhere in Queensland spent $534 million (38%), day trippers $133 million (10%) and international visitors $116 million (8%).2
| Noosa total visitor spending by financial year | |
|---|---|
| Financial year | Visitor spending (AU$) |
| 2018-19 | $1,094,700,000 |
| 2020-21 | $1,060,000,000 |
| 2021-22 | $1,153,000,000 |
| 2022-23 | $1,740,000,000 |
| 2023-24 | $1,400,000,000 |
Source · Sources · Tourism Noosa Annual Report 2023-2024 (2023-24) 2; Tourism Noosa Annual Report 2022-23 (2022-23); Tourism Noosa visitor statistics, year ending June 2022 (2018-19, 2021-22); Noosa Today, 5 October 2021 (2020-21)
What are the latest spending figures for Noosa?
- In the year to March 2026, visitors spent $1.26 billion in Noosa. Domestic overnight visitors spent $931 million (74%), international visitors $179 million (14%) and day trippers $146 million (12%).1
- International visitors spent a record $168 million in the 2024-25 financial year, up 47% on the year before.5
- There is no full 2024-25 total for domestic spending; from January to June 2025, visitors spent $670 million.5
Most visited attractions in Noosa
Noosa's biggest draws are its national park, beaches and everglades, along with the shops and restaurants of Hastings Street.
- Noosa National Park: 1.5 million visitors per year8, one of Australia’s most visited national parks.
- Noosa Main Beach & Hastings Street: Boutique shops, cafés and restaurants a short walk from the surf.
- Noosa Everglades: One of only two everglade systems in the world.
- Noosa Triathlon & Surfing Festival: Each draws thousands of visitors a year.
How many tourists visit Noosa National Park each year?
- About 1.5 million people visit8 Noosa National Park each year, making it one of Australia's busiest national parks.
How much do tourists spend in Noosa National Park each year?
- Entry to Noosa National Park is free, so spending in the park itself isn't measured. Visitors to Noosa as a whole spent $1.26 billion in the year to March 2026.1
How long do tourists spend in Noosa?
- Overnight visitors stay about 4 nights on average.4
- In 2022, interstate visitors stayed about 6.3 nights, while Queenslanders stayed about 2.7 nights.4
- International visitors stayed 7.8 nights on average in 2023-24.2
When is Noosa busiest?
- Noosa is busiest in the school holidays, especially when the Queensland, New South Wales and Victorian breaks overlap.1
- In winter 2026, July weekends were the busiest, with accommodation 72% full on average, up from 67% a year earlier. The biggest spending day was 4 July, the start of the week all three eastern states were on school holidays together.1
- As at 25 August 2026, the middle week of the spring school holidays, when all three states were off, was about 54% booked, the same as a year earlier.1
- Events such as the Noosa Triathlon weekend (31 October to 1 November 2026) bring extra peaks.1
How many visitors does Noosa get per resident?
How many people camp in Noosa?
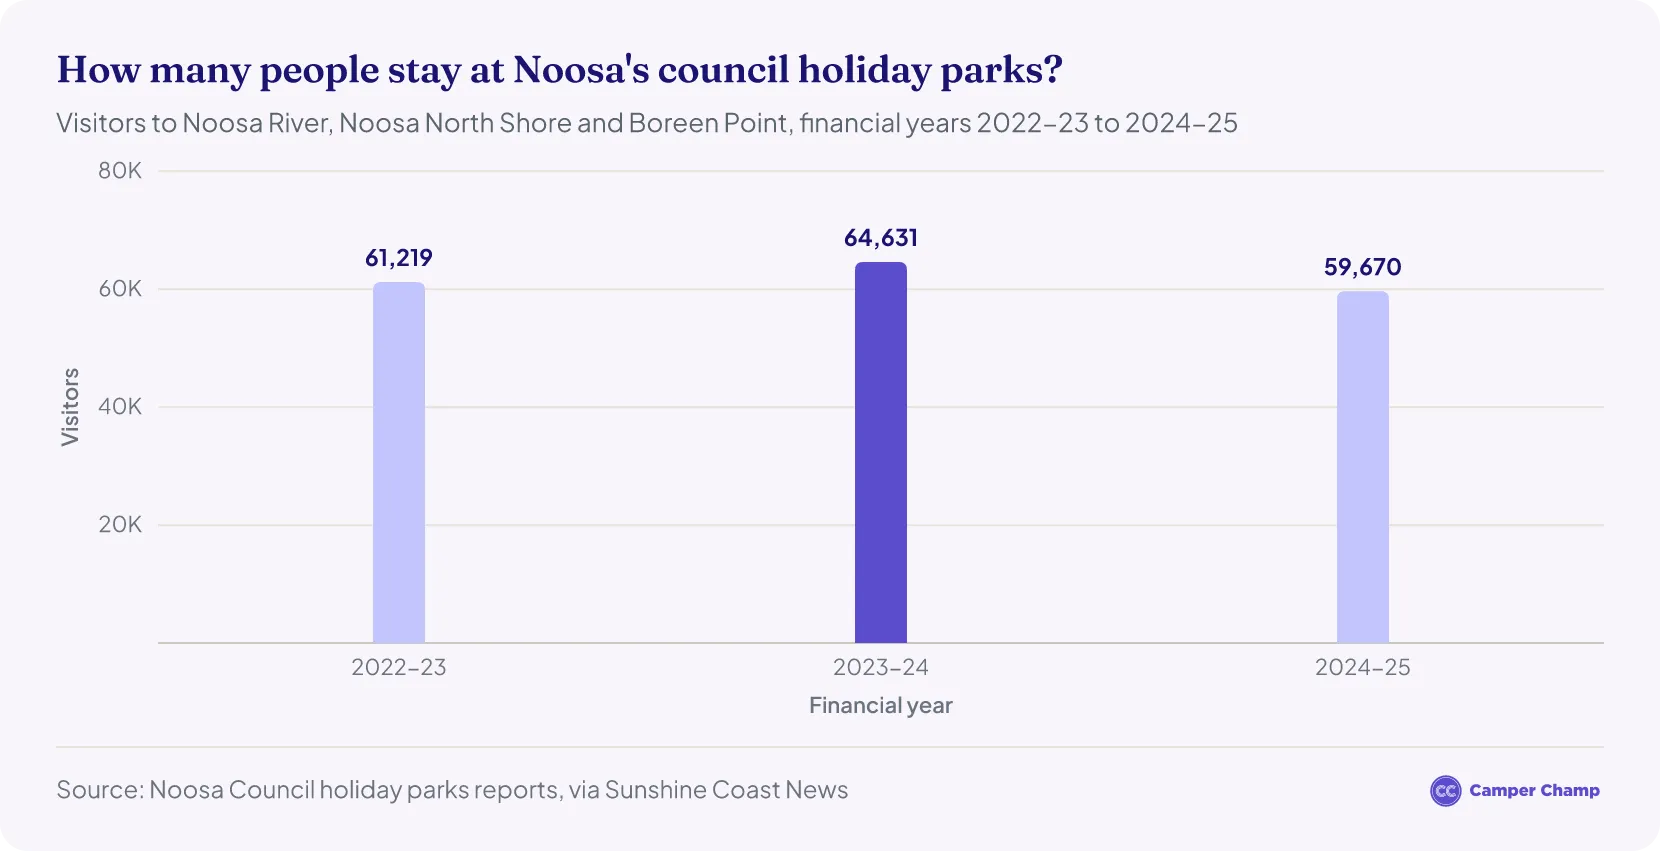
Noosa Council runs three holiday parks, with 294 sites between them10: Noosa River Holiday Park, Noosa North Shore Campground and Boreen Point Campground. The figures below cover only these council-run parks, not private caravan parks or national park campsites.
- The parks had 59,670 visitors in 2024-25, 7.7% fewer than the year before. The council put the dip down to softer caravan and camping demand across Queensland and wet weather.10
- That followed a record 64,631 visitors in 2023-2411, up from 61,219 in 2022-23.12
- Noosa North Shore Campground had its own record in 2023-24, with 25,707 visitors, up 14%.11
- In 2024-25, the parks sold 42,765 site nights at Noosa River, 22,410 at Noosa North Shore and 14,142 at Boreen Point, and earned $4.62 million.10
- Bookings picked up in 2025-26: by 31 December 2025, the parks had more than 31,000 visitors and had sold 42,027 nights, 53% of the previous year's total.13
- Most guests are Queenslanders. At Noosa River Holiday Park, their share has risen from 62% to 74% since 2023, while international guests fell from 15% to 10%.13
Latest full year available: 2024-25.
| Noosa holiday parks by park, 2024-25 | |||
|---|---|---|---|
| Park | Site nights sold | Revenue | Visitors vs 2023-24 |
| Noosa River Holiday Park | 42,76510 | $2.62 million10 | 918 fewer10 |
| Noosa North Shore Campground | 22,41010 | $1.31 million10 | 1,739 fewer10 |
| Boreen Point Campground | 14,14210 | $690,00010 | 1,805 fewer10 |
Other Resources
- Adelaide Tourism Statistics
- Bondi Beach Tourism Statistics
- Byron Bay Tourism Statistics
- Cairns Tourism Statistics
- Cradle Mountain Tourism Statistics
- Darwin Tourism Statistics
- Esperance Tourism Statistics
- Fraser Island Tourism Statistics
- Great Barrier Reef Tourism Statistics
- Northern Territory Tourism Statistics
- Perth Tourism Statistics
- Queensland Tourism Statistics
Noosa Tourism Statistics in 2018-2019
Frequently asked questions
When is Noosa busiest?
Accommodation fills up most around school holidays and weekends. In winter 2026, July was the peak: school holidays ran through its first three weeks, and weekends averaged 72% occupancy, up from 67% the year before.1
How much does accommodation cost in Noosa?
The average daily accommodation rate in Noosa was about $348 over winter 2026 (June to August), the same as winter 2025.1
Where do Noosa's international visitors come from?
The United Kingdom sends the most international visitors to Noosa, while New Zealand is the highest-spending market at $59.7 million in the year to March 2026. UK visitors spent $33.2 million.1
Do overnight visitors or day trippers spend more in Noosa?
Overnight visitors spend far more. They make up 52% of Noosa's visitors but account for 88% of visitor spending, while day trippers, the other 48%, account for just 12%.1
How much do international visitors spend per trip in Noosa?
International visitors spent an average of $1,215 per trip in the year to March 2026, up 64% on the year before.1
Can recent Noosa visitor figures be compared with earlier years?
Not for domestic visitors. Tourism Research Australia changed how it collects domestic travel data in 2025, so newer figures can't be compared with earlier years. International figures are still comparable.1
Campervan hire in Australia
- Adelaide motorhome hire
- Alice Springs motorhome hire
- Brisbane campervan rental
- Broome campervan rental
- Cairns motorhome hire
- Campervan hire in Hobart
- Campervan hire in Sydney
- Darwin motorhome hire
- Devonport campervan rental
- Gold Coast motorhome hire
- Launceston campervan rental
- Melbourne
- Noosa campervan rental
- Perth
- Tasmania campervan rental
References
- Tourism Noosa Visitor Forecast — Spring 2026 (year ending March 2026) · visitnoosa.com.au ↑ b c d e f g h i j k l m n o p q r s t u v w x y z a2 b2 c2
- Tourism Noosa Annual Report 2023-2024 · visitnoosa.com.au ↑ b c d e f g h i j k
- Tourism Noosa Annual Report 2022-2023 · visitnoosa.com.au ↑ b c
- Tourism Noosa Visitor Statistics, year ending December 2022 · visitnoosa.com.au ↑ b c
- Tourism Noosa Annual Report 2024-2025 · visitnoosa.com.au ↑ b c
- Tourism Noosa Visitor Statistics, year ending June 2022 · visitnoosa.com.au ↑ b c d e f
- Noosa tourism market records strong results (Noosa Today, 5 October 2021) · noosatoday.com.au ↑ b
- Noosa National Park — Visiting safely · parks.qld.gov.au ↑ b
- Data by region: Noosa (LGA 35740) — estimated resident population · dbr.abs.gov.au ↑
- Campground visitors decrease despite bumper forward bookings (Sunshine Coast News, 18 August 2025) · sunshinecoastnews.com.au ↑ b c d e f g h i j k l
- Caravan parks hit record high visitor numbers (Sunshine Coast News, 13 August 2024) · sunshinecoastnews.com.au ↑ b
- Caravan parks notch up record revenue, visitor numbers (Sunshine Coast News, 9 August 2023) · sunshinecoastnews.com.au ↑
- Holiday park bookings surge above expectations (Sunshine Coast News, 31 March 2026) · sunshinecoastnews.com.au ↑ b
- Tourism Noosa Annual Report · visitnoosa.com.au
- Visiting Noosa safely · parks.desi.qld.gov.au
- International visitors spent a record $113.3 million in Noosa · noosatoday.com.au