

Updated
At a Glance
- Tourists made 11.02 million overnight trips to Western Australia in 2025: 9.95 million by Australians1 and 1.07 million by international visitors2.
- In the first half of 2026, tourists made about 5.45 million overnight trips to the state3 and spent about A$7.34 billion4.
- Australians also made about 29.1 million day trips in Western Australia in 20255.
- Overnight visitors spent about A$14.60 billion in 2025: A$11.20 billion by domestic visitors1 and A$3.40 billion by international visitors2. Including day trips, Tourism WA puts visitor spending at A$19.2 billion6.
- Perth is the most visited region, with about 6.13 million domestic overnight trips7 and 1.01 million international visitors in 20252.
- Tourism contributed A$16.6 billion to the state economy in 2024–258, counting indirect effects, and supported 106,800 jobs.
How many tourists visit Western Australia each year?
Tourists made about 11.02 million overnight trips to Western Australia in calendar year 2025, not counting about 29.1 million day trips by Australians5. Including day trips, visitors spent about A$19.2 billion in the state.6
- Of these, around 9.95 million were domestic overnight trips1, 2% more than the 9.75 million in 20249.
- International visitors numbered about 1.07 million in 20252, up 23% from 865,000 in 2024 and about 7% above the 996,000 who came in 201910.
- Domestic figures come from Tourism Research Australia's Domestic Tourism Statistics, which replaced the National Visitor Survey in 2025. The 2019–2024 figures are its adjusted back-series, so they differ from numbers published earlier.
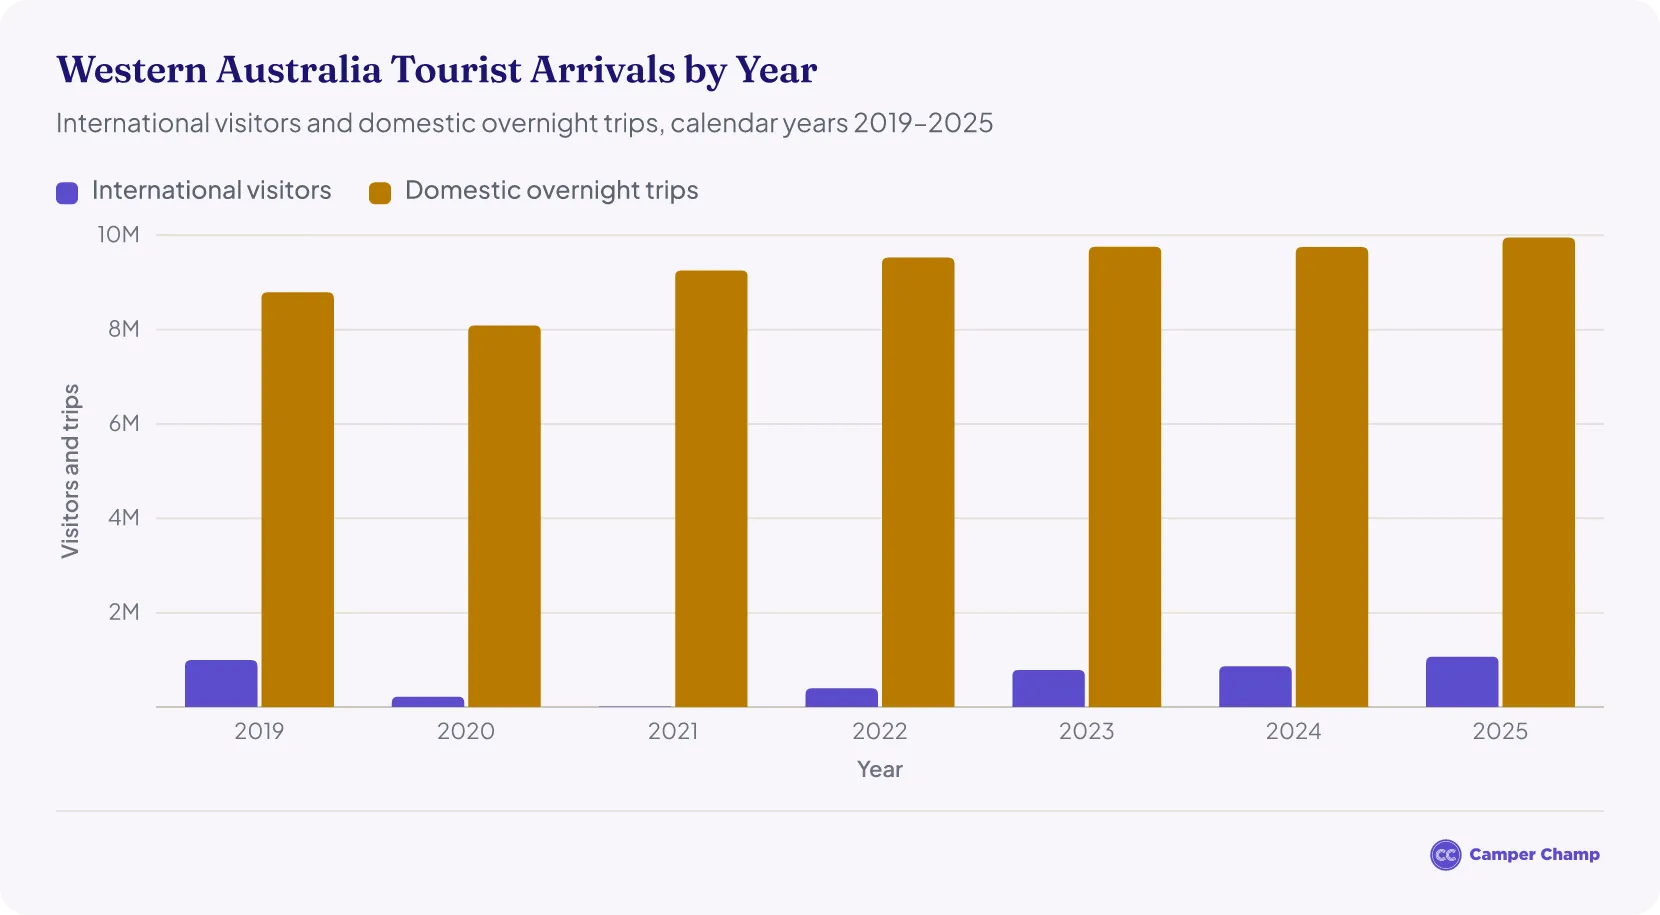
| Year | Period | Total overnight trips | International visitors | Domestic overnight trips | Overnight visitor spending |
|---|---|---|---|---|---|
| 2026 (so far) | January–June 2026 | 5.45 million | 498,5203 | 4.95 million4 | A$7.34 billion4 |
| 2025 | Year ending December 2025 | 11.02 million | 1.07 million2 | 9.95 million1 | A$14.60 billion1 |
| 2024 | Year ending December 2024 | 10.62 million | 864,98011 | 9.75 million9 | A$12.33 billion9 |
| 2023 | Year ending December 2023 | 10.54 million | 786,67011 | 9.76 million9 | A$12.39 billion9 |
| 2022 | Year ending December 2022 | 9.93 million | 398,23012 | 9.53 million9 | A$10.08 billion9 |
| 2021 | Year ending December 2021 | 9.27 million | 14,69013 | 9.25 million9 | A$7.58 billion9 |
| 2020 | Year ending December 2020 | 8.31 million | 220,19013 | 8.09 million9 | A$5.87 billion9 |
| 2019 | Year ending December 2019 | 9.79 million | 995,73010 | 8.79 million9 | A$8.21 billion9 |
Source · Data source: Tourism Research Australia (International Visitor Survey and Domestic Tourism Statistics).
How many tourists have visited Western Australia in 2026?
Tourists made about 5.45 million overnight trips to Western Australia between January and June 20264, much the same as in the first half of 2025. They spent about A$7.34 billion, up 1%14.
- Australians made 4.95 million overnight trips4, just under the 4.97 million of a year earlier, and spent about A$5.80 billion, up 5%.
- International visitors made about 498,500 trips3, up 1% on 491,500, and spent about A$1.54 billion, down 11%14.
- Australians also made about 15.6 million day trips in the state, up 11%4.
- Including day trips, Tourism WA puts visitor spending at A$19.8 billion in the year ending June 202615, the latest figure.
- The March quarter was busier than the June quarter, with 2.54 million domestic overnight trips against 2.41 million4.
- Figures come from Tourism Research Australia's June quarter 2026 releases, the latest available. The 2026 totals combine the March and June quarters.
How much do tourists spend in Western Australia?
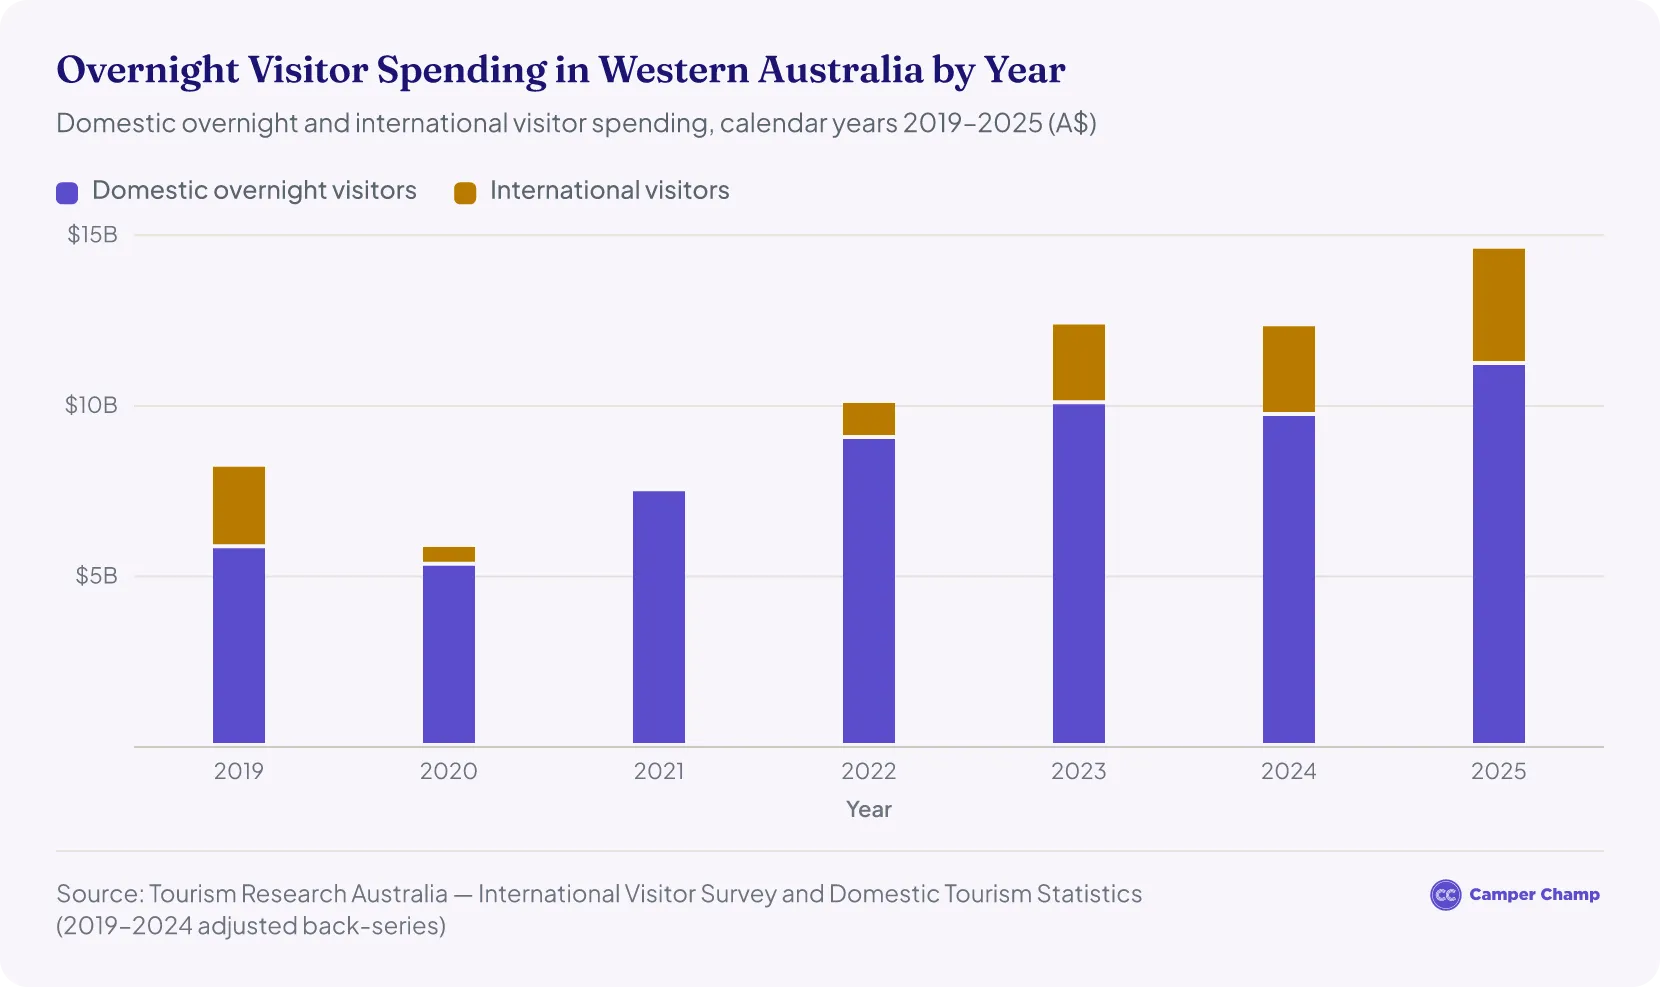
Domestic overnight and international visitors spent A$14.60 billion in Western Australia in the year ending December 2025. Including day trips, Tourism WA puts total visitor spending at A$19.2 billion, with 31% of it spent in regional Western Australia6. That rose to A$19.8 billion in the year ending June 202615, the latest figure.
- Domestic overnight visitors contributed about A$11.20 billion1, around 15% more than the A$9.71 billion spent in 20249.
- International visitors spent around A$3.40 billion in 20252, 30% more than the A$2.63 billion spent in 2024 and about 43% higher than the pre-pandemic A$2.38 billion in 201910.
- Total overnight visitor spending was about 78% higher than in 2019, when it totalled about A$8.21 billion10.
- Domestic spending figures also come from Tourism Research Australia's Domestic Tourism Statistics. The 2019–2024 figures are its adjusted back-series, and it advises caution when comparing them with 2025. Tourism WA reports domestic and total spending only from 2025.
How important is tourism to Western Australia's economy?
Tourism contributed about A$16.6 billion to the Western Australian economy in the 2024–25 financial year8, counting its direct and indirect effects. Visitors spent about A$21.1 billion on tourism goods and services in the state, down 6.3% on 2023–24.
- Tourism directly contributed about A$8.0 billion, down 5.3%8 on the year before, and indirectly another A$8.6 billion. Western Australia was the only state or territory where tourism's direct contribution fell.
- The industry supported 106,800 jobs, down 3.9%8. About 65,200 of them were directly in tourism, down 7.2%.
- These are the latest figures from Tourism Research Australia's state tourism satellite accounts. They use a new model, so they can't be compared with earlier published editions.
How many day trips are made in Western Australia?
Australians made about 29.1 million domestic day trips in Western Australia in 2025 and spent about A$4.60 billion on them5. Together with overnight trips, that makes about 39.0 million domestic trips and about A$15.80 billion in domestic visitor spending.
How does Western Australia compare with other states for tourism?
Western Australia is Australia's fourth-biggest state for domestic overnight trips, but its visitors spend more per trip than in any state or territory except the Northern Territory. Australians made 9.95 million overnight trips to Western Australia in 2025, behind New South Wales (39.21 million), Victoria (31.38 million) and Queensland (25.94 million), and ahead of South Australia (7.81 million)5.
- Domestic visitors spent about A$15.80 billion in Western Australia in 2025, including day trips, the fourth most of any state5.
- Its domestic overnight visitors spent about A$1,125 per trip, against a national average of A$9455. Only the Northern Territory was higher, at A$1,734.
- Western Australia drew the fourth-most international visitors, about 1.07 million, behind New South Wales (4.11 million), Victoria (2.83 million) and Queensland (2.37 million)2. They spent about A$3.40 billion in the state.
| State | Domestic overnight trips | Day trips | Domestic visitor spending | International visitors | International visitor spending |
|---|---|---|---|---|---|
| New South Wales | 39.21 million | 84.03 million | A$45.36 billion | 4.11 million | A$15.04 billion |
| Victoria | 31.38 million | 84.54 million | A$37.04 billion | 2.83 million | A$9.68 billion |
| Queensland | 25.94 million | 55.37 million | A$36.85 billion | 2.37 million | A$7.48 billion |
| Western Australia | 9.95 million | 29.09 million | A$15.80 billion | 1.07 million | A$3.40 billion |
| South Australia | 7.81 million | 16.39 million | A$9.28 billion | 445,000 | A$1.76 billion |
| Tasmania | 2.97 million | 4.65 million | A$3.75 billion | 279,000 | A$712 million |
| Australian Capital Territory | 2.25 million | 2.09 million | A$2.57 billion | 199,000 | A$587 million |
| Northern Territory | 995,000 | 1.22 million | A$1.99 billion | 255,000 | A$527 million |
Source · Data source: Tourism Research Australia, Domestic Tourism Statistics, year ending December 2025 (as published by Tourism and Events Queensland), and International Visitor Survey, year ending December 2025.
How long do tourists stay in Western Australia?
- Domestic overnight visitors spent about 35.4 million nights in Western Australia in 2025, an average of about 3.6 nights per trip5.
- Interstate visitors stayed 6.3 nights on average, the longest of any state5, while Western Australians travelling in their own state stayed 3.2 nights.
- International visitors spent about 42.0 million nights in the state, up 34% on 20242, an average stay of about 39 nights.
- Most of those international nights, about 35.6 million, were spent in Perth2.
Where do Western Australia's visitors come from?
Western Australians travelling in their own state made about 8.73 million of the 9.95 million domestic overnight trips in 20255. Interstate visitors made about 1.22 million, up 10.6% on 2024.
- Western Australians spent about A$7.90 billion on overnight trips in their own state5, and interstate visitors spent about A$3.30 billion.
- About 4.71 million domestic overnight trips were holidays, 3.39 million were visits to friends and relatives and 989,000 were business trips5.
- New South Wales sends the most interstate visitors, about 35%, followed by Victoria (29%) and Queensland (18%)7.
| Visitors | Overnight trips | Share of overnight trips | Overnight spending | Average stay |
|---|---|---|---|---|
| Western Australians (travelling in their own state) | 8.73 million5 | 79% | A$7.90 billion5 | 3.2 nights5 |
| Interstate visitors | 1.22 million5 | 11% | A$3.30 billion5 | 6.3 nights5 |
| International visitors | 1.07 million2 | 10% | A$3.40 billion2 | 39 nights2 |
Source · Data source: Tourism Research Australia, Domestic Tourism Statistics, year ending December 2025 (as published by Tourism and Events Queensland), and International Visitor Survey, year ending December 2025.
The United Kingdom is Western Australia's biggest international market by visitor numbers: about 163,100 British visitors spent A$414 million in the state in 20256. Singapore was second, with more than 125,000 visitors spending close to A$280 million, followed by New Zealand (77,100) and China, including Hong Kong (70,300).
- China was the biggest market by spending, at about A$503 million6.
- Malaysia (60,200)6, India (50,000), the United States (48,400) and Indonesia (43,700) were the next-largest markets by visitor numbers.
- Western Australia was the only state or territory where international visitor numbers in 2025 were back above their 2019 level6.
- The market figures are from Tourism Western Australia's 2025–26 annual report, based on Tourism Research Australia's International Visitor Survey.
| Rank by visitors | Market | Visitors, 2025 | Visitor spending, 2025 | Rank by spending |
|---|---|---|---|---|
| 1 | United Kingdom | 163,1006 | A$414 million6 | 2 |
| 2 | Singapore | More than 125,0006 | Close to A$280 million6 | 3 |
| 3 | New Zealand | 77,1006 | A$155 million6 | 5 |
| 4 | China (including Hong Kong) | 70,3006 | A$503 million6 | 1 |
| 5 | Malaysia | 60,2006 | A$98 million6 | 10 |
| 6 | India | 50,0006 | A$84 million6 | 12 |
| 7 | United States | 48,4006 | A$97 million6 | 11 |
| 8 | Indonesia | 43,7006 | A$140 million6 | 6 |
| 10 | Japan | 34,0006 | A$158 million6 | 4 |
Source · Data source: Tourism Western Australia Annual Report 2025–26 (based on Tourism Research Australia's International Visitor Survey).
When is the best time to visit Western Australia?
The best time to visit depends on where you go. The Kimberley and the North West are at their best in the winter dry season, from April to September, when daytime temperatures reach about 29°C16. The green season, from October to March, brings high humidity, temperatures in the high 30s and fewer crowds. Perth and the South West are year-round destinations: Perth averages about 29°C in summer and 12°C in winter.
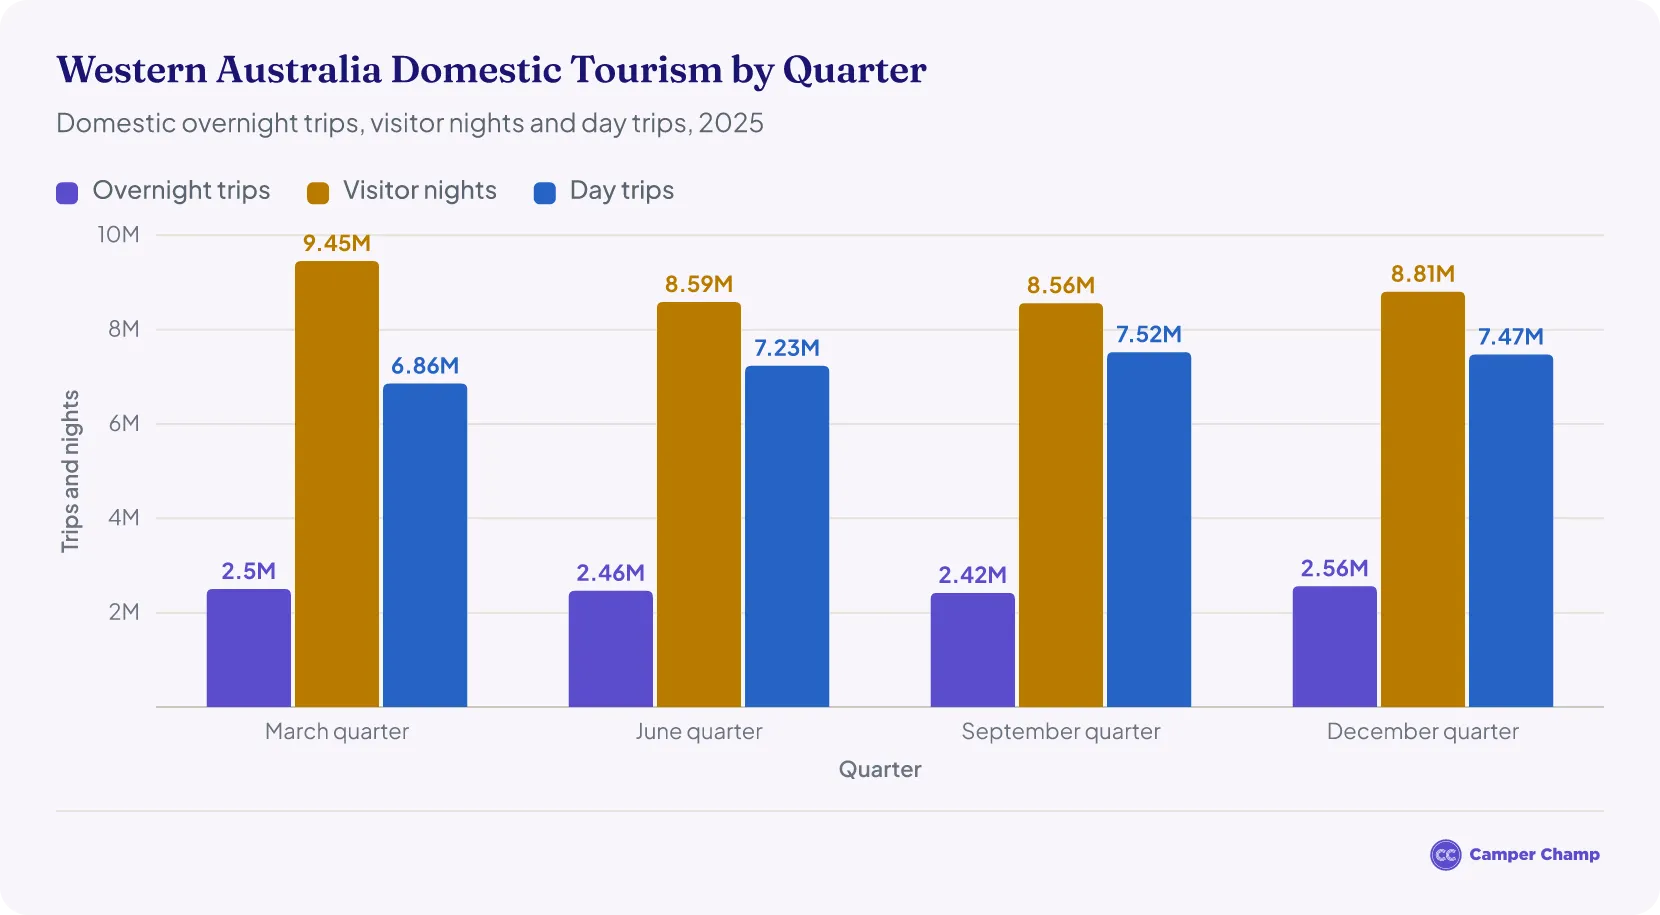
Visitor numbers are spread fairly evenly through the year. Australians made the most overnight trips to the state in the December quarter of 2025, about 2.56 million1, but spent the most nights there in the March quarter, about 9.45 million. The September quarter was the quietest for overnight trips, with 2.42 million.
- Day trips peaked in the September quarter, at about 7.52 million1.
- Overseas visitors arrive in the largest numbers in December: about 102,210 planned to stay mainly in Western Australia in December 202517, the busiest month of the year.
- Planning a trip? See our 7-day Perth round-trip campervan itinerary.
What are the most visited regions in Western Australia?
Perth is by far the most visited region in Western Australia, with about 6.13 million domestic overnight trips7 and about 1.01 million international visitors2. Interstate visitors made about 1.02 million of those domestic trips7.
- Outside Perth, Australia's South West drew the most domestic overnight visitors, about 2.76 million18, followed by Australia's Coral Coast (826,000)19, Australia's Golden Outback (684,000)20 and Australia's North West (491,000)21.
- The South West also drew the most international visitors of any regional area, about 150,000 in 202518, and domestic overnight visitors spent about A$2.30 billion there.
- These regional figures come from Tourism Western Australia's 2025 overnight visitor factsheets, based on Tourism Research Australia's surveys. International figures are also for 2025, and day trips are not published by region.
| Rank | Region | Domestic overnight trips | Domestic visitor nights | Domestic overnight spending | International visitors | International visitor spending |
|---|---|---|---|---|---|---|
| 1 | Destination Perth | 6.13 million7 | 19.38 million | A$6.77 billion | 1.01 million7 | A$2.98 billion |
| 2 | Australia's South West | 2.76 million18 | 8.32 million | A$2.30 billion | 150,00018 | A$193 million |
| 3 | Australia's Coral Coast | 826,00019 | 2.87 million | A$581 million | 73,00019 | A$78 million |
| 4 | Australia's Golden Outback | 684,00020 | 2.25 million | A$546 million | 52,00020 | A$67 million |
| 5 | Australia's North West | 491,00021 | 2.47 million | A$948 million | 48,00021 | A$84 million |
Source · Data source: Tourism Western Australia, Overnight Visitor Factsheets 2025 (Tourism Research Australia Domestic Tourism Statistics and International Visitor Survey).
What are the most visited tourist attractions in Western Australia?
Kings Park and Botanic Garden in Perth is Western Australia's most visited attraction, with about 5.11 million visitors in 2025–2622. The Western Australian Museum's sites and programs drew about 1.52 million visitors23, and about 890,000 people took the ferry24 to Rottnest Island.
- Perth Zoo welcomed 729,513 visitors, down 22% after a record year of free entry25, and the Art Gallery of Western Australia had 402,90826.
- In the South West, the Capes Foundation's eight attractions, including four Margaret River caves, drew 578,064 visitors27, and Busselton Jetty set a record with 411,478 paid visitors28.
- Fremantle Prison had 210,672 visitors in 2024–2529, the latest year published.
- There were 26.16 million visits30 to the state's national parks and other Parks and Wildlife Service land and waters in 2025–26, up 5%.
- Each figure is the attraction's own count for 2025–26 unless stated. Some count visitors, others ferry arrivals or paid admissions, so treat the ranking as a guide.
| Rank | Attraction | Location | Visitors, 2025–26 | What is counted |
|---|---|---|---|---|
| 1 | Kings Park and Botanic Garden | Perth | 5.11 million22 | Visitors, estimated from vehicle counts and pedestrian access |
| 2 | Western Australian Museum | Perth and regional sites | 1,519,12323 | Visitors to museum sites, other sites and outreach programs |
| 3 | Rottnest Island | Rottnest Island | 890,06124 | Visitors arriving by ferry |
| 4 | Perth Zoo | Perth | 729,51325 | Visitors |
| 5 | Capes Foundation attractions | Margaret River region | 578,06427 | Visitors to eight sites, including four caves and two lighthouses |
| 6 | Busselton Jetty | Busselton | 411,47828 | Paid visitors |
| 7 | Art Gallery of Western Australia | Perth | 402,90826 | Visitors, including people attending functions and events |
| 8 | Fremantle Prison | Fremantle | 210,67229 | Visitors (2024–25) |
Source · Data source: 2025–26 annual reports of the Botanic Gardens and Parks Authority, Western Australian Museum, Rottnest Island Authority, Zoological Parks Authority, Margaret River Busselton Tourism Association, Busselton Jetty and Art Gallery of Western Australia; Department of Planning, Lands and Heritage 2024–25 annual report (Fremantle Prison).
How many tourists visit Perth each year?
- Destination Perth had about 6.13 million domestic overnight trips in 2025: 5.11 million by Western Australians and 1.02 million by interstate visitors7. Domestic overnight visitors spent about A$6.77 billion there.
- About 1.01 million international visitors stayed in Perth in 2025, spending about A$2.98 billion over 35.6 million nights2.
- The United Kingdom and Singapore are Perth's biggest overseas markets, at 14% and 13% of its international visitors7.
- Read more: Perth Tourism Statistics
How many tourists visit Margaret River each year?
The Margaret River region had about 1.39 million domestic overnight trips in 202531. Domestic visitors spent about A$1.05 billion and 4.07 million nights there. About 102,000 international visitors stayed in the region in 2025, spending about A$85 million over 712,000 nights.
- The Capes Foundation's caves, lighthouses and other attractions near Margaret River drew 578,064 visitors in 2025–2627.
How many tourists visit Broome and Ningaloo each year?
- The Shire of Broome had about 130,000 domestic overnight trips in 202532. Domestic visitors spent about A$148 million and 532,000 nights there.
- The Ningaloo and Shark Bay region, which takes in Exmouth, Carnarvon and Shark Bay, had about 182,000 domestic overnight trips, 866,000 nights and A$157 million in domestic visitor spending33.
- Read more: Broome Tourism Statistics
How many people camp in Western Australia?
Australians took about 1.79 million caravan and camping trips in Western Australia in 2024, down 9%34, and spent about 7.02 million nights there, down 12%. That is an average of about 3.9 nights per trip.
- Caravan parks in Western Australia earned about A$476 million, up 8% on 202334.
- Western Australia had 123,39034 registered caravans and campervans, the fourth most of any state, behind Queensland, New South Wales and Victoria.
- Caravan and camping trips peak in the March quarter, with a second busy period in the June quarter34, because the state's regions have different peak seasons.
- Caravan and camping figures are for 2024, the latest year in the Caravan Industry Association's public State of Industry report. See also our Australia camping statistics.
Where do people camp in Western Australia?
Australia's South West is Western Australia's busiest caravan and camping region and the third busiest in Australia34. Australians took about 787,650 caravan and camping trips there in 2024, up 5%, and spent 2.65 million nights.
- It is the only Western Australian region in Australia's top 10 for caravan and camping34, and it accounted for about 44% of the state's 1.79 million caravan and camping trips.
- Online campsite bookings in the state's national parks and other Parks and Wildlife Service areas rose from about 57,000 in 2018–19 to 154,000 in 2023–2435.
- Campers in Western Australia's national and conservation parks stay an average of 3.6 nights, and their satisfaction averaged 86.8%35 in a 2025 survey.
Campervan hire in Australia
FAQs
Is tourism in Western Australia back to pre-COVID levels?
Yes. About 1.07 million international visitors came to Western Australia in 20252, about 7% above the 996,000 of 201910, and it was the only state or territory where international visitor numbers were back above their 2019 level6. Domestic overnight trips were also higher, at 9.95 million in 20251 against 8.79 million in 20199.
How does Western Australia compare with other states for tourism?
Western Australia is the fourth-biggest state for domestic overnight trips5, behind New South Wales, Victoria and Queensland. Its domestic overnight visitors spend more per trip, about A$1,125, than in any state or territory except the Northern Territory, and interstate visitors stay longer than in any other state, 6.3 nights on average.
How much do visitors spend per trip in Western Australia?
Domestic overnight visitors spent about A$1,125 per trip in Western Australia in 2025, or about A$316 per night5.
What is the most visited place in Western Australia?
Perth, with about 6.13 million domestic overnight trips7 and 1.01 million international visitors in 20252. Outside the city, Australia's South West is the most visited region, with about 2.76 million domestic overnight trips18. Kings Park and Botanic Garden is the most visited attraction, with about 5.11 million visitors in 2025–2622.
What is the busiest month for tourists in Western Australia?
December was the busiest month for overseas visitors in 2025, with about 102,210 arrivals planning to stay mainly in Western Australia17, and February has been the busiest month of 2026 so far, with 95,790. Australians made the most overnight trips in the December quarter of 2025, about 2.56 million1.
More tourism statistics
- Australia Tourism Statistics
- Byron Bay Tourism Statistics
- Cairns Tourism Statistics
- Esperance Tourism Statistics
- Great Barrier Reef Tourism Statistics
- New South Wales Tourism Statistics
- Noosa Tourism Statistics
- Queensland Tourism Statistics
- Sunshine Coast Tourism Statistics
- Sydney Tourism Statistics
- Victoria Tourism Statistics
- Warner Bros. Movie World Tourism Statistics
References
- Domestic Tourism Statistics results — December quarter 2025 (Tourism Research Australia) · Tourism Research Australia ↑ b c d e f g h i j k l
- International tourism results — year ending December 2025 (International Visitor Survey) · Tourism Research Australia ↑ b c d e f g h i j k l m n o p q r s t u
- International tourism results — year ending June 2026 (International Visitor Survey) · Tourism Research Australia ↑ b c
- Domestic Tourism Statistics results — June quarter 2026 compared to June quarter 2025 (Tourism Research Australia) · Tourism Research Australia ↑ b c d e f g h
- Domestic Tourism Statistics Snapshot, year ending December 2025 (Tourism and Events Queensland) · teq.queensland.com ↑ b c d e f g h i j k l m n o p q r s t u
- Tourism Western Australia Annual Report 2025–26 · assets-us-01.kc-usercontent.com ↑ b c d e f g h i j k l m n o p q r s t u v w x y z a2
- Destination Perth Overnight Visitor Factsheet 2025 (revised) (Tourism WA) · tourism.wa.gov.au ↑ b c d e f g h i
- State and Regional Tourism Satellite Accounts 2024–25 · Tourism Research Australia ↑ b c d e
- Tourism Research Australia — Domestic Tourism Statistics: 2019–2024 overnight backcast data (revised) · Tourism Research Australia ↑ b c d e f g h i j k l m n o p q
- IVS results for the year ending December 2024 compared to December 2019 · Tourism Research Australia ↑ b c d e f
- IVS results for the year ending December 2024 compared to December 2023 · Tourism Research Australia ↑ b
- International Visitor Survey tourism results — year ending December 2022 compared with 2021 (Tourism Research Australia) · Tourism Research Australia ↑
- International Visitor Survey tourism results — year ending December 2021 compared with 2020 (Tourism Research Australia) · Tourism Research Australia ↑ b
- International tourism results — March quarter 2026 (International Visitor Survey) · Tourism Research Australia ↑ b
- Tourism Western Australia Visitor Statistics · tourism.wa.gov.au ↑ b c d
- WA weather — Tourism Western Australia · westernaustralia.com ↑
- Overseas Arrivals and Departures, Australia, August 2026 — Table 11: Short-term visitors arriving, state of intended stay (ABS) · Australian Bureau of Statistics ↑ b
- Australia's South West Overnight Visitor Factsheet 2025 (Tourism Western Australia) · assets-us-01.kc-usercontent.com ↑ b c d e
- Australia's Coral Coast Overnight Visitor Factsheet 2025 (Tourism Western Australia) · assets-us-01.kc-usercontent.com ↑ b c
- Australia's Golden Outback Overnight Visitor Factsheet 2025 (Tourism Western Australia) · assets-us-01.kc-usercontent.com ↑ b c
- Australia's North West Overnight Visitor Factsheet 2025 (revised) — Tourism WA · assets-us-01.kc-usercontent.com ↑ b c
- Botanic Gardens and Parks Authority Annual Report 2025–2026 · library.dbca.wa.gov.au ↑ b c
- Western Australian Museum Annual Report 2025–26 · visit.museum.wa.gov.au ↑ b
- Rottnest Island Authority Annual Report 2025–26 · ria.wa.gov.au ↑ b
- Zoological Parks Authority 2026 Annual Report (Perth Zoo) · library.dbca.wa.gov.au ↑ b
- Art Gallery of Western Australia Annual Report 2025–26 · artgallery.wa.gov.au ↑ b
- Margaret River Busselton Tourism Association Annual Report 2025/26 · mrbta.com ↑ b c
- Busselton Jetty Inc. Annual Report 2025/2026 · busseltonjetty.com.au ↑ b
- Department of Planning, Lands and Heritage Annual Report 2024–25 · wa.gov.au ↑ b
- Department of Biodiversity, Conservation and Attractions Annual Report 2025–26 · dbca.wa.gov.au ↑
- The Margaret River Region Overnight Visitor Factsheet 2025 (Tourism Western Australia) · assets-us-01.kc-usercontent.com ↑
- Overnight Visitor Factsheet 2025 — Shire of Broome · assets-us-01.kc-usercontent.com ↑
- Ningaloo & Shark Bay Overnight Visitor Factsheet 2025 (Tourism Western Australia) · assets-us-01.kc-usercontent.com ↑
- Caravan and Camping State of Industry 2025 (Caravan Industry Association of Australia) · assets.pc.gov.au ↑ b c d e f
- The WA camping experience: satisfaction, spending and future intentions (2025) — Parks and Wildlife Service, DBCA Western Australia · library.dbca.wa.gov.au ↑ b
- TRA — International tourism results, Australia, March 2024 · Tourism Research Australia