

Updated
At a glance
- About 5.76 million overnight visitors came to the Gold Coast in 2025: 5.08 million domestic1 and 682,000 international2.
- In the year ending June 2026, the Gold Coast had 5.1 million domestic overnight visitors3 and 656,000 international visitors, up 3.1% on a year earlier4.
- Including 8.9 million domestic day-trippers, the Gold Coast had 14.7 million visitors in the year ending June 2026, worth A$8.5 billion to the local economy3.
- New Zealand is the largest international market, with 219,000 visitors in the year ending June 20264.
- About 6.5 million passengers used Gold Coast Airport in the year ending June 20265.
How many tourists visit the Gold Coast each year?
About 14.7 million people visit the Gold Coast each year, including day-trippers3. In the year ending June 2026 there were 8.9 million domestic day-trippers, 5.1 million domestic overnight visitors and 656,000 international visitors4.
Counting overnight stays only, about 5.76 million visitors travelled to the Gold Coast in 202521.
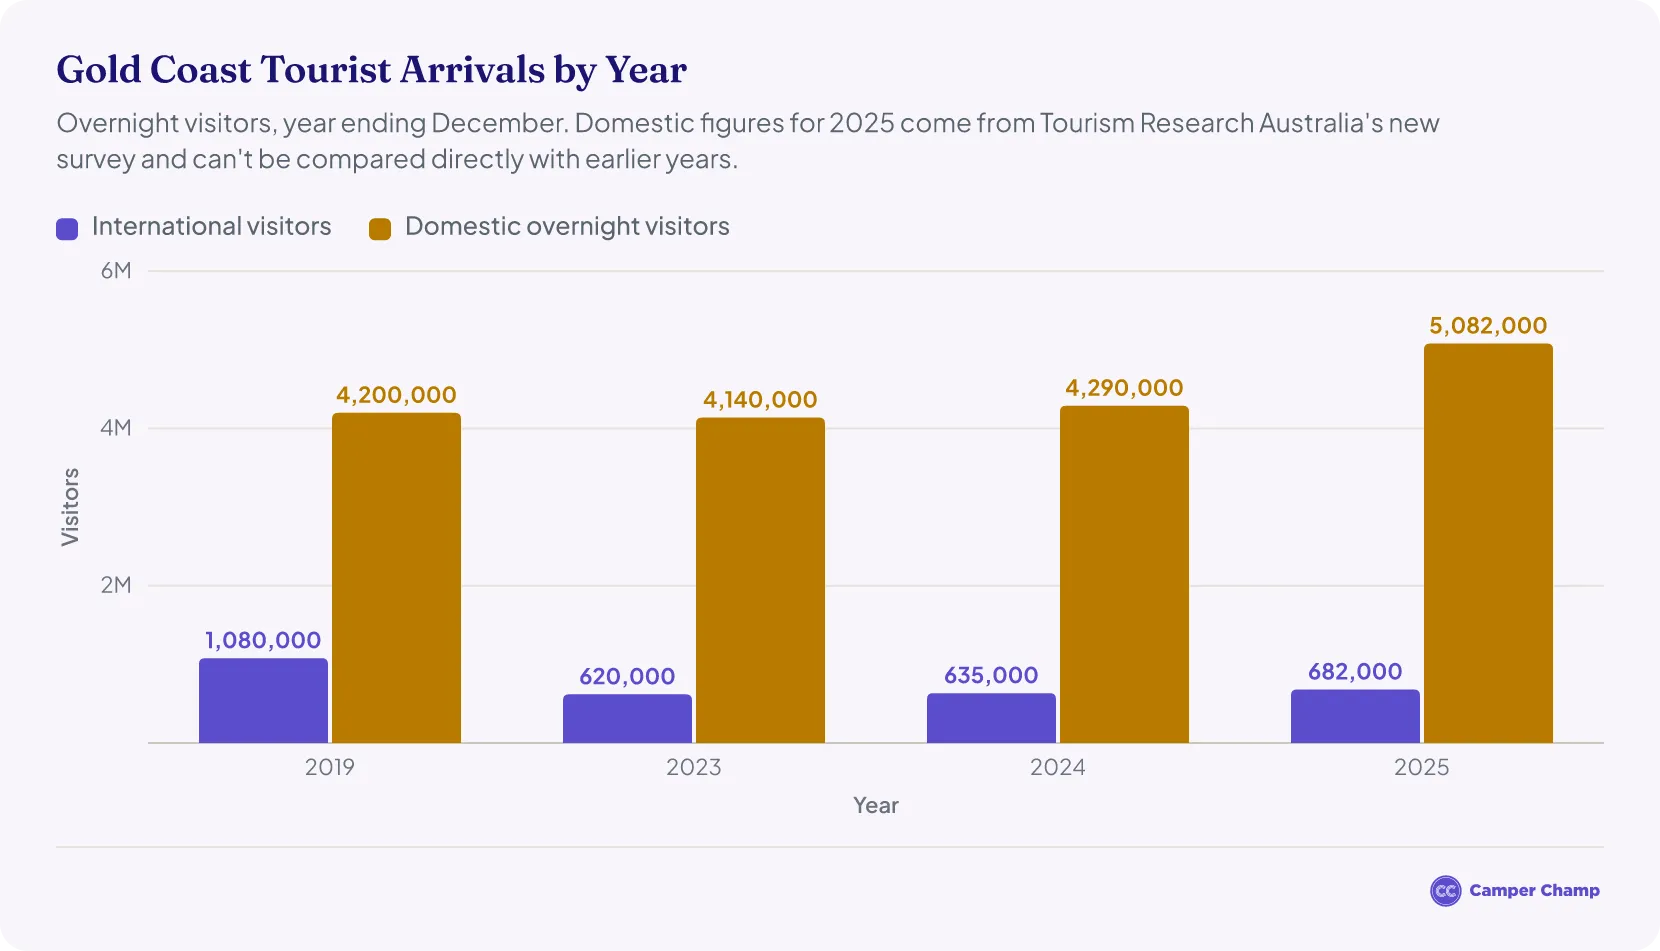
| Overnight visitors to the Gold Coast by year | |||
|---|---|---|---|
| Year (ending December) | International | Domestic | Total |
| 2025 | 682,0002 | 5.08 million1 | 5.76 million21 |
| 2024 | 635,0002 | 4.29 million7 | 4.93 million27 |
| 2023 | 620,0008 | 4.14 million7 | 4.76 million87 |
| 2019 | 1.08 million6 | 4.20 million9 | 5.28 million69 |
How many tourists have visited the Gold Coast in 2026?
The Gold Coast welcomed about 5.1 million domestic overnight visitors in the year ending June 2026, who spent over A$5.4 billion3. A further 656,000 international visitors came, up 3.1% on a year earlier, and they spent about A$1.45 billion, up 11.5%4.
- Including day trips, visitors contributed A$8.5 billion to the local economy in the year ending June 20263.
- The Gold Coast was Australia's fifth-largest domestic overnight visitor economy, behind Sydney, Melbourne, Brisbane and Perth3.
- About 3 million domestic overnight visitors came from elsewhere in Queensland and 2.2 million from interstate3.
- International visitors stayed 14.7 nights on average and spent about A$150 a night, up 6.4%4.
- New Zealand remained the largest international market, with 219,000 visitors4. Other major markets were China (79,000), the UK (63,000), the USA (33,000) and Japan (30,000).
- Holiday visitors rose 3.4% to 455,000, and those visiting friends and relatives rose 7.4% to 156,0004.
- Domestic figures now come from Tourism Research Australia's Domestic Tourism Statistics, which replaced the National Visitor Survey in 2025, so they can't be compared directly with 2024 or earlier3. No total for January–June 2026 has been published yet; the year ending June 2026 is the latest period available.
| Overnight visitor spending on the Gold Coast | ||
|---|---|---|
| Year | International | Domestic |
| 2019 | A$1.34 B | A$3.69 B |
| 2023 | A$1.13 B | A$5.48 B |
| 2024 | A$1.17 B | A$5.76 B |
| 2025 | A$1.48 B | A$5.99 B |
How has Gold Coast tourism changed since 2019?
Before the pandemic, about 5.22 million overnight visitors came to the Gold Coast in the year ending June 201910: 4.17 million domestic11 and 1.05 million international10. Together they spent about A$5.14 billion.
- 2020: Overnight visitors fell 26.7% to 3.83 million in the year ending June 202010, made up of 3.09 million domestic11 and 734,000 international visitors10. Their spending fell 27.7% to A$3.72 billion.
- 2021–22: Domestic overnight visitors rose 21.7%, from more than 3 million in the year ending September 2021 to more than 3.7 million in the year ending September 202212. Their spending rose 50% to more than A$4.2 billion. No international figures were published for these periods.
Gold Coast International Tourism Statistics
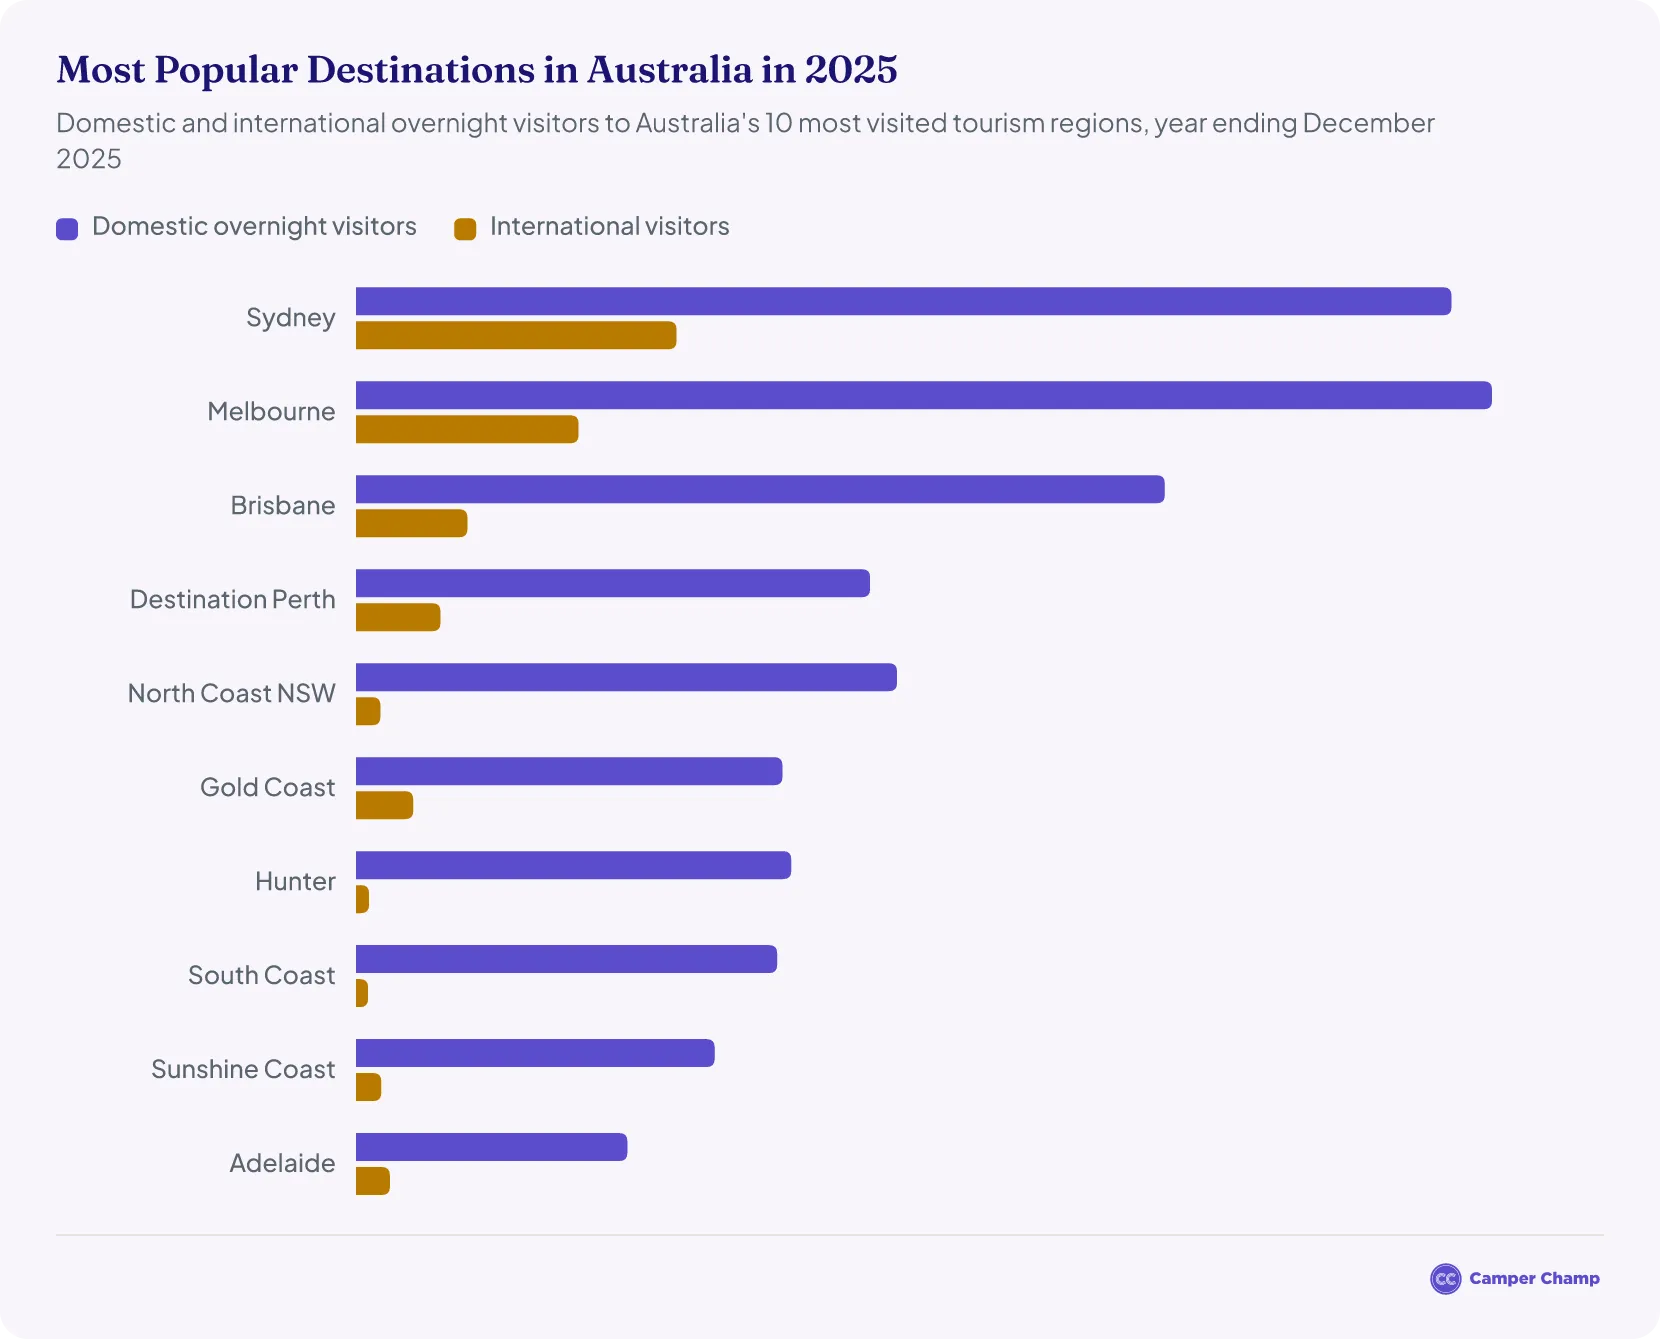
- The Gold Coast drew about 682,000 international visitors in 2025, the 5th most of any Australian tourism region2.
- At A$1.48 billion, the Gold Coast ranked 6th for spending by international tourists in 2025, behind Sydney, Melbourne, Brisbane, Perth and Adelaide2.
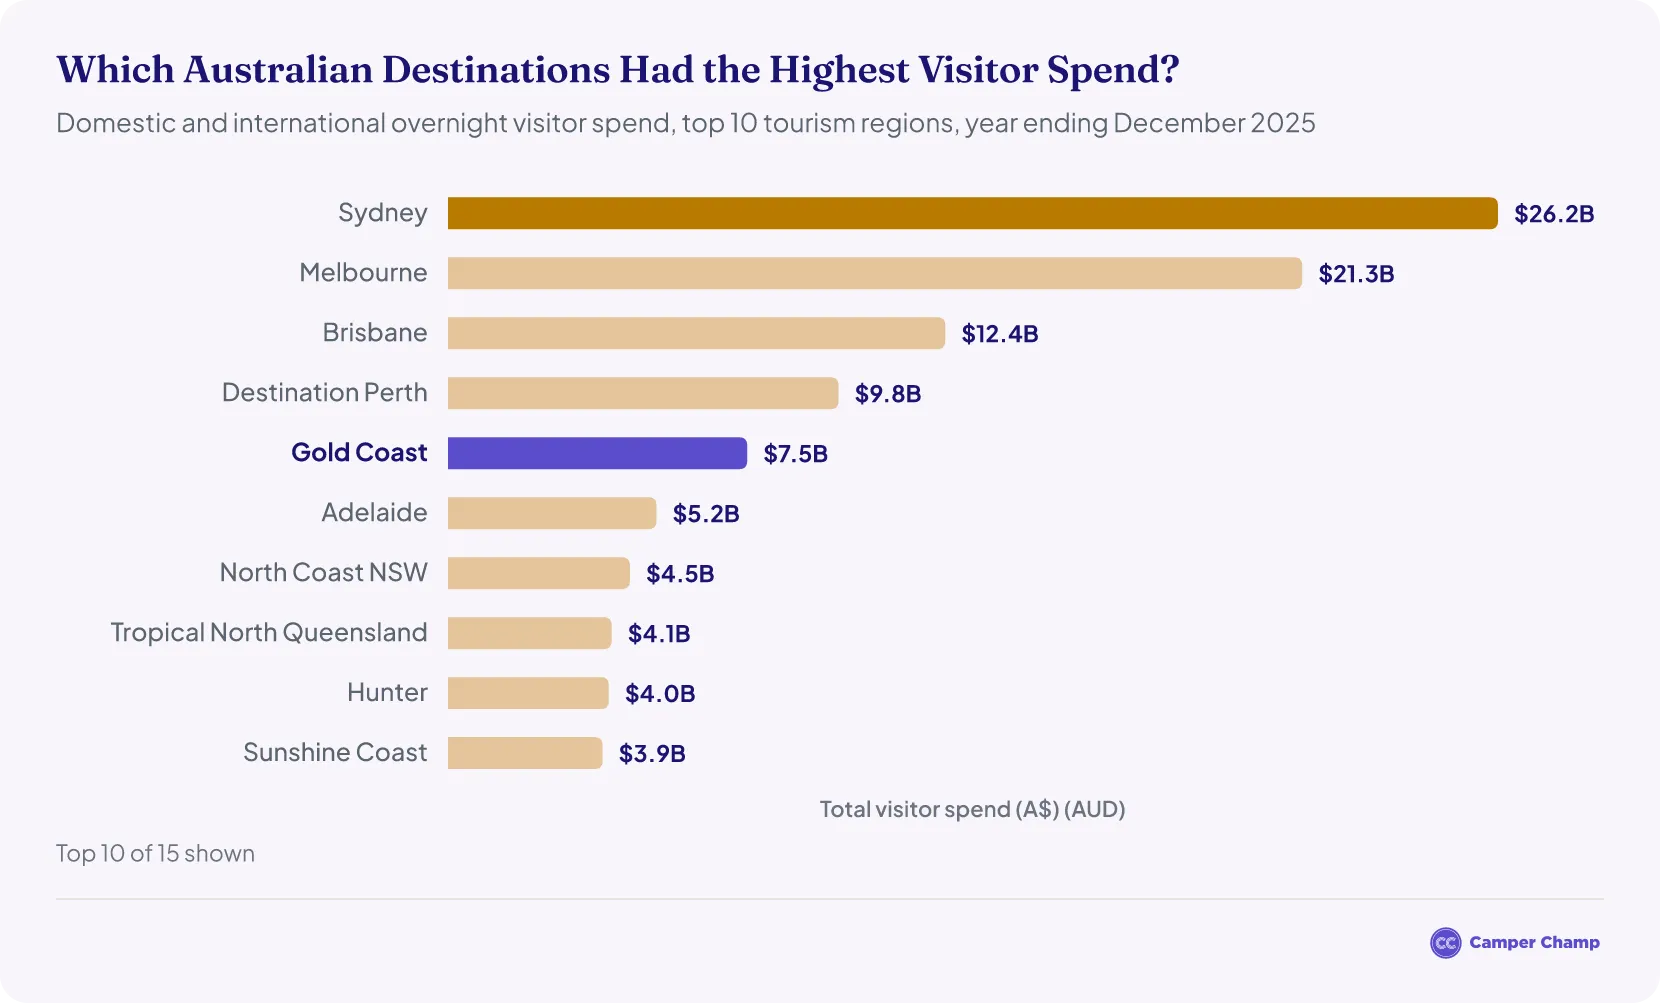
Why do international tourists spend less on the Gold Coast than other Australian destinations?
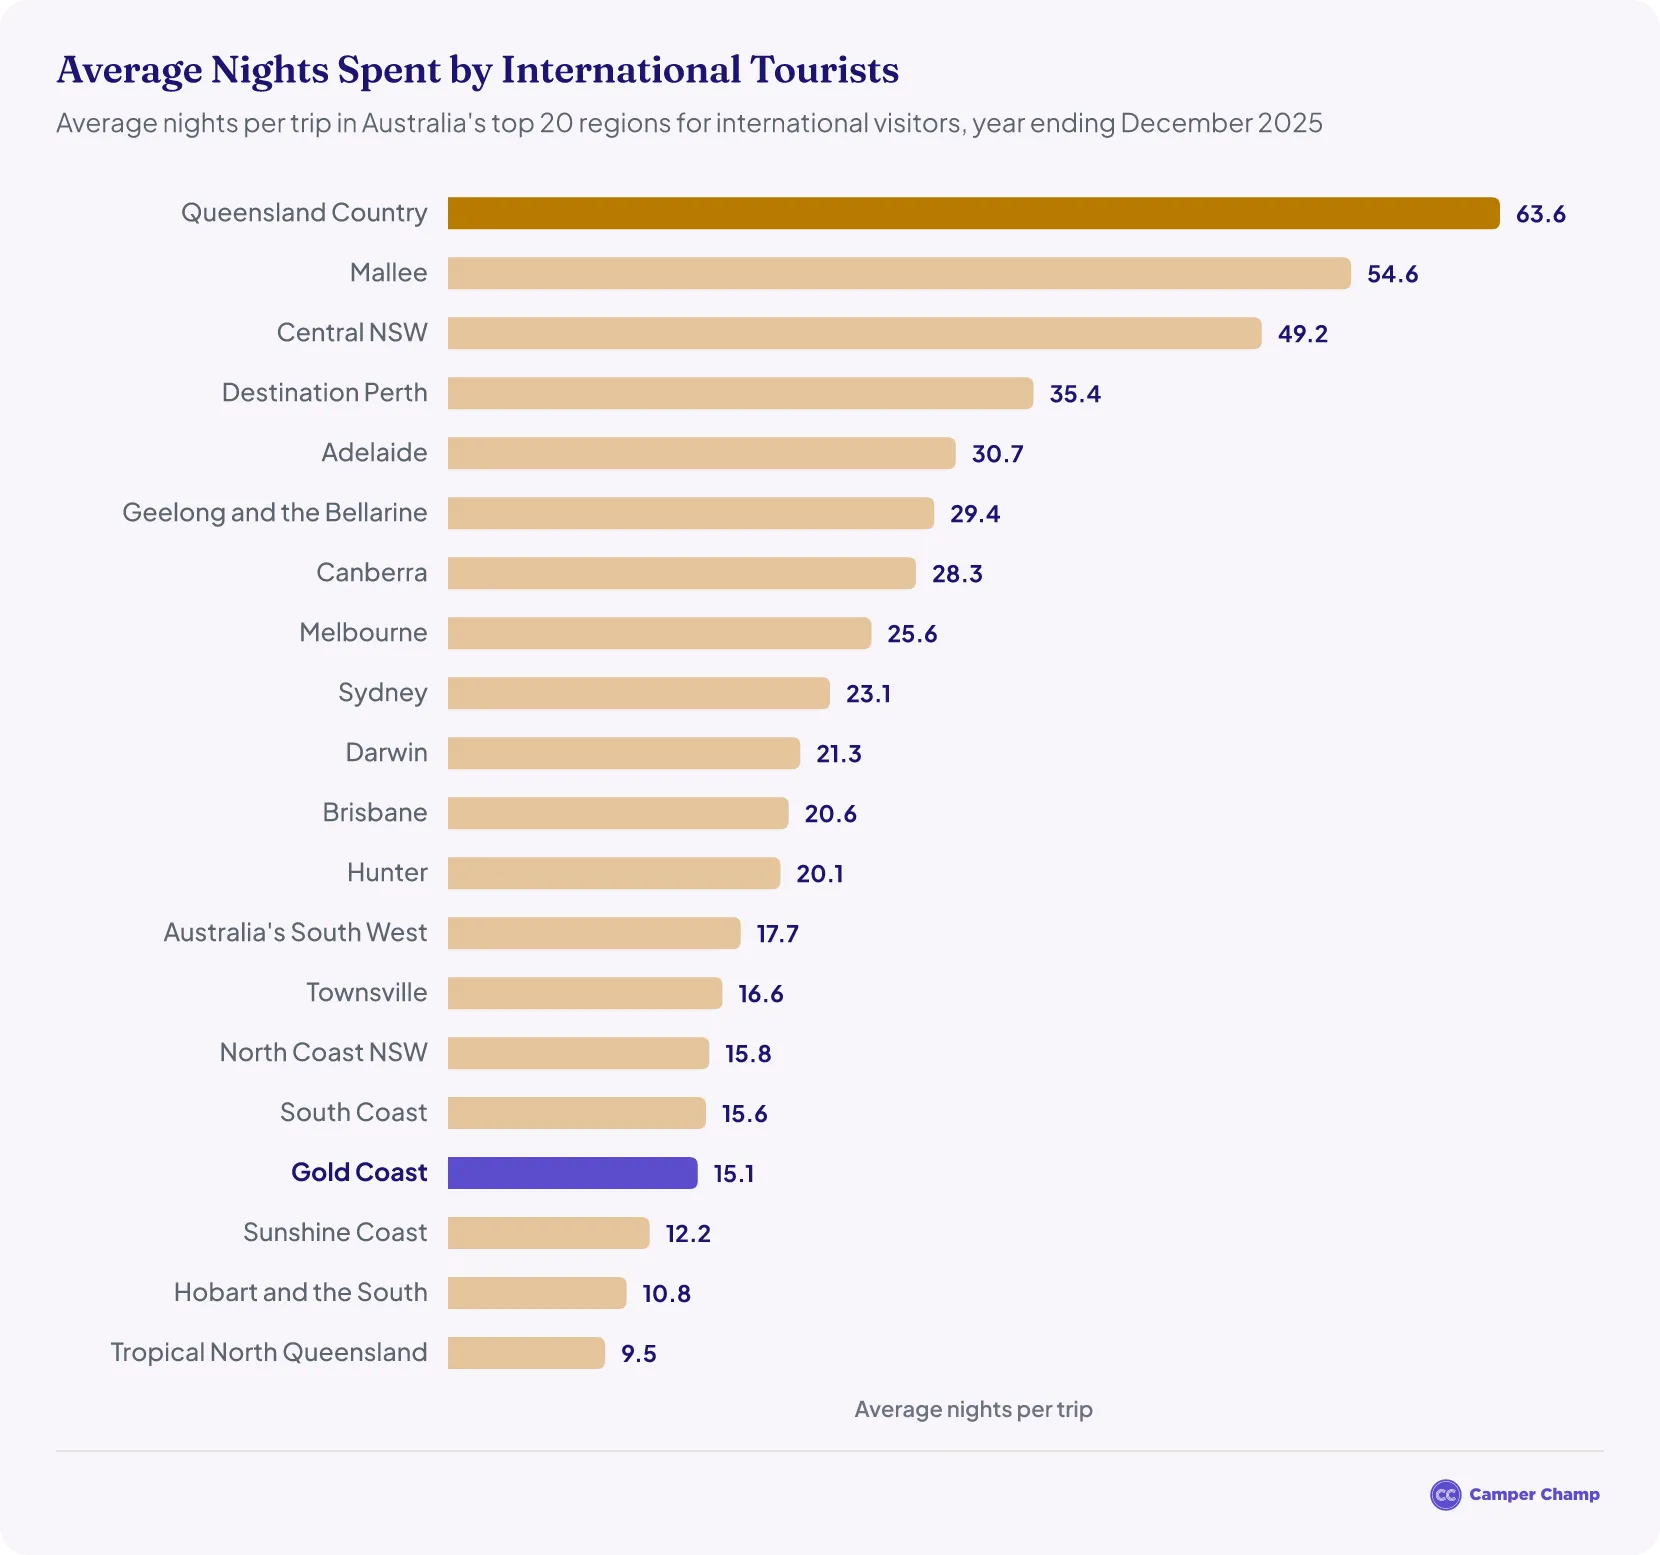
- International tourists stayed on the Gold Coast for an average of 15.1 nights in 20252.
- That is shorter than in any mainland capital city, where international visitors stayed between 20.6 nights (Brisbane) and 35.4 nights (Perth) on average2.
- Shorter stays mean international visitors spend less in total.
How much do international tourists spend per night on the Gold Coast?
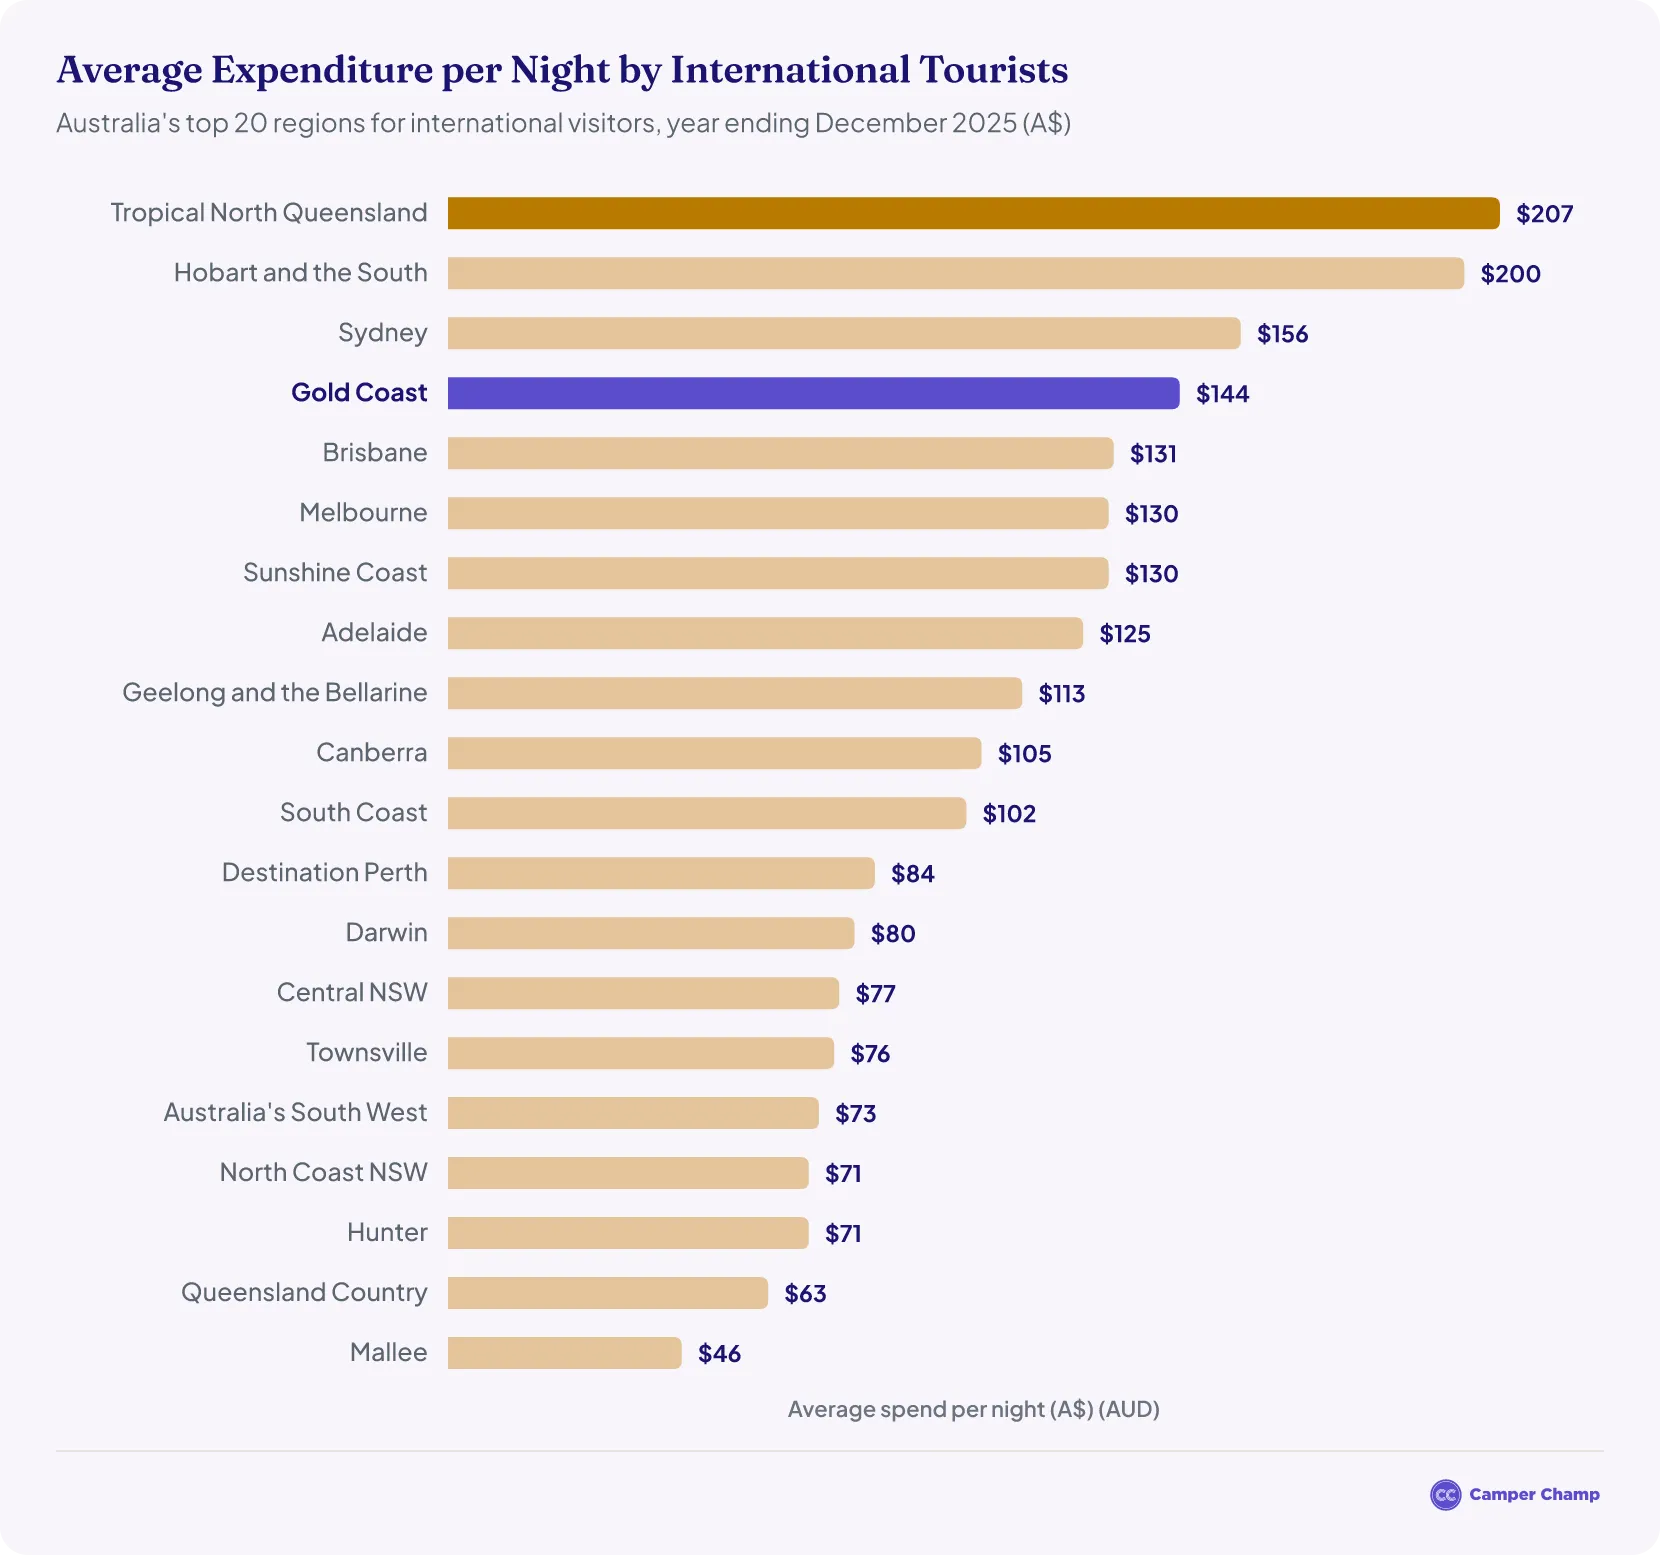
- The Gold Coast ranked 4th for spend per night by international visitors in 2025, at about A$144 a night, behind Tropical North Queensland (A$207), Hobart and the South (A$200) and Sydney (A$156)2.
- Visitors spend more each night, but the higher nightly cost may also help explain why they stay for a shorter time.
Where do most Gold Coast tourists come from?
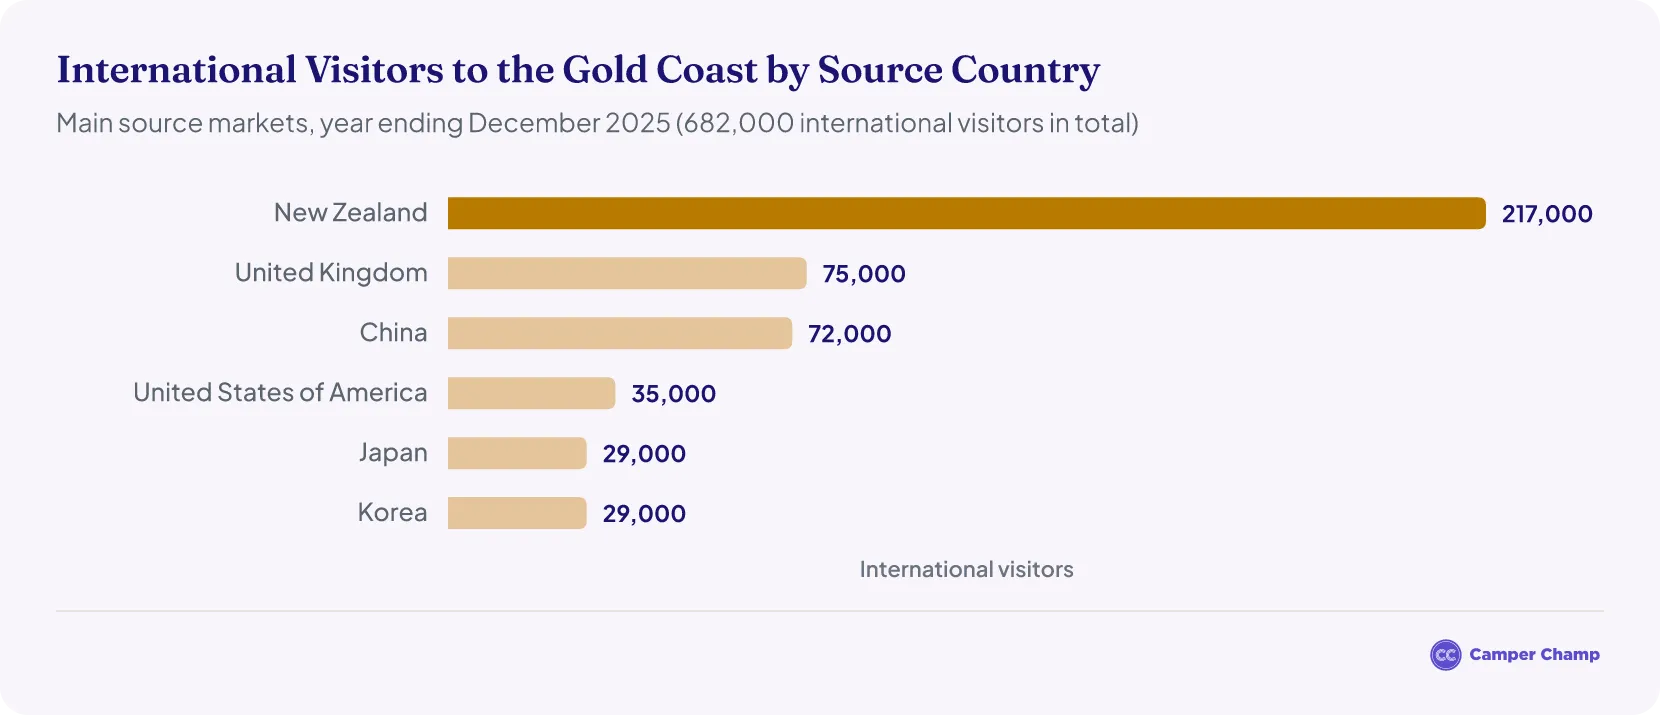
- New Zealand was the top source country for the Gold Coast in 2025, with 217,000 visitors or about a third (32%) of all international visitors, followed by the United Kingdom (75,000) and China (72,000).13
- Visitors from the UK rose 43.3% and from China 37.3% on 2024, while visitors from New Zealand fell 2.4%. The USA (35,000), Japan (29,000) and South Korea (29,000) were the next largest markets.13
Campervan hire in Australia
- Adelaide motorhome hire
- Alice Springs campervan rental
- Cairns motorhome hire
- Campervan hire in Brisbane
- Campervan hire in Broome
- Campervan hire in Melbourne
- Darwin
- Devonport motorhome hire
- Gold Coast motorhome hire
- Hobart
- Launceston motorhome hire
- Perth motorhome hire
- Sydney motorhome hire
- Tasmania
Gold Coast Domestic Tourism Statistics
How many passengers use Gold Coast Airport?
Gold Coast Airport handled about 6.5 million passengers in 2025–26 (the year ending June 2026), its busiest year on record for trans-Tasman travel5.
How many tourists visit Queensland each year?
About 28.3 million overnight visitors travelled to Queensland in 2025: 25.9 million domestic overnight visitors1 and 2.37 million international visitors2.
- For more, see our Queensland tourism statistics
Queensland and Australian Camping & Campervan Statistics
- Australians took a record 17.3 million caravan and camping trips in 2025, spending 57.9 million nights away, 87% of them in regional Australia.14
- Caravan and camping travellers spent about A$12.6 billion on these trips in 2025.14
- Queensland had the most registered caravans, campervans and motorhomes of any state, with 254,025 recreational vehicles as at January 2025, or 27% of the national fleet.15
- No 2025 caravan and camping trip figures have been published for Queensland or the Gold Coast. For national figures, see our camping statistics.
FAQs
Have Gold Coast visitor numbers returned to 2019 levels?
Not for international visitors. The Gold Coast had 682,000 international visitors in 20252, still well short of the 1.08 million in 20196. Overnight visitors overall reached about 5.76 million in 20251, but the domestic part of that total comes from a new survey, so it can't be compared directly with 2019.
How many tourists visit the Gold Coast per day?
On average, about 40,000 visitors a day. The Gold Coast had 14.7 million visitors, including day-trippers, in the year ending June 20263 (14.7 million ÷ 365).
Is international tourism to the Gold Coast growing?
Yes. In the year ending June 2026, the Gold Coast had 656,000 international visitors, up 3.1% on a year earlier, and they spent about A$1.45 billion, up 11.5%4.
Where do the Gold Coast's tourism statistics come from?
Visitor numbers and spending come from Tourism Research Australia. International figures come from its International Visitor Survey2. Domestic figures came from the National Visitor Survey until 2024; from 2025 they come from Domestic Tourism Statistics, published for the Gold Coast by Tourism and Events Queensland1 and Experience Gold Coast3. Airport figures come from Gold Coast Airport5.
More tourism statistics
- Broome Tourism Statistics
- Byron Bay Tourism Statistics
- Fraser Island Tourism Statistics
- Great Ocean Road Tourism Statistics
- Melbourne Tourism Statistics
- Perth Tourism Statistics
- Queensland Tourism Statistics
- South Australia Tourism Statistics
- Sydney Opera House Tourism Statistics
- Sydney Tourism Statistics
- Tasmania Tourism Statistics
- Warner Bros. Movie World Tourism Statistics
References
- Domestic Tourism Statistics Snapshot, year ending December 2025 (Tourism and Events Queensland) · teq.queensland.com ↑ b c d e f g h i j k l m n
- International tourism results — year ending December 2025 (International Visitor Survey) · Tourism Research Australia ↑ b c d e f g h i j k l m n o p q r
- International Visitor Wave Bolsters Gold Coast Visitor Economy (Experience Gold Coast, 30 September 2026) · corporate.experiencegoldcoast.com ↑ b c d e f g h i j k
- International Tourism Snapshot, year ending June 2026 (Tourism and Events Queensland) · teq.queensland.com ↑ b c d e f g h
- FY26 marks year of significant international growth for GCA (Gold Coast Airport, 30 July 2026) · goldcoastairport.com.au ↑ b c d e f
- IVS results for the year ending December 2024 compared to December 2019 · Tourism Research Australia ↑ b c d e
- NVS results data tables for the year ending December 2024 compared to December 2023 (Tourism Research Australia) · Tourism Research Australia ↑ b c d
- IVS results for the year ending December 2024 compared to December 2023 · Tourism Research Australia ↑ b
- NVS results data tables for the year ending December 2023 compared to December 2019 (Tourism Research Australia) · Tourism Research Australia ↑ b
- International Visitor Survey results — year ending June 2020 (Tourism Research Australia) · Tourism Research Australia ↑ b c d
- National Visitor Survey results — year ending June 2020 (Tourism Research Australia) · Tourism Research Australia ↑ b
- Gold Coast Regional Snapshot, year ending September 2022 (Tourism and Events Queensland) · teq.queensland.com ↑
- International Tourism Snapshot, year ending December 2025 (Tourism and Events Queensland) · teq.queensland.com ↑ b
- Caravan and Camping Data (Tourism Research Australia) · Tourism Research Australia ↑ b
- Australian caravan and camping industry statistics (Caravan Industry Association of Australia, updated 8 September 2026) · caravanindustry.com.au ↑
- TRA — International tourism results, Australia, March 2024 · Tourism Research Australia