Over 7.2 million domestic overnight visitors travelled to Melbourne in 2022 (year ending September 2022).
Domestic visitors were up 78% when compared with the over 4 million from 2021 (year ending September 2021)
Data for international visitors is not yet available for this period
How much did visitors spend in Melbourne in 2022?
Domestic visitors spent over $7.4 billion during trips to Melbourne in 2022 (year ending September 2022).
Spending was up 153% when compared with the over $2.9 billion spent during 2021 (year ending September 2021)
Data for international visitors is not yet available for this period
How many people visited Melbourne in 2021?
For the first quarter of 2021 (January-March), Melbourne received over 1.3 million domestic overnight visitors from both interstate and intrastate sources.
Visitors were down 42.1% when compared with the over 2.2 million visitors of the first quarter of 2020.
How much did visitors spend in Melbourne in 2021?
Overnight visitors spent over $943 million during visits to Melbourne for the first quarter of 2021 (January-March).
Spending was down 51.5% when compared with the over $1.9 billion spent during the first quarter of 2020.
How many tourists visited Melbourne in 2020?
Over 10.4 million visitors travelled to Melbourne in the year ending June 2020.1
This total was made up of 2 million international visitors and over 8.4 million domestic visitors.
Visitors were down 25.1% when compared with the 13.9 million in 2019.
How much did tourists spend in Melbourne in 2020?
Visitors spent over $13.4 billion during trips to Melbourne in the year ending June 2020.
Domestic visitors spent over $7.2 billion while international visitors contributed $6.2 billion.
Spending was down 20.7% when compared with the $16.9 billion spent in 2019.
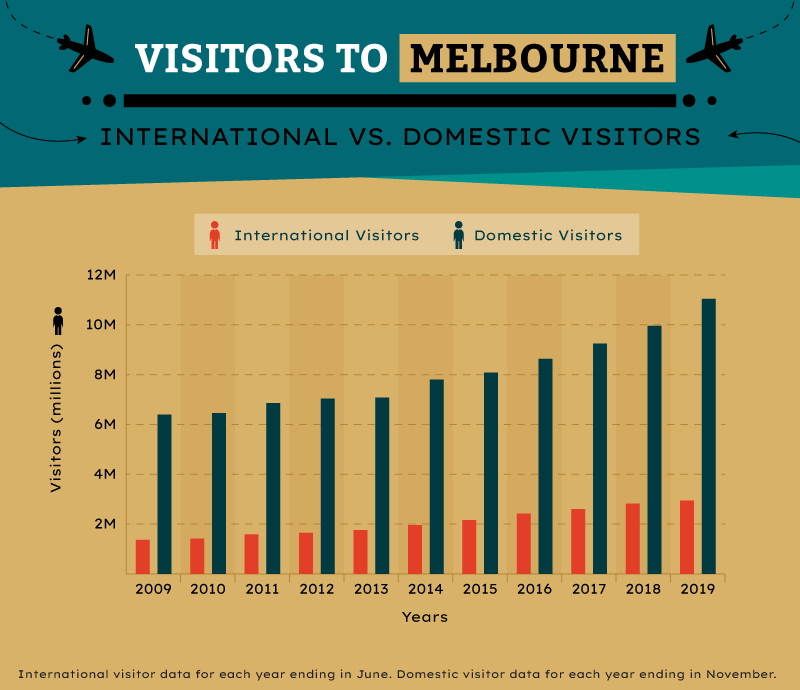
How many tourists visited Melbourne in 2019?
A total of 13,900,000 tourists visited Melbourne from July 2018 to June 2019.1
This total included 2.9 million international tourists and 11 million domestic overnight visitors.
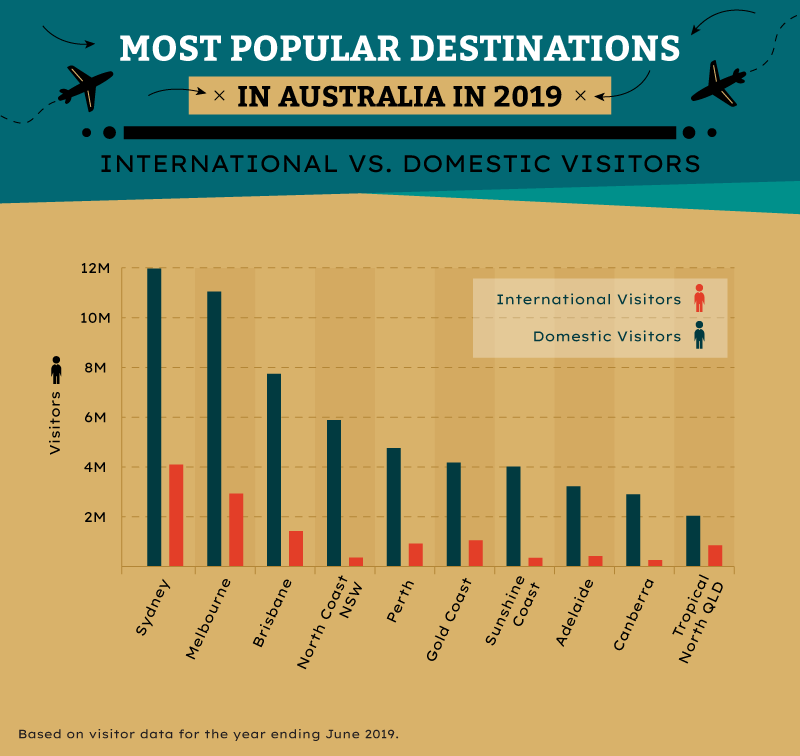
Melbourne was Australia’s 2nd most visited destination in 2019.
Melbourne Visitor Growth Statistics
Between 2009 and 2019, the number of domestic visitors to Melbourne increased by over 70% and the number of international visitors by 114%.
2018/19 saw record numbers, with a 26.5% total growth over the previous year.
The number of camping trips throughout Victoria has grown by 31% over the 10-year period from 2008 to 2018.3
In 2018 over 1.7 million overnight camping trips were made in Victoria.
Camping trips – including caravan, campervan, commercial and non-commercial camping – made up 12.9% of visitor nights for domestic travellers to Victoria in 2019 (year ending September)