

Published 27 May 2025 · Updated 18 Sept 2026
Glamping, where “glamorous” meets “camping,” has become increasingly popular in recent years in Australia. This modern take on camping lets you enjoy nature without sacrificing comfort or style.
How many people go glamping in Australia?
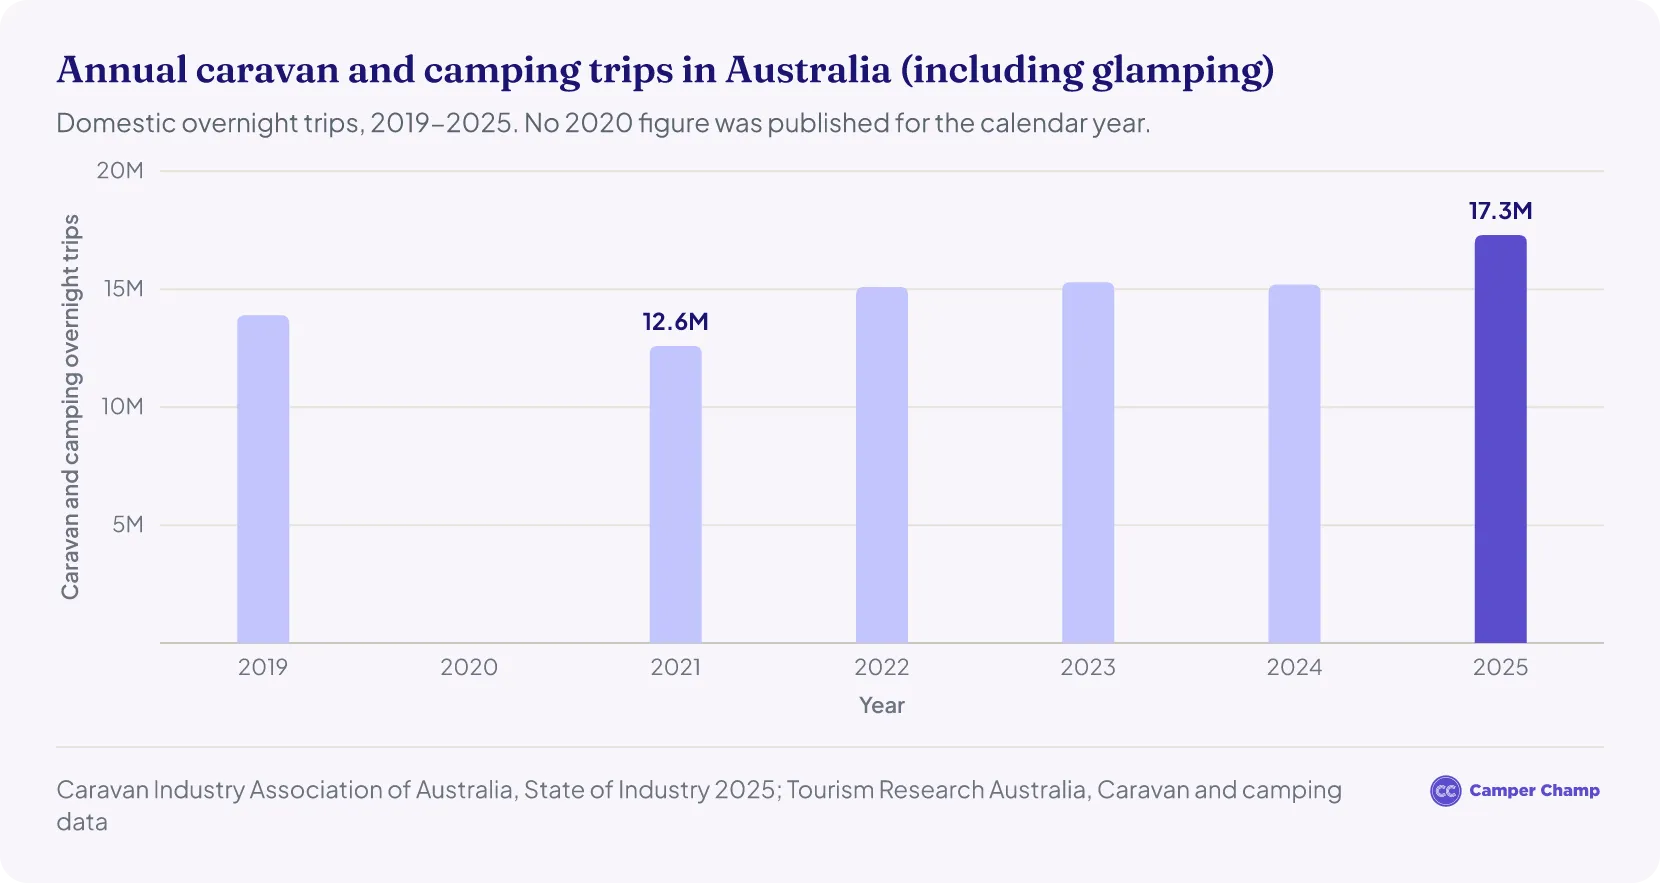
17.3 million caravan and camping trips (including glamping) were taken in 2025, a 14% increase on 2024 and the highest year on record.1
- 13.9 million caravan and camping trips with 58.8 million nights in 2019, the pre-pandemic record.1
- Trips fell sharply in 2020 during the pandemic, then recovered to 12.6 million in 2021.
- 15.1 million trips were recorded in 2022, a 20% increase from 2021, the first year above 15 million.
- 15.3 million trips and 60.7 million nights in 2023, then 15.2 million trips and 57.1 million nights in 2024 as travellers took shorter trips.2
- 17.3 million trips and 57.9 million nights in 2025, with 87% of nights spent in regional Australia.1
Caravan, Camping and Cabin Site Revenue in Australia
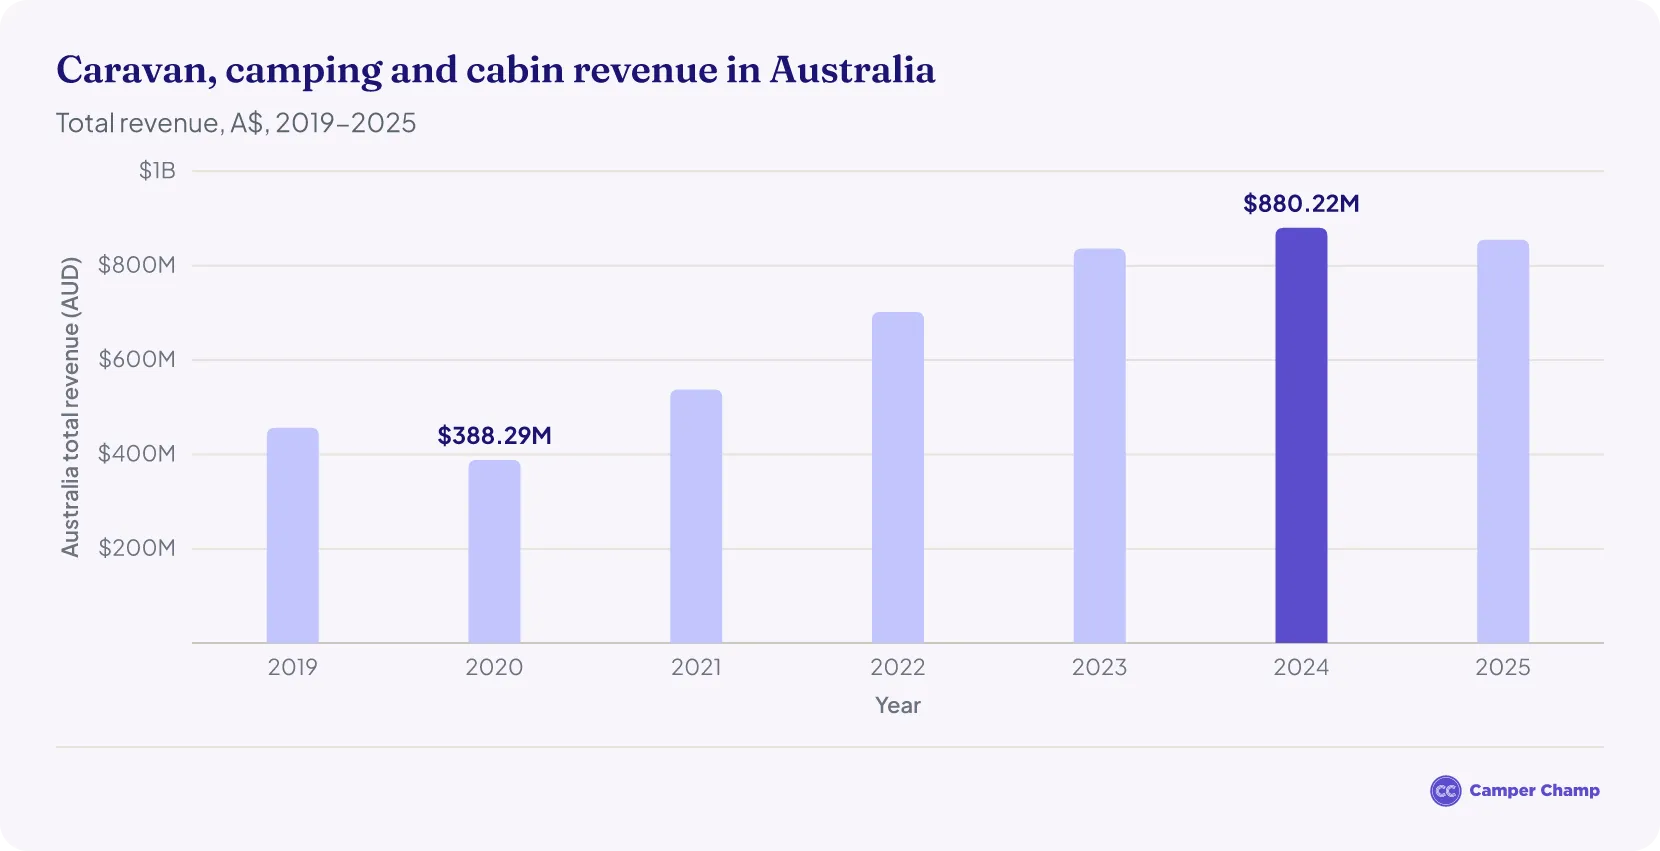
Specific breakdowns for glamping businesses are not available. However, caravan, camping and cabin sites in Australia generated A$855.22 million in 2025, down 2.8% from the record A$880.22 million in 2024.1
- Caravan, camping and cabin sites generated A$456.47 million in 2019 but dropped to A$388.29 million in 2020 (during the pandemic), a 14.9% fall.
- A$537.55 million in 2021, a 38.4% rebound that passed the pre-pandemic level.
- A$701.97 million in 2022 and A$836.19 million in 2023, growth of 30.6% and 19.1%.
- Revenue peaked at A$880.22 million in 2024, then eased 2.8% to A$855.22 million in 2025.1
Caravan, Camping and Cabin Site Revenue by State
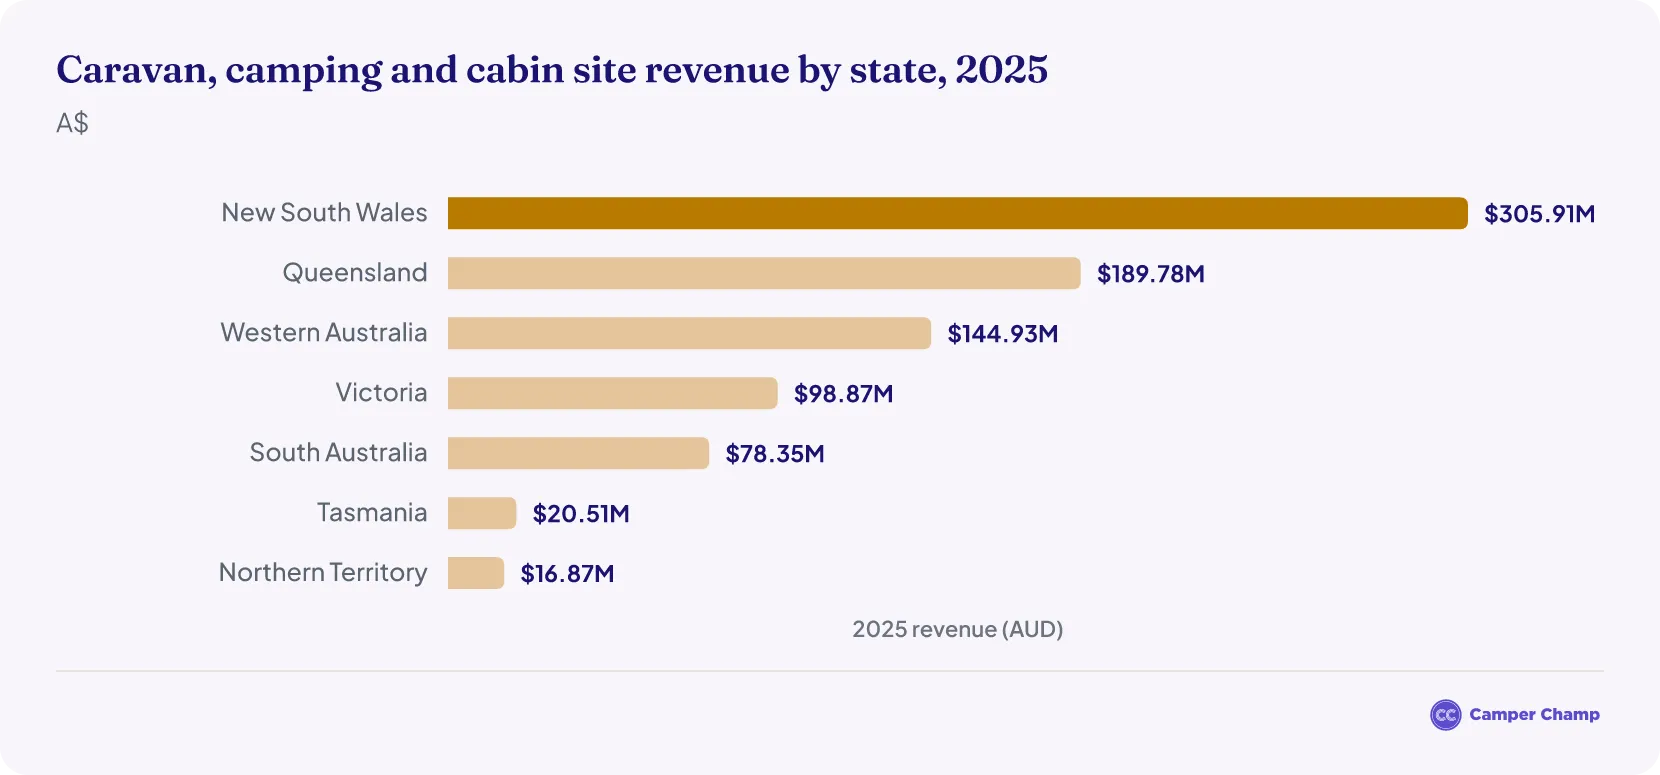
- New South Wales (NSW) leads the country with A$305.91 million in revenue in 2025, about 36% of the national total.1
- Queensland (QLD) was second with A$189.78 million.
- Western Australia (WA) was third with A$144.93 million, with steady growth in coastal and national park accommodation.
- Victoria (VIC) recorded A$98.87 million (popular in the state: regional retreats and eco-lodges).
- South Australia (SA) revenue totalled A$78.35 million.
- Tasmania (TAS): A$20.51 million (high occupancy).
- Northern Territory (NT): A$16.87 million (outback tourism).
How much do people spend while glamping each year?
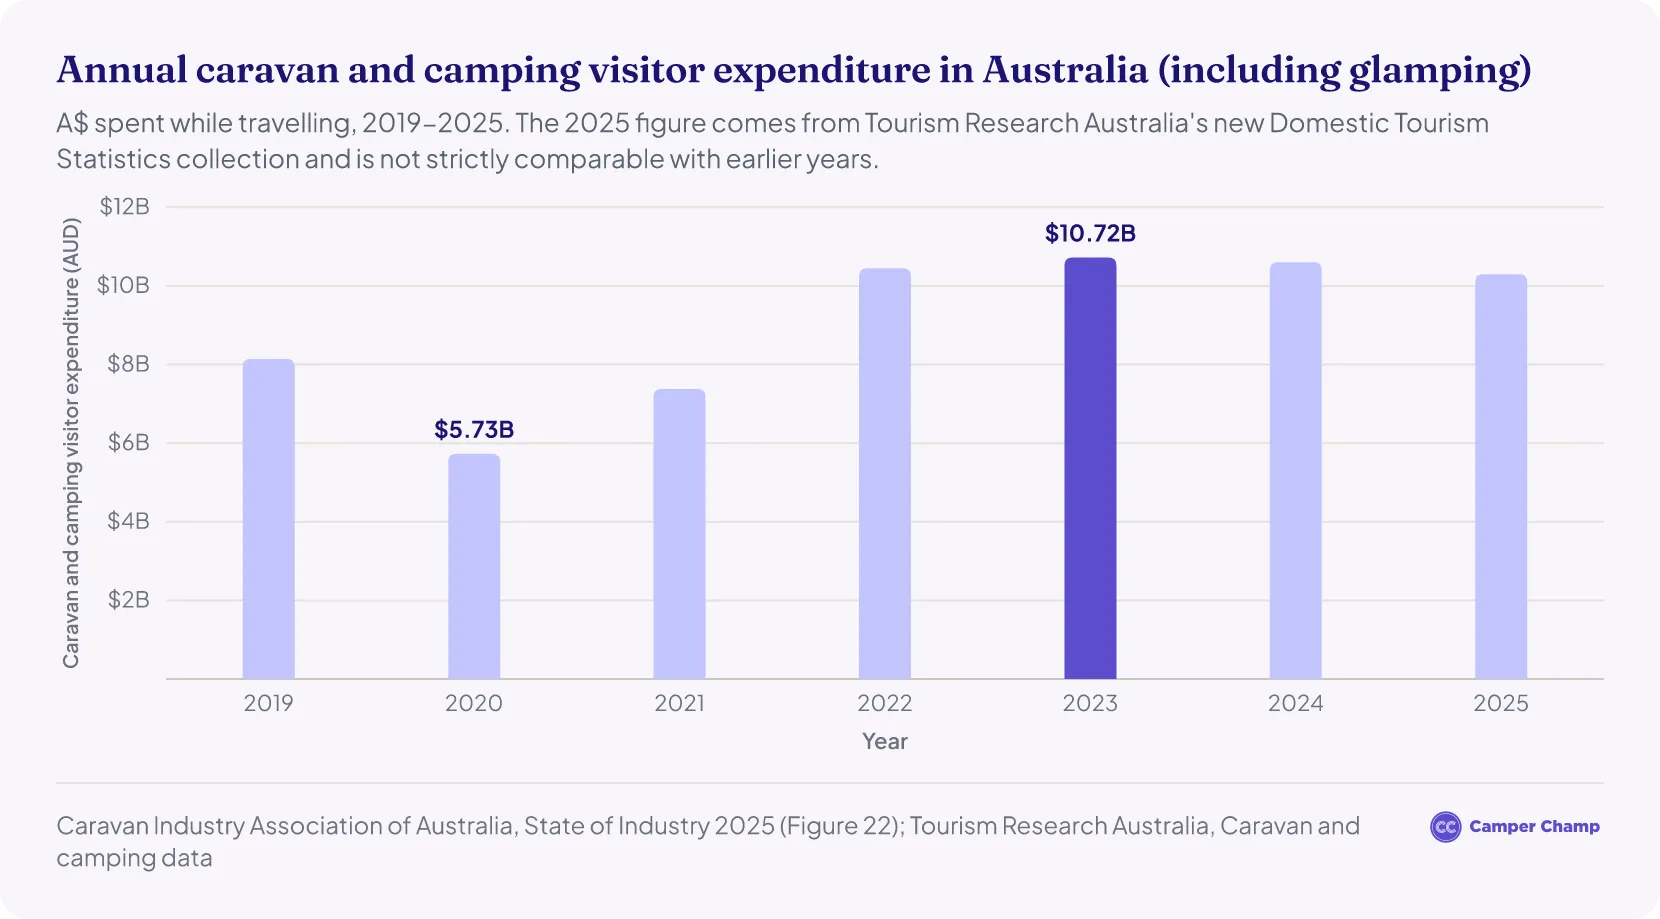
Australians spent A$10.6 billion while travelling on caravan and camping trips (including glamping) in 2024, the last year measured on the National Visitor Survey basis.2 In 2025, under Tourism Research Australia's new survey, spending reached A$12.6 billion, including A$10.3 billion spent while travelling.1
- Australians spent A$8.1 billion while travelling on caravan and camping trips in 2019 (pre-pandemic), the highest spending recorded before the pandemic.1
- A$5.73 billion in 2020 (during the pandemic), a 29.6% decrease from the previous year.2
- A$7.38 billion in 2021, a 28.8% increase from 2020.2
- A$10.45 billion in 2022, a 41.7% increase as the economy continued to recover.2
- Spending reached A$10.72 billion in 2023, a 2.6% increase from the previous year.2
- A$10.61 billion in 2024, a 1.1% decrease as travellers took shorter trips.2
How many caravan, camping and cabin sites are there in Australia?
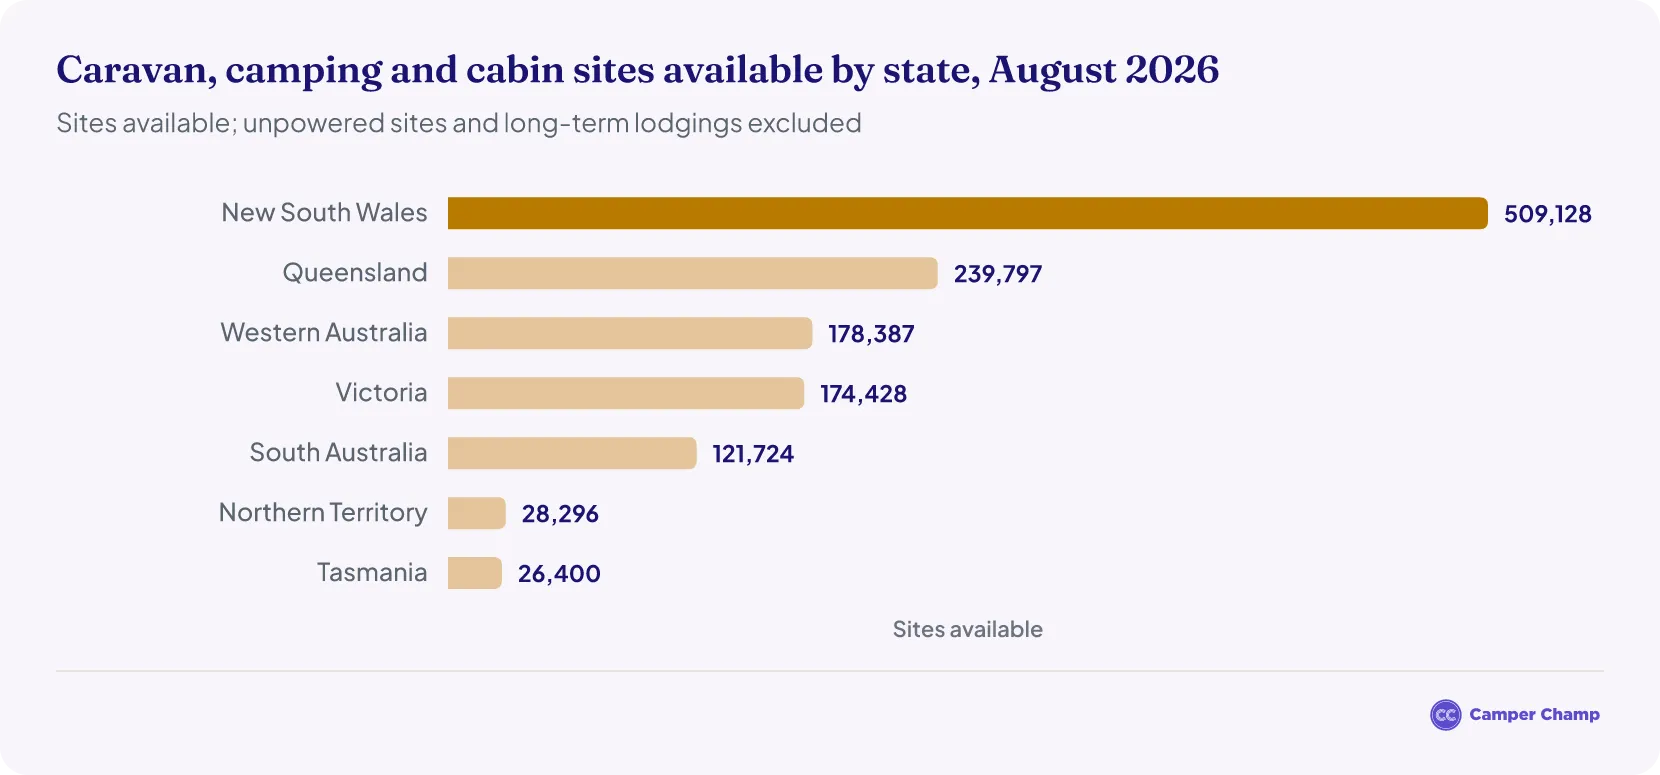
Tourism Research Australia's industry data counted 1,278,160 caravan, camping and cabin sites available across Australia in August 2026, with occupancy ranging from 30% in Victoria to 77% in Queensland (unpowered sites and long-term lodgings excluded).1
- New South Wales (NSW) has the most sites, 509,128 available, with an occupancy rate of 41%.
- Queensland (QLD) has 239,797 sites, with the highest occupancy rate of 77%.
- Western Australia (WA) has 178,387 sites, with an occupancy rate of 62%.
- Victoria (VIC) has 174,428 sites, with the lowest occupancy rate of 30%.
- South Australia (SA) has 121,724 sites, with an occupancy rate of 45%.
- Northern Territory (NT) has 28,296 sites, with an occupancy rate of 54%.
- Tasmania (TAS) has 26,400 sites, with an occupancy rate of 36%.
Demographics of Caravan and Camping Travellers in Australia
Age Groups
Glamping-specific demographic data is not published. The Caravan Industry Association of Australia's Caravan and Camping State of Industry 2025, built on Tourism Research Australia's National Visitor Survey, gives the closest picture for caravan and camping travellers in 2024.
Travellers aged 30-54 took 46% of caravan and camping trips in 2024, the largest age group, recording over 7.0 million trips, a new record.2
- Travellers aged 55 and over took 31% of trips but 42% of nights, as they tend to travel for longer.2
- Travellers aged 20-29 took 17% of trips and 12% of nights, and 15-19 year olds took 5% of trips.2
Lifecycle and Travel Party
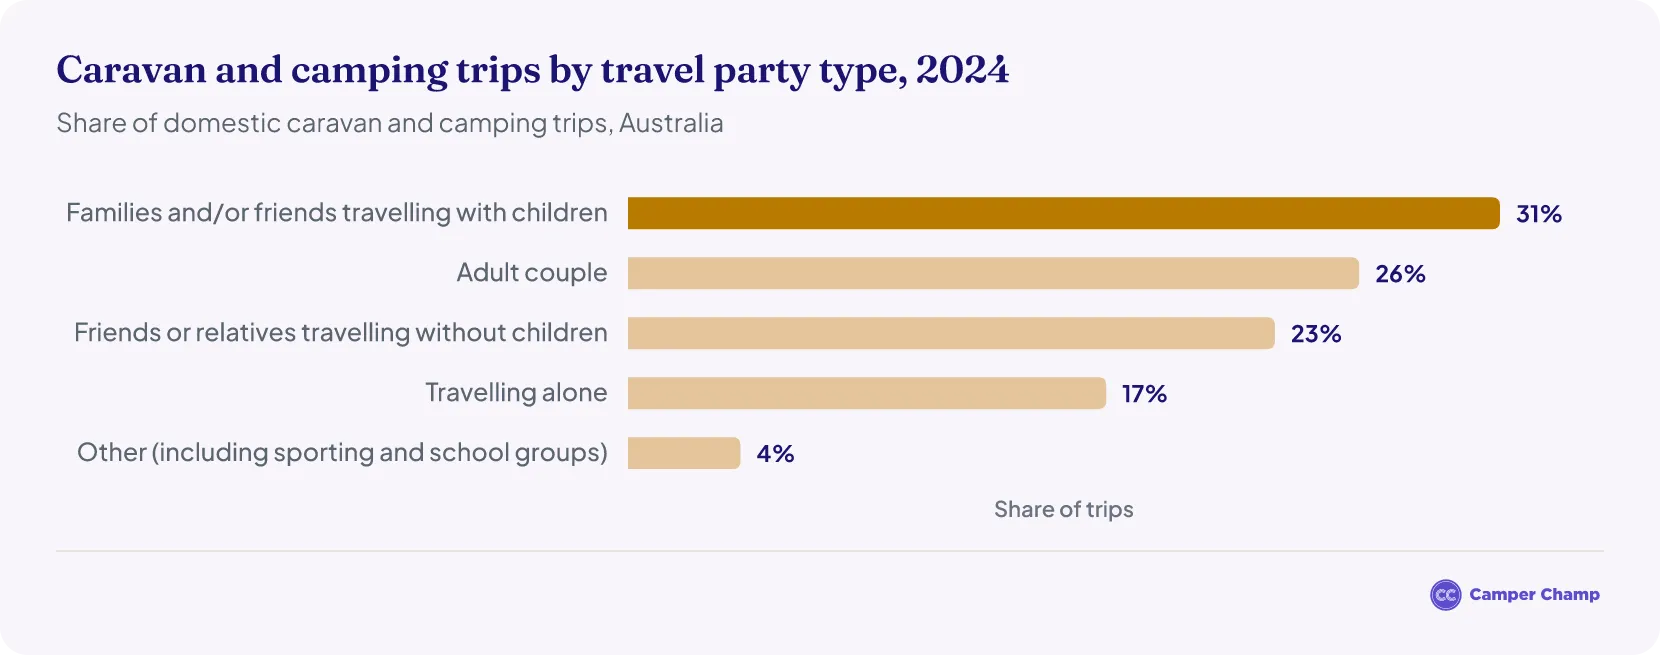
Families accounted for 37% of caravan and camping trips in 2024 and 34% of nights, with parents with children living at home taking 5.6 million trips.2
Why is glamping popular in Australia?
- Luxury and nature: Staying in comfort while exploring Australia’s landscapes.
- Post-pandemic outdoor travel boom: Open-air, nature-based holidays have become popular and boosted glamping demand.
- Eco-friendly accommodations: Sustainable, off-grid stays appealing to environmentally conscious travellers.
- Instagram-worthy experiences: Photogenic glamping spaces have been popularized because of social media appeal.
Where do Australians go glamping? Caravan and camping trips by state
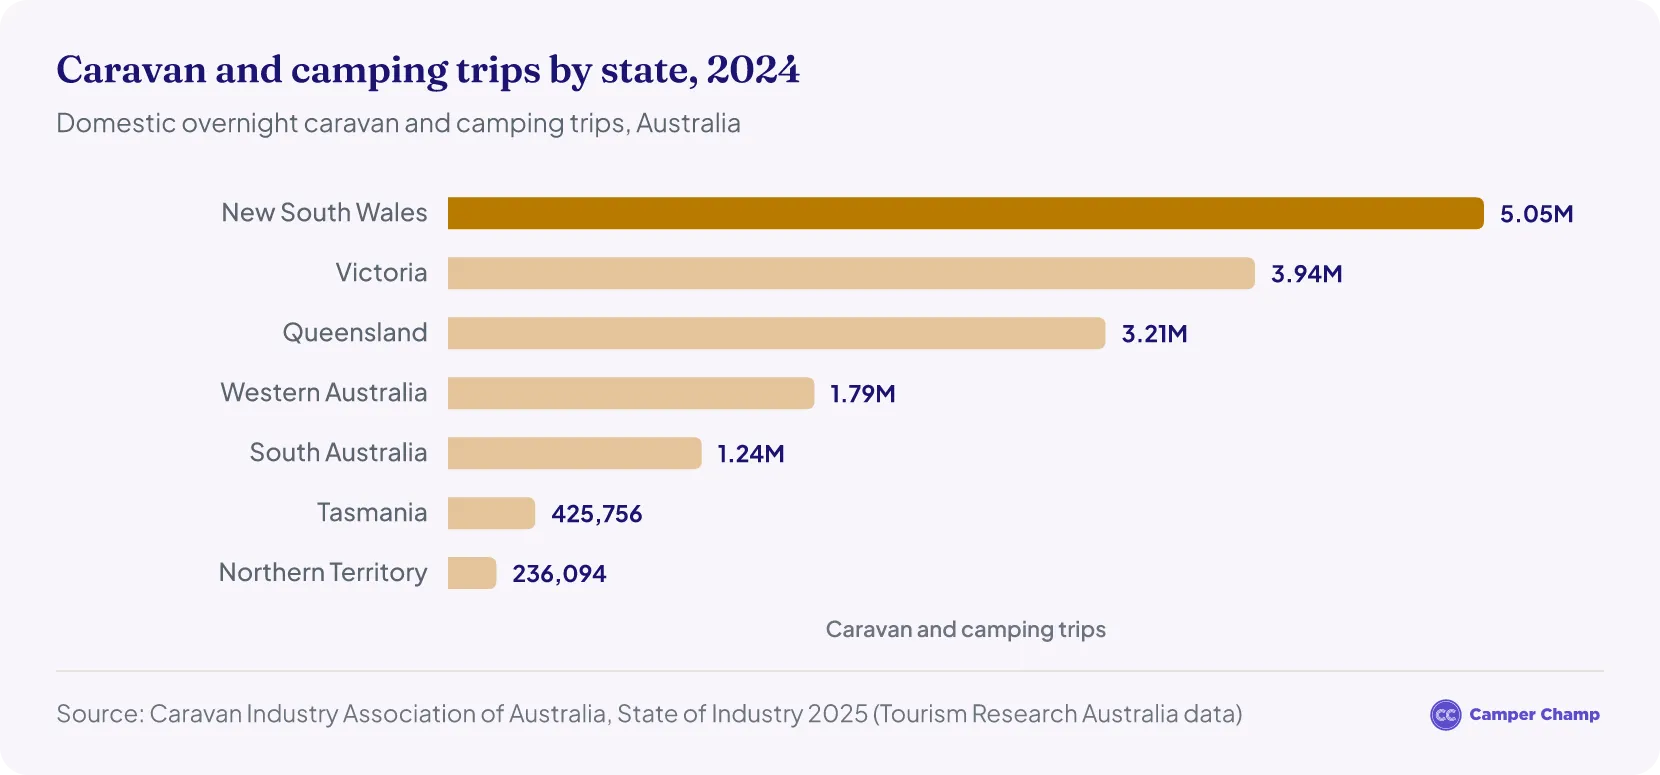
Australians took a record 17.3 million caravan and camping trips in 2025, up 14% on 2024, and spent 57.9 million nights away.1 Only New South Wales has released its 2025 state figure so far; the latest published figures for the other states are for 2024.
- New South Wales was the top destination with 5.5 million domestic caravan and camping visitors in 2025, more than a third of the nation’s caravan and camping visitors, staying 18.2 million nights.3 Top glamping spots: Blue Mountains (luxury wilderness tents), Byron Bay (coastal retreats) and Jervis Bay (beachfront glamping at Paperbark Camp).
- Victoria recorded 3.9 million caravan and camping trips in 2024, with Yarra Valley2 (vineyard glamping), Mornington Peninsula (hot springs and safari tents) and the Great Ocean Road (coastal eco-lodges) as top glamping spots.
- Queensland recorded 3.2 million caravan and camping trips in 2024, up 7% on 2023,2 with the Daintree Rainforest (eco-lodges), Whitsunday Islands (beachside tents) and the Scenic Rim (mountain hideaways).
- Western Australia recorded 1.8 million caravan and camping trips in 2024, with Ningaloo Reef2 (beachside safari tents), Margaret River (vineyard glamping) and Rottnest Island (eco-tent resorts).
- Northern Territory recorded 236,000 caravan and camping trips in 2024, with Uluru2 (Longitude 131°, an ultra-luxury tented resort) and Kings Canyon (outback safari tents).
Economic Impact of Glamping in Australia
Impact on Local Communities
- 87% of caravan and camping nights (including glamping) were spent in regional Australia in 2025, and $8.6 billion of the $10.3 billion spent while travelling went to regional areas.1
- Caravan parks (glamping included) earned a record $3.3 billion in revenue in 2025, up 7% or about $207 million on 2024.4
- The caravan and camping industry contributes $27.1 billion a year to the Australian economy across parks, manufacturing, trade and visitor spending.4
Average Spend on Glamping Trips
- Glamping costs more than camping but less than luxury hotels.
- The average spend per caravan and camping trip was A$728 in 2025, or A$217 per night over an average stay of 3.4 nights.4
- Luxury glamping sites (like Longitude 131° near Uluru) can cost over A$1000 per night.
- Midrange glamping is A$200-A$350 per night.
How to choose the best glamping site?
There are many factors in choosing the most suitable glamping site:
- Location like beach, rainforest, outback or wine country.
- Accommodation types like safari tents, eco-pods, yurts or treehouses. These all offer different experiences.
- Amenities like heating, private bathroom, kitchen access and onsite dining.
- Budget is a big factor. Costs range from A$150 for basic, over A$500 for luxury and over A$1,000 per night for high-end sites.
- Family-friendly sites should have kid-friendly amenities and multiple sleeping options.
Best Seasons for Glamping
- Peak glamping seasons include Spring (Sep – Nov) and Autumn (Mar – May) with ideal temperatures across most regions.
- Winter (Jun – Aug) glamping works best in mild-climate regions like Queensland and the Northern Territory.
- Summer (Dec – Feb) is for coastal glamping but may be too hot for inland locations like Uluru.
What to expect from glamping?
- Luxury beds and linen – no sleeping bags or thin mattresses.
- Private bathroom – many have ensuite toilets and showers.
- Electricity and heating – most premium sites have powered tents and heating.
- Fine dining or self-catering – possible to have an onsite chef or private BBQ.
- Outdoor activities – hiking, wildlife spotting, stargazing or spa treatments.
Campervan hire in Australia
- Adelaide motorhome hire
- Alice Springs
- Brisbane
- Broome motorhome hire
- Cairns motorhome hire
- Campervan hire in Darwin
- Campervan hire in Launceston
- Campervan hire in Melbourne
- Devonport
- Gold Coast campervan rental
- Hobart motorhome hire
- Perth
- Sydney motorhome hire
- Tasmania
References
- Caravan and Camping Data (Tourism Research Australia) · Tourism Research Australia ↑ b c d e f g h i j k
- Caravan Industry Association of Australia — Caravan and Camping State of Industry 2025 · assets.pc.gov.au ↑ b c d e f g h i j k l m n o p q
- NSW number one for caravan and camping trips (Destination NSW media release, 14 August 2026) · destinationnsw.com.au ↑
- Australian caravan and camping industry statistics (Caravan Industry Association of Australia, updated 8 September 2026) · caravanindustry.com.au ↑ b c
- Tourism Spending Statistics - The Great Barrier Reef · Tourism Research Australia
- Caravan Park Statistics and Industry Reports · caravanindustry.com.au
- Visitor Economy Strategy 2030 · austrade.gov.au
- Glamping Trends in Victoria · visitvictoria.com
- New South Wales Caravan and Camping Visitors (2024) · destinationnsw.com.au
- Nature-Based Stays Data · queensland.com
- EcoTourism and Glamping Trends · northernterritory.com
- Regional Accommodation Reports · westernaustralia.com