

Published
Australia drowning statistics 2026: key facts
A total of 313 people lost their lives to drowning across Australia in the year ending June 2026.1 That’s a 12% decrease from the year before, but still 10% above the 10-year average of 284 deaths. The figures come from the National Drowning Report 2026 by Royal Life Saving Society – Australia and Surf Life Saving Australia, which covers 1 July 2025 to 30 June 2026, and equal a fatal drowning rate of 1.13 per 100,000 people.
How many people die from drowning in Australia each year?
A total of 313 lives were lost to drowning in the year ending June 2026, down from 356 the year before but still 10% above the 10-year average.1 Each year below is a financial year ending 30 June, so 2026 means July 2025 to June 2026. All years use the revised totals in the 2026 report, so some differ from what was first published.
- In 2019, the number of deaths stood at 254.1 By 2020, fatalities declined to 246, reflecting a 3% decrease, likely due to reduced recreational water activity during the pandemic.
- In 2021, deaths rose to 2881 as restrictions eased and water activity resumed. The year 2022 recorded 323 deaths, at the time the highest figure since at least 2002.
- Although there was a decrease to 266 deaths in 2023, this was short-lived.1
- In 2024, drowning deaths rose again to 313, an increase of approximately 18% compared to the previous year.1
- In 2025, deaths climbed to 356, the highest total of the past decade, before falling 12% to 313 in 2026.1
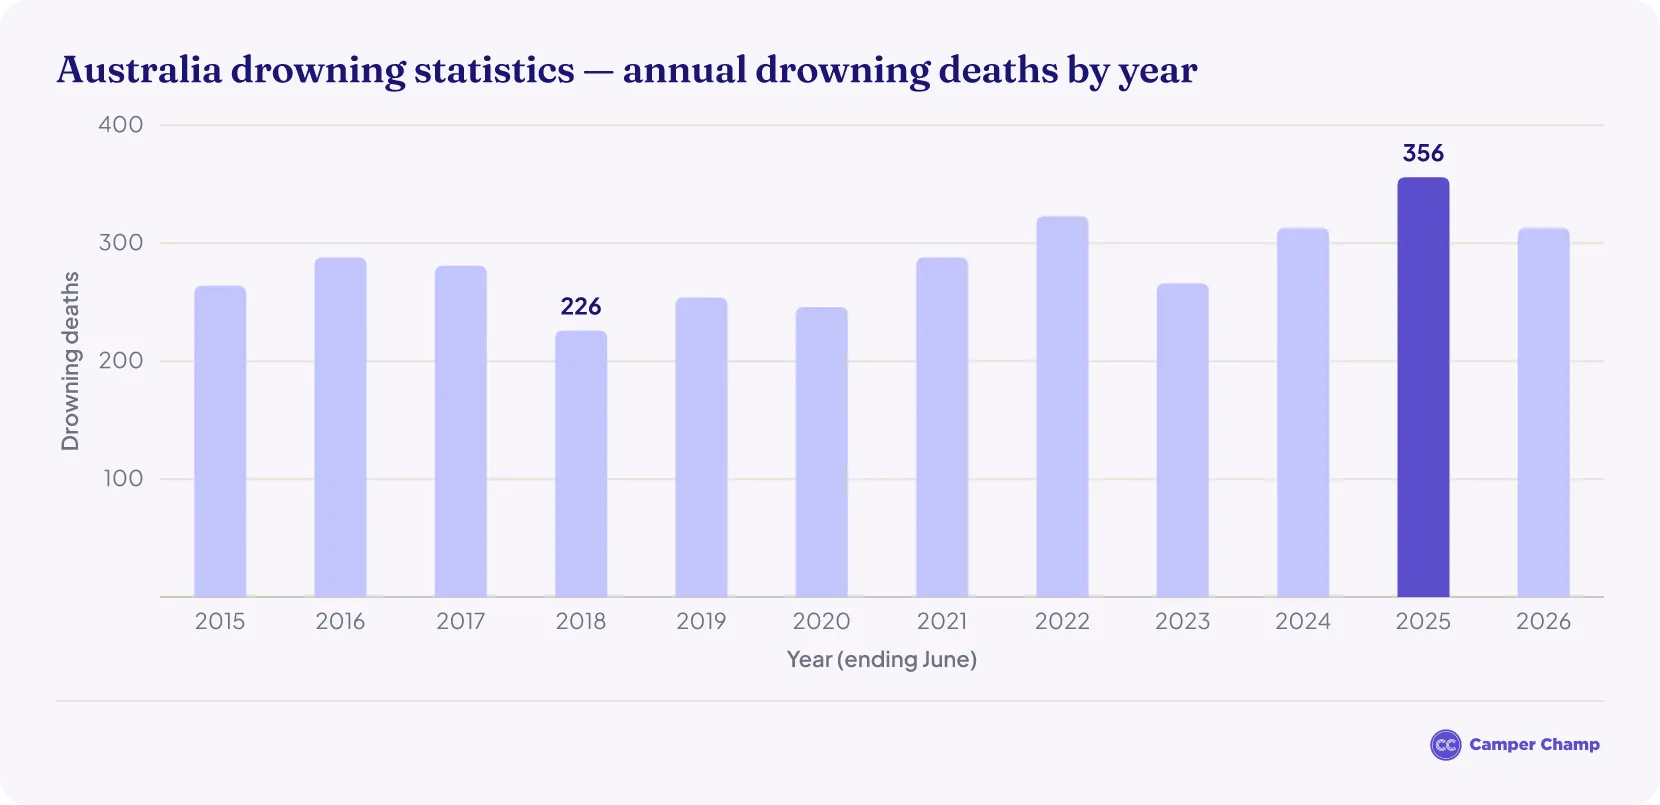
Drowning deaths in Australia by year
| Year (July–June) | Drowning deaths |
|---|---|
| 2025–26 | 313 |
| 2024–25 | 356 |
| 2023–24 | 313 |
| 2022–23 | 266 |
| 2021–22 | 323 |
| 2020–21 | 288 |
| 2019–20 | 246 |
| 2018–19 | 254 |
| 2017–18 | 226 |
| 2016–17 | 281 |
| 2015–16 | 288 |
| 2014–15 | 264 |
Source · Royal Life Saving Society Australia — National Drowning Report 2026.
Which state has the most drowning deaths?
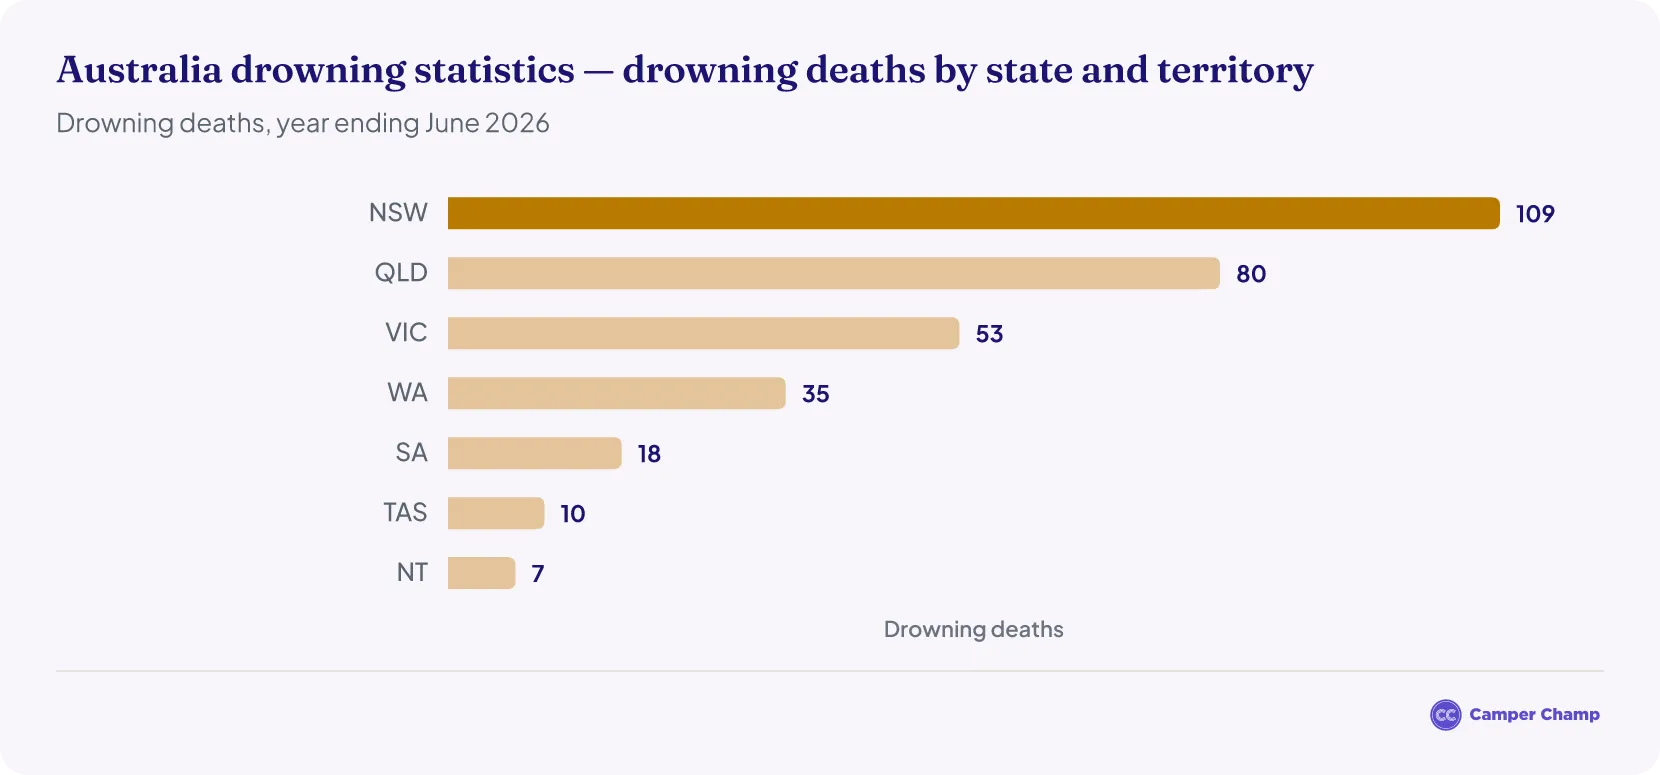
New South Wales recorded the highest number of drowning fatalities in Australia in the year ending June 2026, with a total of 109 deaths.1
- Queensland followed with 80 reported drowning deaths, while Victoria and Western Australia recorded 53 and 35 deaths, respectively.1
- South Australia, Tasmania, and the Northern Territory collectively accounted for 35 drowning fatalities, with 18 in South Australia, 10 in Tasmania, and 7 in the Northern Territory.1
- The Australian Capital Territory reported the lowest number of drowning deaths nationwide, with fewer than five fatalities (the exact number is withheld for privacy).1
Which state has the highest drowning rate?
Measured per head of population, the Northern Territory had the highest drowning rate in the year ending June 2026, at 2.63 deaths per 100,000 people, more than double the national rate of 1.13.1
- Tasmania (1.73), Queensland (1.41), New South Wales (1.27) and Western Australia (1.15) were also above the national rate.1
- South Australia (0.95) and Victoria (0.75, the lowest of the six states) were below it.1
- Over the 10 years from 2016/17 to 2025/26, the regions with the highest drowning rates were Torres and Cape in Queensland (6.07 per 100,000) and the Kimberley in Western Australia (4.17).1
Drowning risk outside the cities and when travelling
The largest share of people who drowned lived in major cities (38%), but people from outside the cities drowned at much higher rates: 2.2 times the city rate for inner regional areas, 2.8 times for outer regional areas and 3.9 times for remote and very remote areas.1
- 14% of people who drowned did so 100km or more from home, often while travelling.1
Who is most at risk of drowning in Australia?
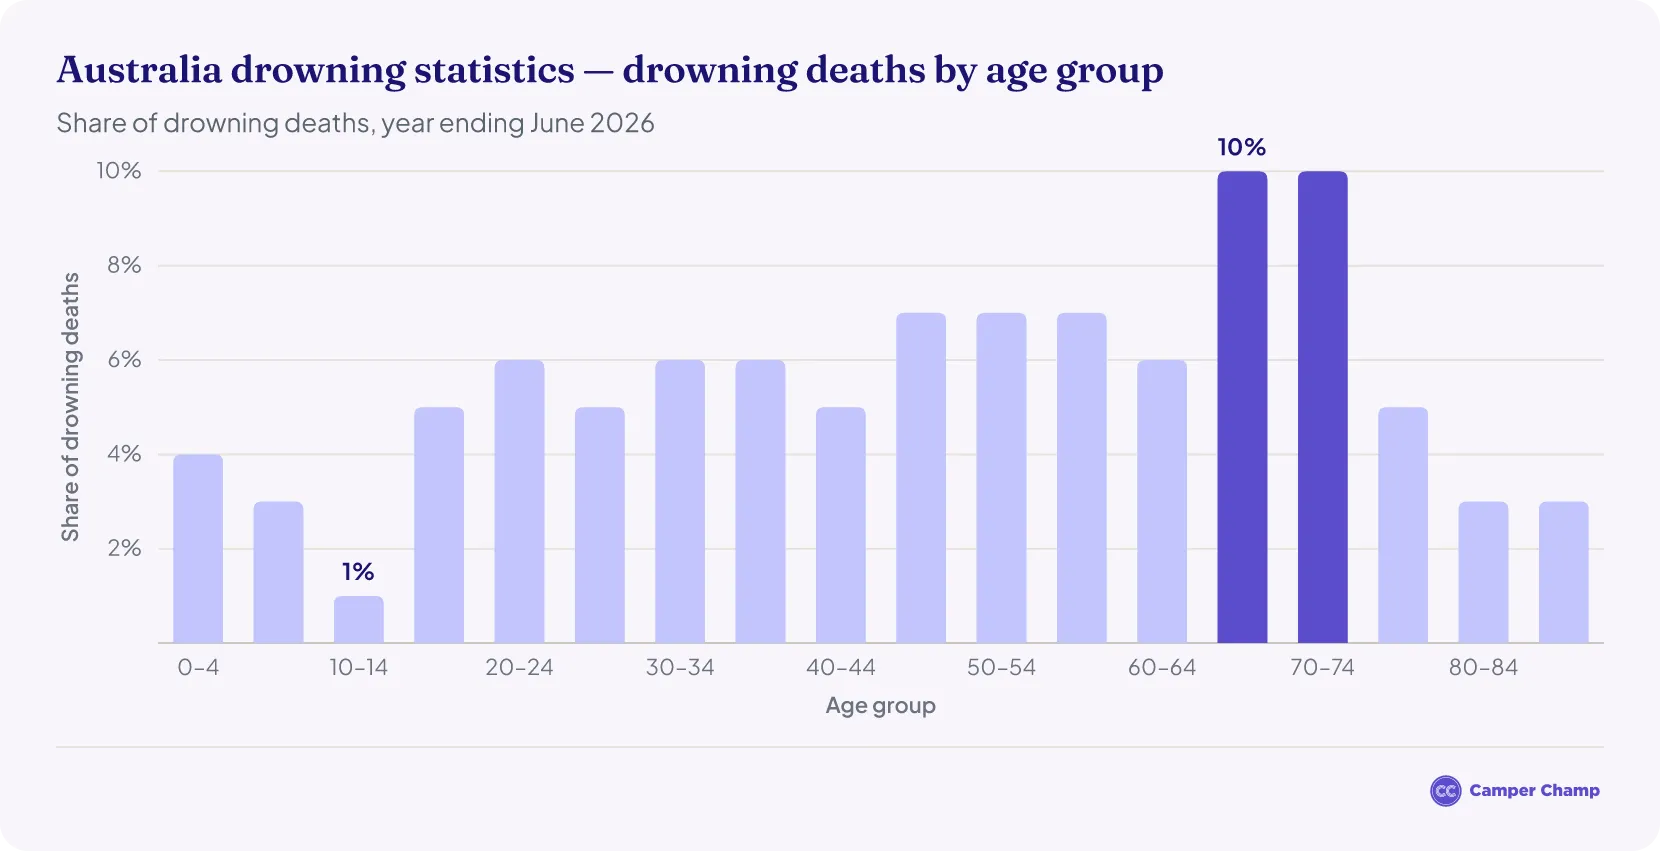
Older adults aged 65–74 made up the largest share of victims, with the 65–69 and 70–74 age groups each representing 10% of deaths.1
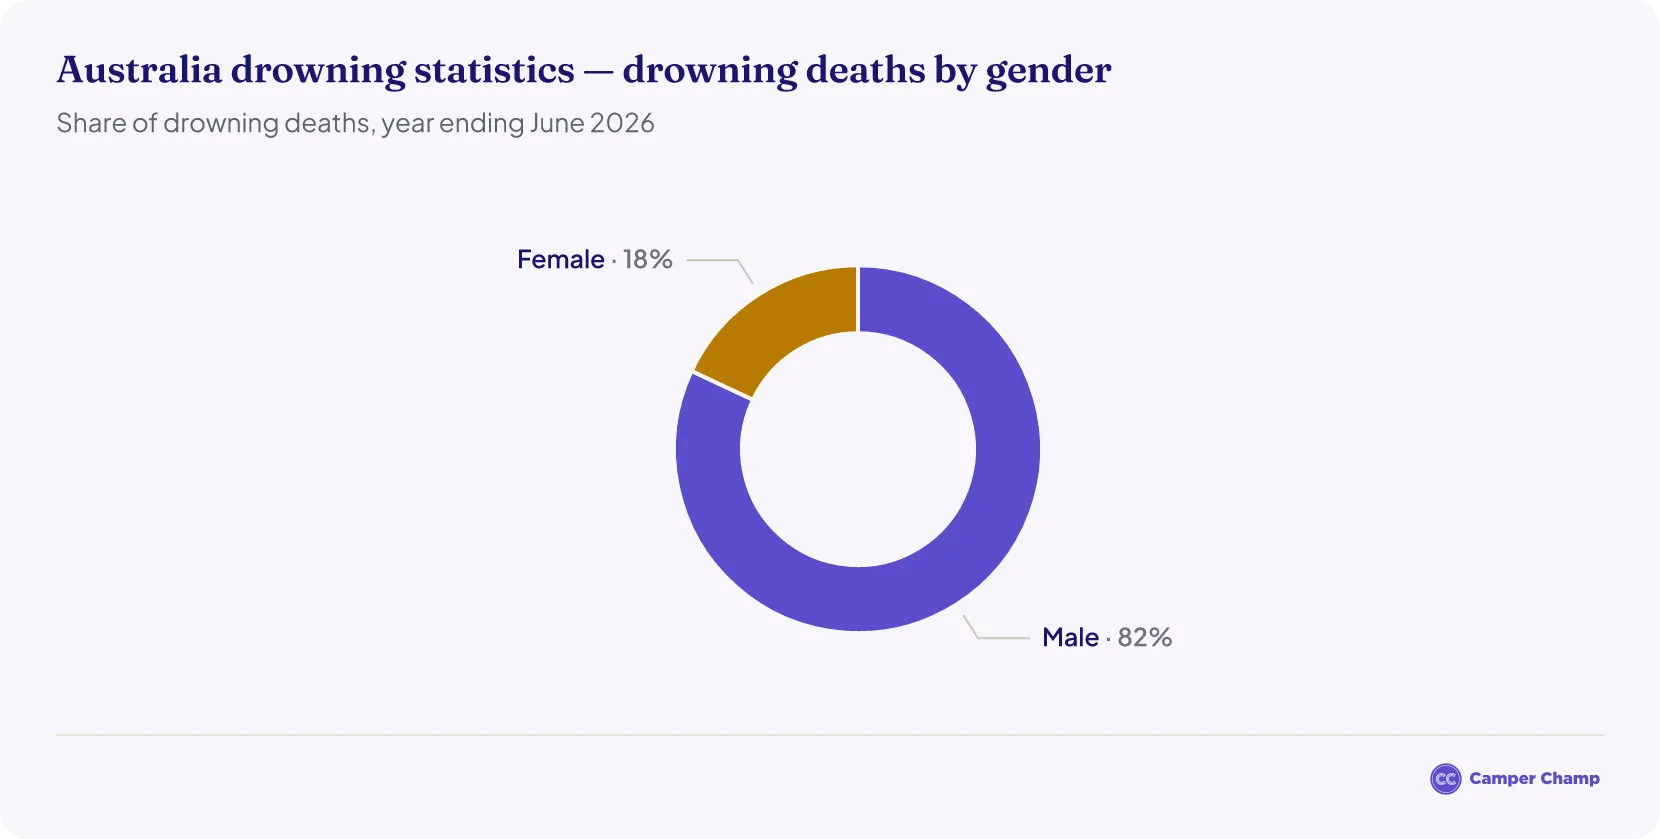
- Men accounted for 82% of deaths.1
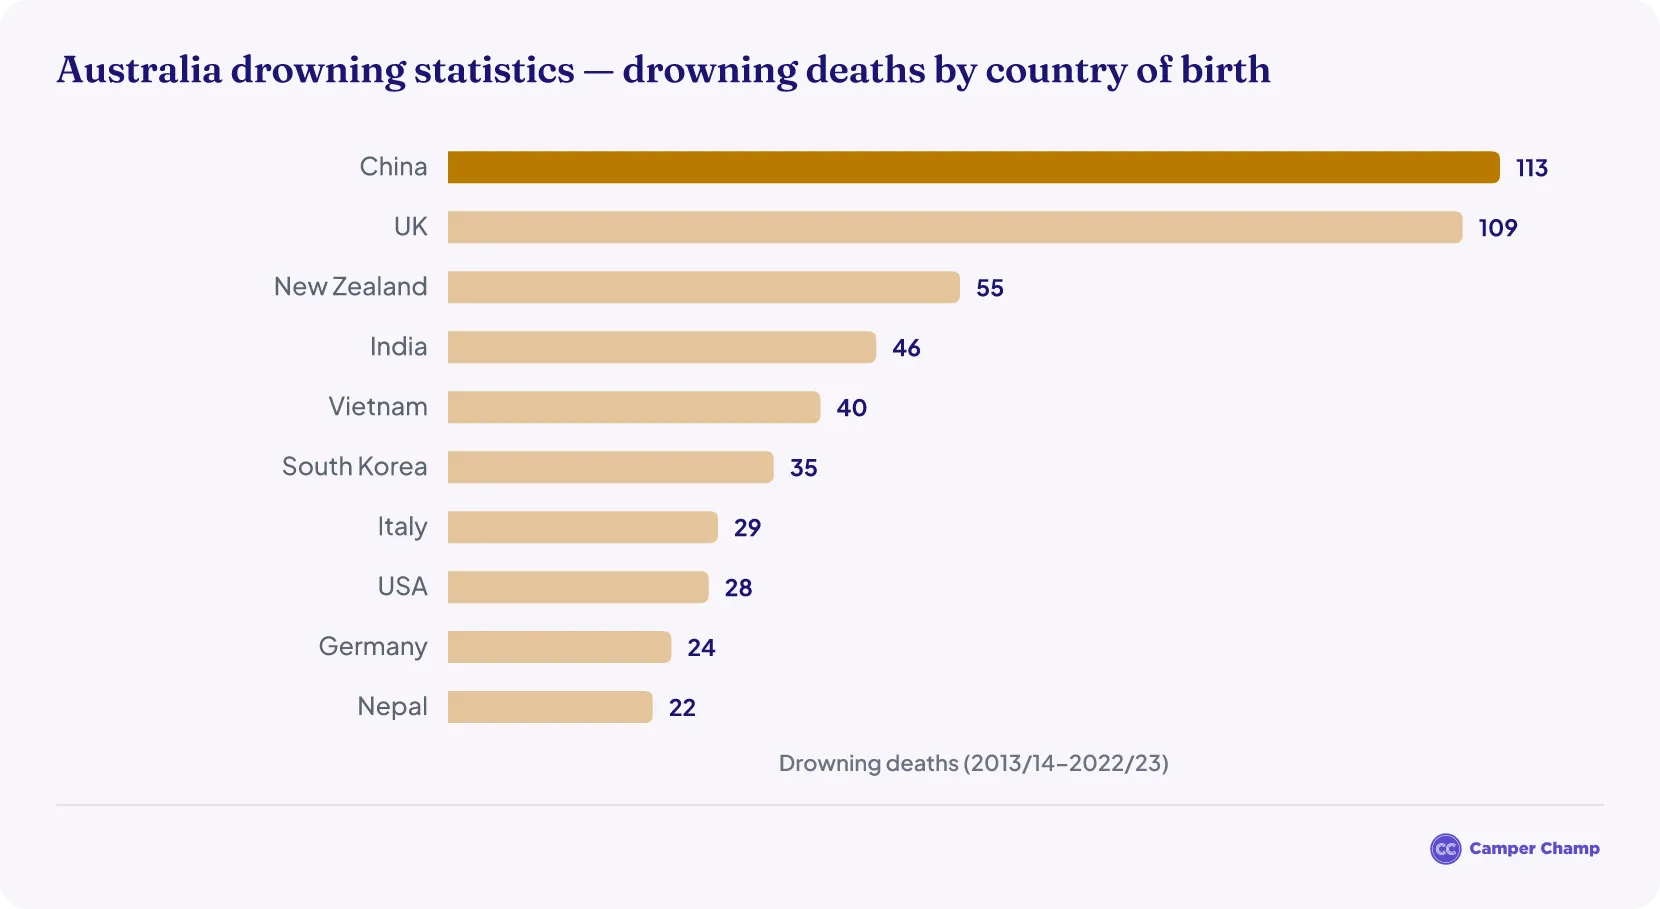
- Where country of birth was known, 39% of people who drowned were born overseas1, most commonly in China, the UK, India and the USA.
- Nearly three in ten (29%) drowned within 10km of home, while 14% drowned 100km or more from home, often while travelling.1
Age groups: who is most at risk?
Individuals aged 65–69 and 70–74 made up the largest share of drowning fatalities across Australia, each accounting for 10% of total deaths in the year ending June 2026.1
This was followed by:
Together, these five age brackets made up 41% of all drowning deaths.1
Country of birth: where were drowning victims born?
In the year ending June 2026, 76 people who drowned were born overseas, 39% of those whose country of birth was known and 21% below the 10-year average.1 People born in China were the largest group, followed by those born in the UK, India, the USA, New Zealand and Japan.
Over the ten years to June 2023:
How many children drown in Australia each year?
11 children aged 0–4 drowned in Australia in the year ending June 2026, or 4% of all drowning deaths. That is 27% fewer than the year before and 39% below the 10-year average of 18, a fatal drowning rate of 0.73 per 100,000 children.1
When do most drowning deaths occur in Australia?
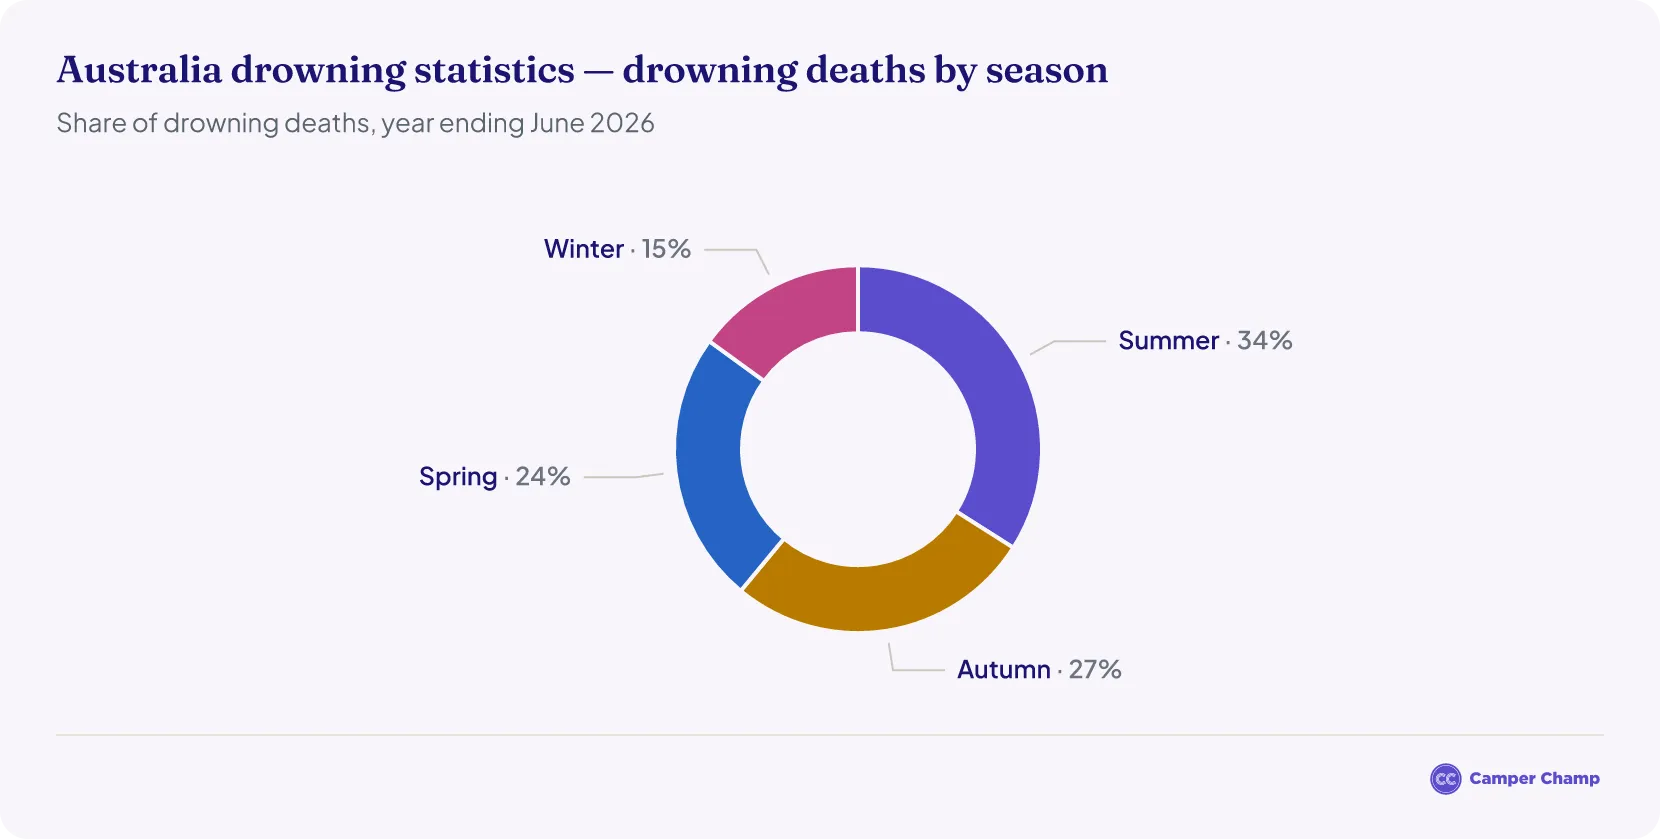
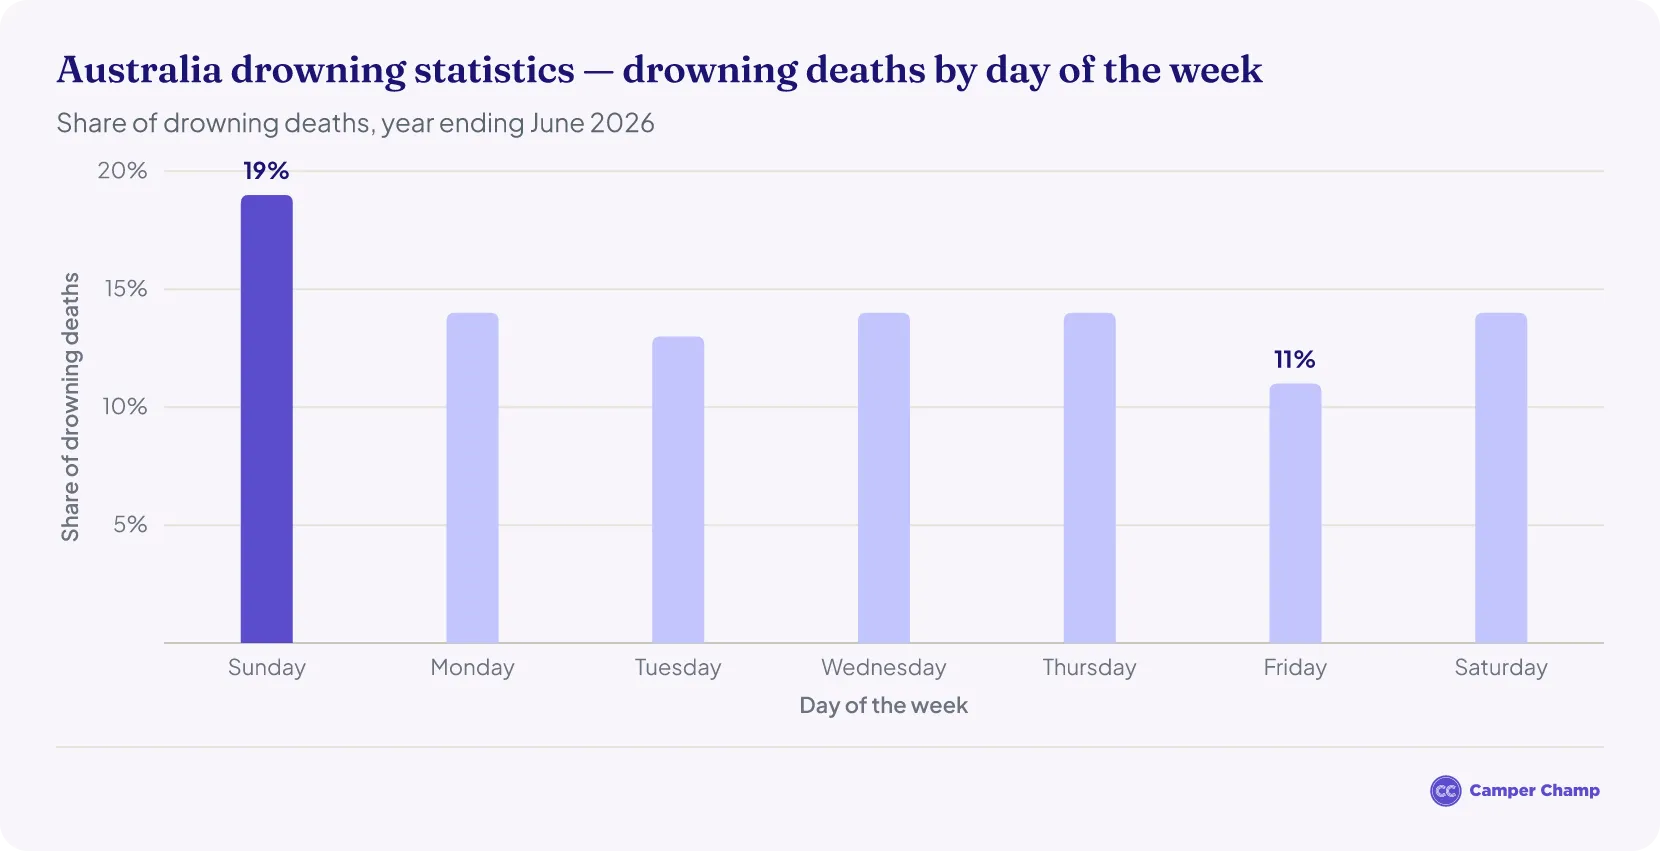
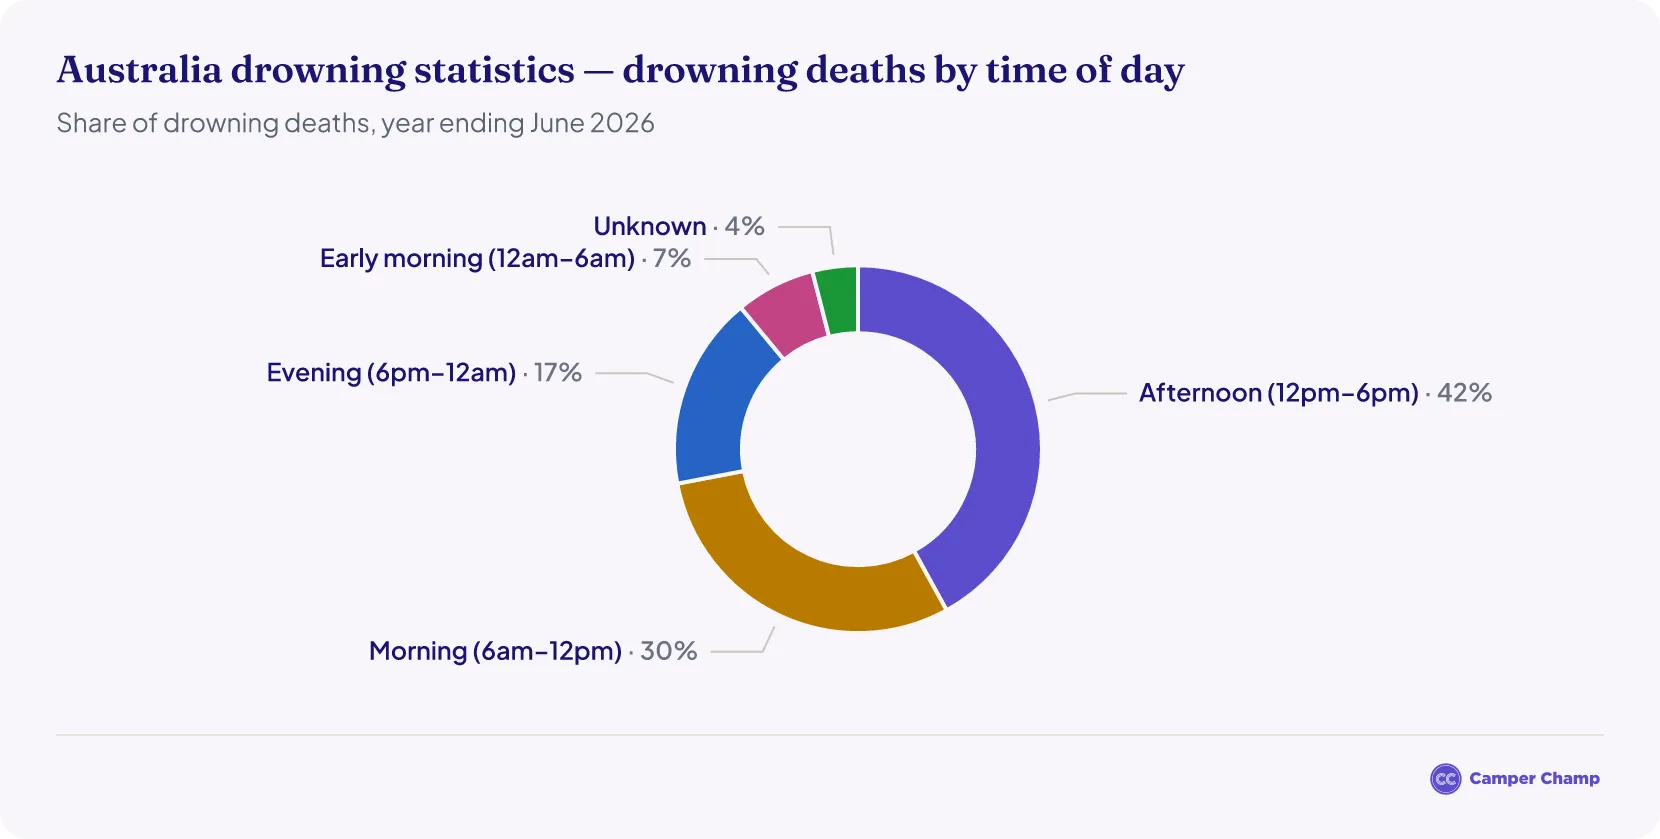
The largest share of drowning deaths in the year ending June 2026 occurred during summer (34%), especially in the afternoon (12pm–6pm), with Sunday the riskiest day of the week (19% of deaths).1
- Warmer seasons, Sundays, and daylight hours present the highest risk for drowning incidents in Australia.
Season: when do most drownings occur?
The summer season recorded the highest number of drowning deaths in Australia, accounting for 34% of all fatalities in the year ending June 2026.1
- Autumn followed with 27% and spring with 24%, while winter accounted for 15%.1
Day of the week: which days are riskiest?
Sunday recorded the highest number of drowning deaths in the year ending June 2026, accounting for 19% of all cases.1
Time of day: when are drownings most likely?
The largest share of drowning deaths in the year ending June 2026 occurred in the afternoon (12pm to 6pm), accounting for 42% of all incidents.1
Where are drowning accidents most likely to happen?
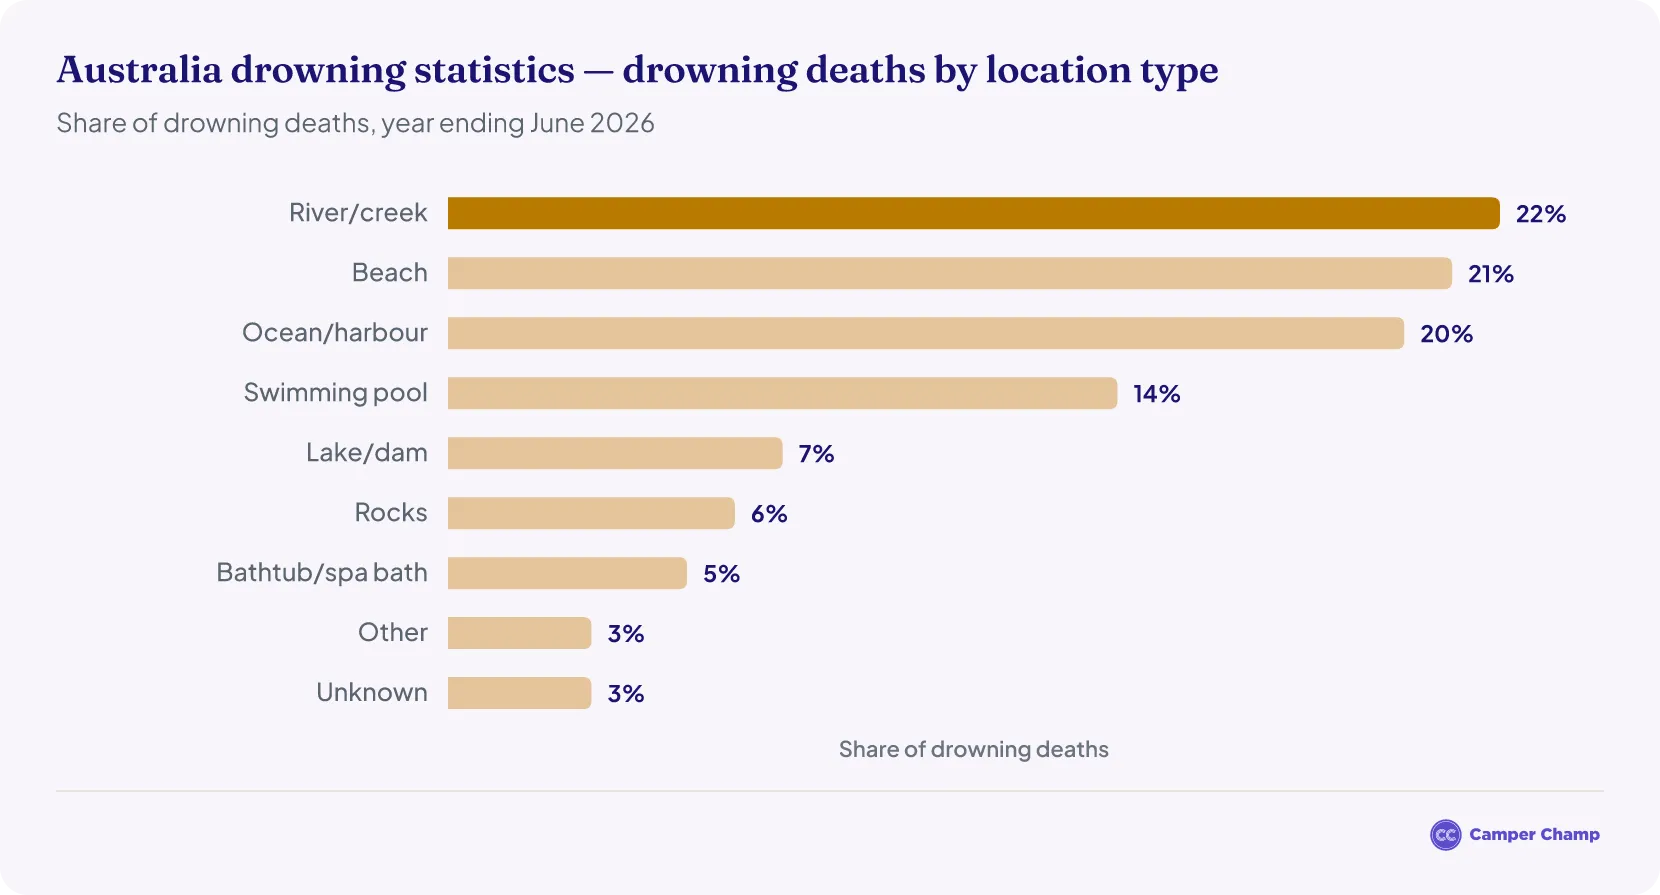
Rivers and creeks accounted for 22% of all drowning deaths in Australia in the year ending June 20261, making them the most common location for fatal incidents.
- Beaches followed closely with 21%1, while the toll at rivers and creeks highlights the ongoing danger of inland waterways, particularly in regional and remote areas (see also our crocodile attack statistics).
- Oceans and harbours were responsible for 20% of deaths1, often involving boating, rock fishing, or swimming in unpatrolled coastal areas (see also our shark attack statistics).
- Swimming pools contributed to 14% of fatalities1. People aged 65 and over made up 55% of pool drownings and children aged 0–4 made up 14%, and two thirds happened in home pools.
- Other environments including lakes and dams (7%), rocks (6%), and bathtubs or spas (5%) also posed significant risks, while 3% of cases occurred at unknown locations.1
Beach drowning statistics in Australia
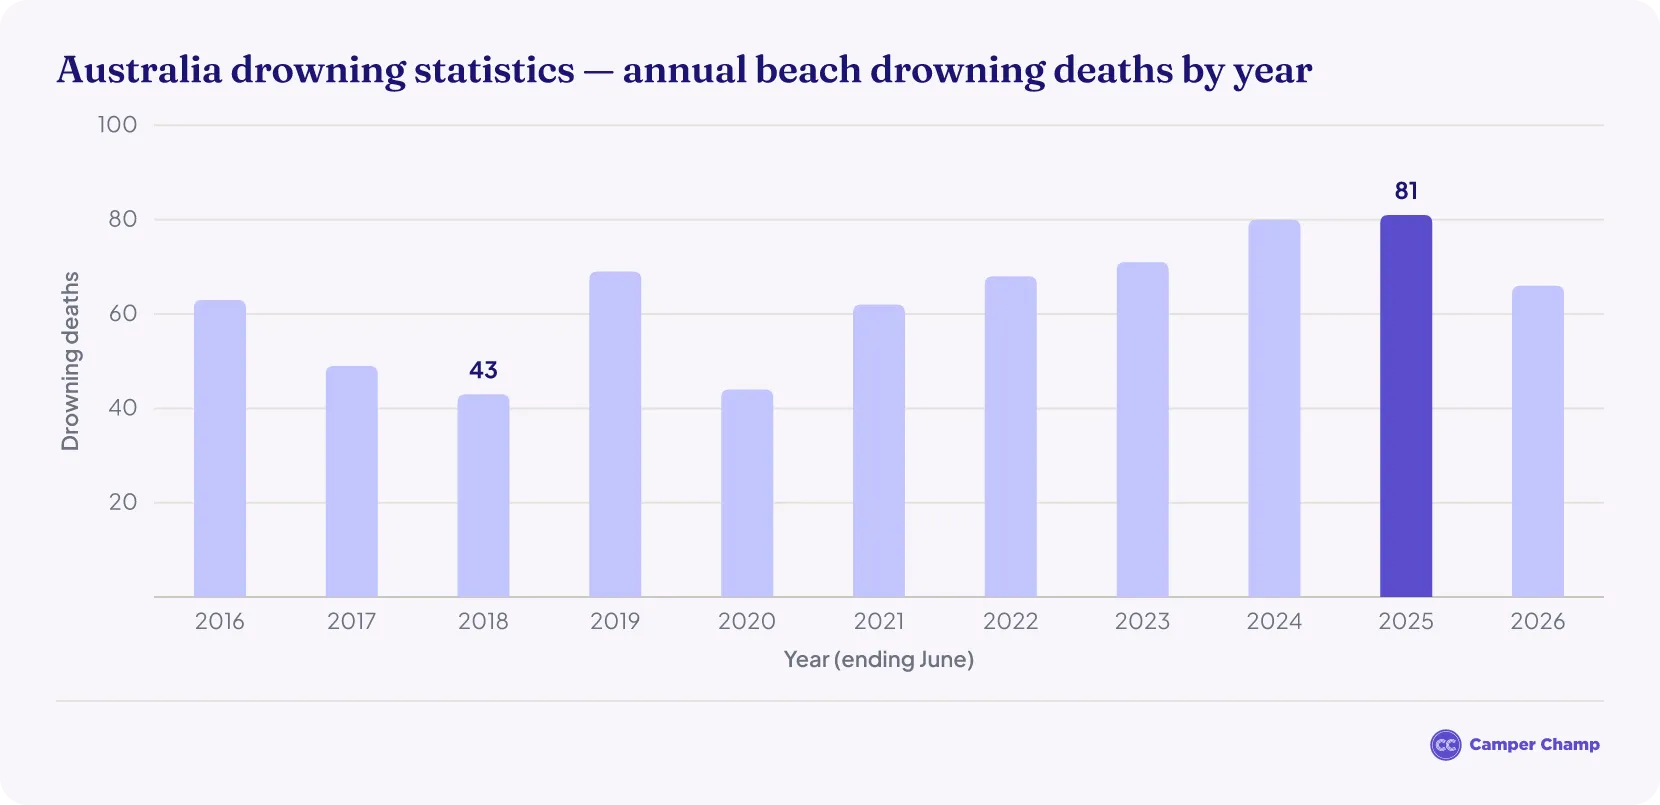
A total of 66 people lost their lives at Australian beaches in the year ending June 2026, a 19% decrease from 81 the year before (figures as revised in the National Drowning Report 2026).1
- In 2019, there were 69 beach drownings. When the COVID-19 pandemic emerged in 2020, the number decreased to 44, representing a 36% drop from the previous year.1
- As restrictions eased in 2021 and water activities resumed, fatalities rose to 62.1
- Beach drownings continued to increase in subsequent years, reaching 68 deaths in 2022, 71 in 2023, 80 in 2024 and a decade high of 81 in 2025.1
- The 66 deaths recorded in 2026 are the lowest total since 2021 but still 5% above the 10-year average of 63.1
- Rip currents contributed to at least 47% of beach drowning deaths; whether a rip was involved was unknown in a further 15% of cases.1
How many people drown in swimming pools in Australia?
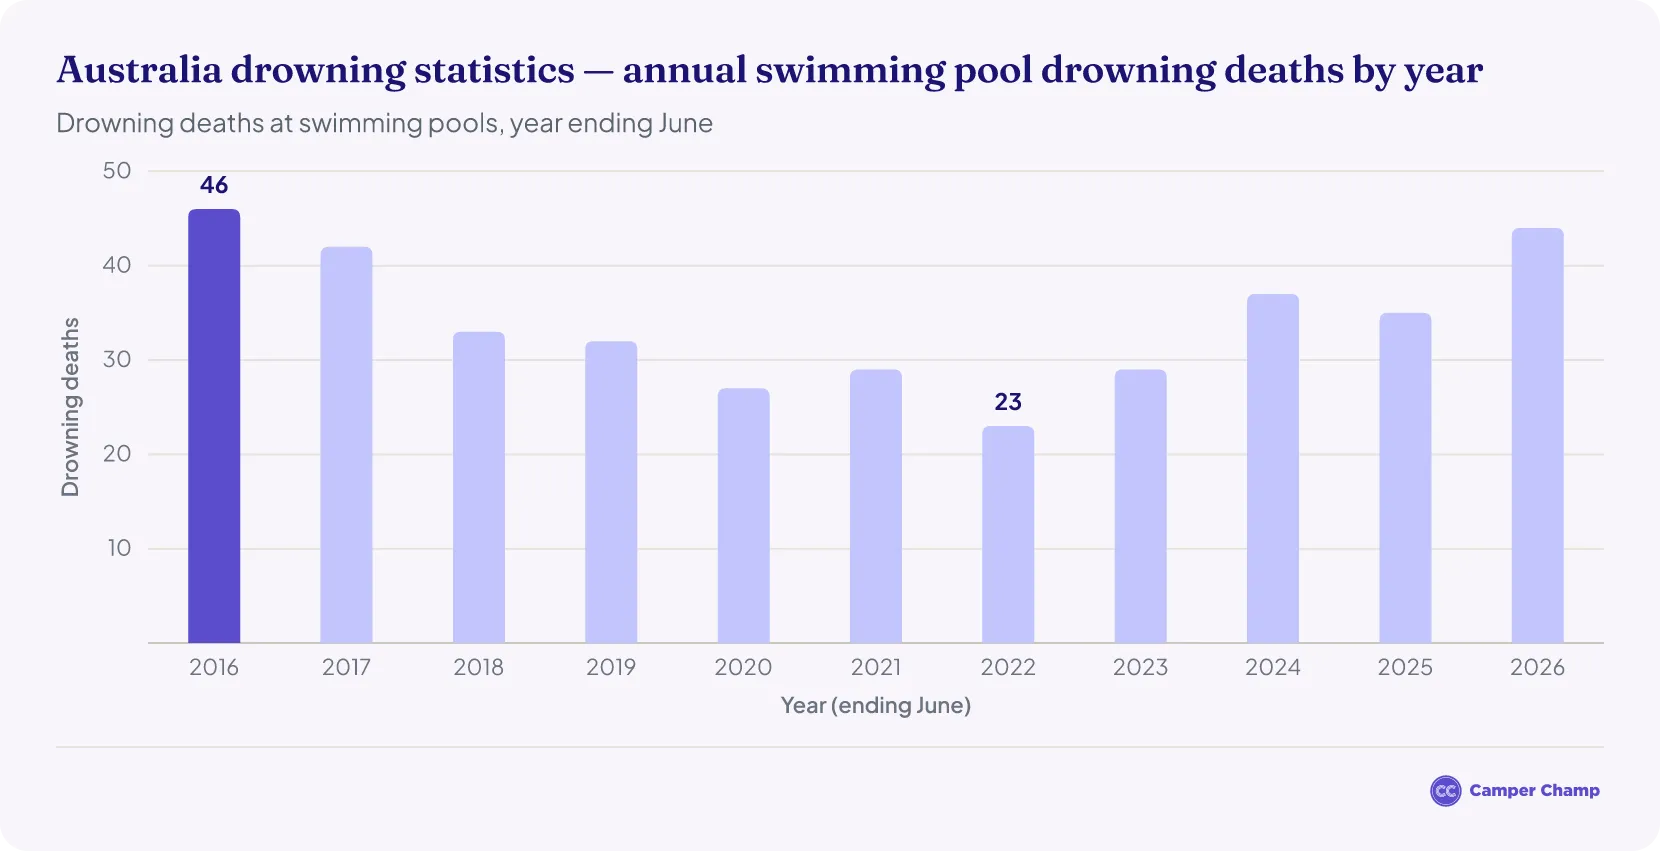
44 people drowned in swimming pools across Australia in the year ending June 2026.1
- In 2019, there were 32 pool drowning deaths. The number fell to 27 in 2020 and 29 in 2021, then to a decade low of 23 in 2022.1
- Pool deaths rose again to 29 in 2023, 37 in 2024 and 35 in 2025 (figures as revised in the National Drowning Report 2026).1
- In 2026, fatalities climbed to 44, a 26% increase on the previous year, 33% above the 10-year average and the highest total since 2016.1 Two-thirds (66%) occurred in home swimming pools.
What activities lead to drowning in Australia?
Swimming and recreating was the most common activity before a drowning death in the year ending June 2026, linked to 28% of deaths.1
- Unintentional falls into water were second at 13%. Children aged 0–9 made up 28% of fall-related deaths, and people aged 65 and over made up 35%.1
- Boating accounted for 10% of drowning deaths, 11% below the 10-year average.1
- Almost a third (30%) of boating deaths happened in incidents where more than one person drowned, and people aged 65 and over accounted for 34% of them.1
Are safety campaigns making a difference?
Yes, especially for young children. Drowning deaths among children aged 0–4 were 39% below the 10-year average in the year ending June 2026, a fall Royal Life Saving credits to pool fencing laws, public education, advocacy and enforcement.1
How can Australia reduce drowning deaths?
The National Drowning Report 2026 sets out six key safety messages:1
- Always supervise children in, on and around water.
- Learn swimming, water safety and lifesaving skills.
- Wear a lifejacket when boating, rock fishing or paddling.
- Swim at a patrolled beach between the red and yellow flags.
- Avoid alcohol and drugs around water.
- Know the conditions and check the weather.
The report names three trends that prevention has to tackle: declining swimming skills, an ageing population, and a changing climate that is pushing drowning beyond summer into spring and autumn.1
Other resources
Campervan hire in Australia
- Adelaide
- Alice Springs campervan rental
- Broome motorhome hire
- Campervan hire in Brisbane
- Campervan hire in Cairns
- Campervan hire in Sydney
- Darwin
- Devonport motorhome hire
- Gold Coast
- Hobart motorhome hire
- Launceston
- Melbourne
- Perth motorhome hire
- Tasmania
References
- Royal Life Saving National Drowning Report 2026 · royallifesaving.com.au ↑ b c d e f g h i j k l m n o p q r s t u v w x y z a2 b2 c2 d2 e2 f2 g2 h2 i2 j2 k2 l2 m2 n2 o2 p2 q2 r2 s2 t2 u2 v2 w2 x2 y2 z2 a3 b3 c3 d3 e3 f3 g3 h3 i3 j3 k3 l3 m3 n3 o3 p3 q3 r3 s3
- Royal Life Saving National Drowning Report 2024 · royallifesaving.com.au ↑ b c
- RLSSA — National Drowning Report 2024 · royallifesaving.com.au
- SLSA — Coastal safety and drowning statistics · sls.com.au